. 2024 Jan 2;40(1):btae020.
doi: 10.1093/bioinformatics/btae020.

scMAE: a masked autoencoder for single-cell RNA-seq clustering

Affiliations

scMAE: a masked autoencoder for single-cell RNA-seq clustering

Zhaoyu Fang et al. Bioinformatics. .

Abstract

Motivation: Single-cell RNA sequencing has emerged as a powerful technology for studying gene expression at the individual cell level. Clustering individual cells into distinct subpopulations is fundamental in scRNA-seq data analysis, facilitating the identification of cell types and exploration of cellular heterogeneity. Despite the recent development of many deep learning-based single-cell clustering methods, few have effectively exploited the correlations among genes, resulting in suboptimal clustering outcomes.

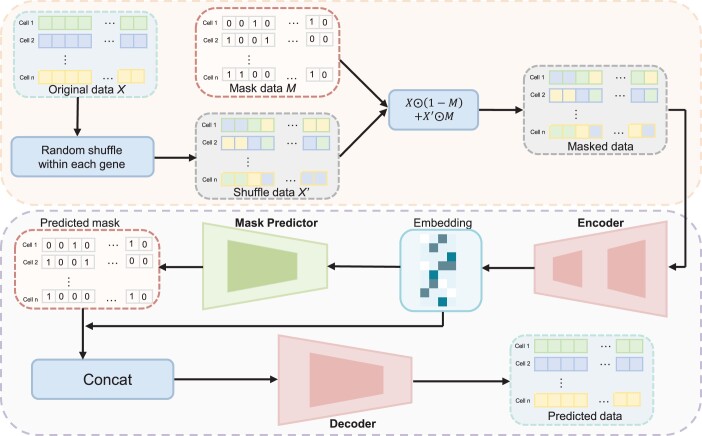
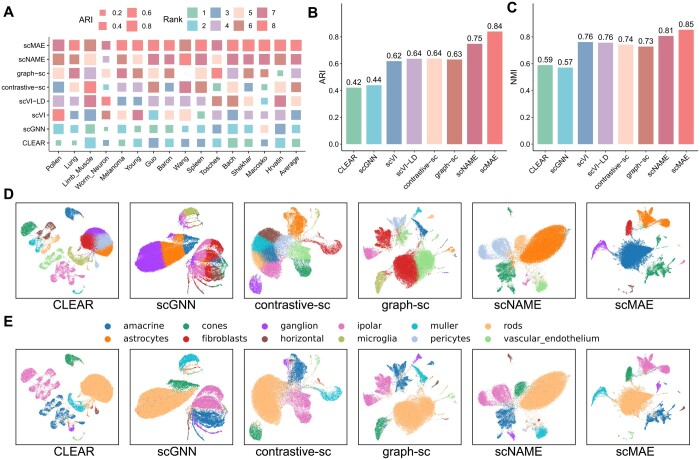
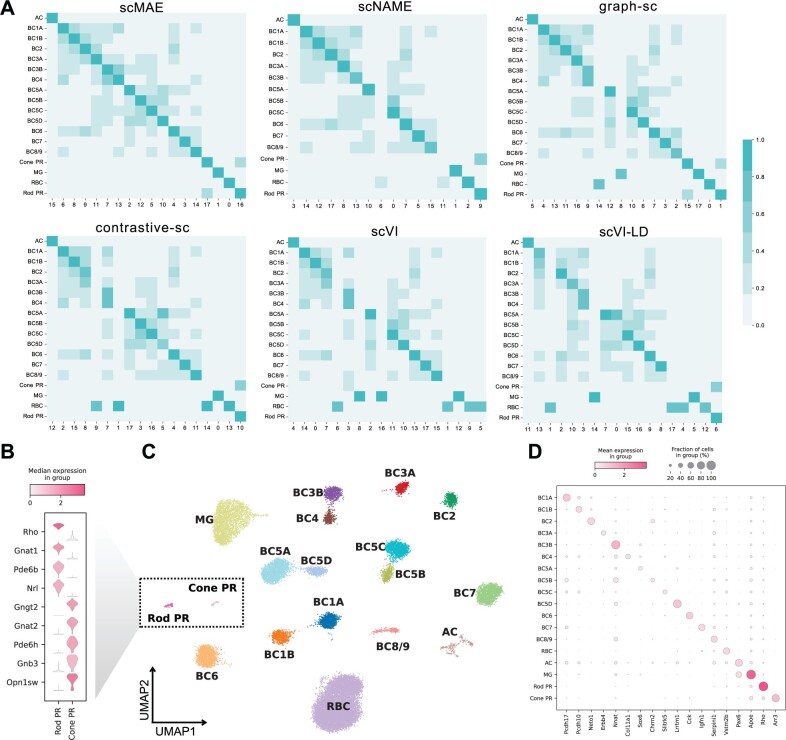
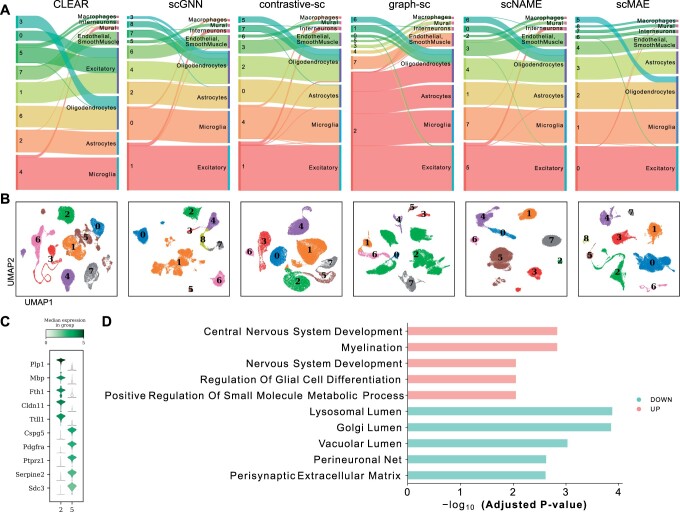
Results: Here, we propose a novel masked autoencoder-based method, scMAE, for cell clustering. scMAE perturbs gene expression and employs a masked autoencoder to reconstruct the original data, learning robust and informative cell representations. The masked autoencoder introduces a masking predictor, which captures relationships among genes by predicting whether gene expression values are masked. By integrating this masking mechanism, scMAE effectively captures latent structures and dependencies in the data, enhancing clustering performance. We conducted extensive comparative experiments using various clustering evaluation metrics on 15 scRNA-seq datasets from different sequencing platforms. Experimental results indicate that scMAE outperforms other state-of-the-art methods on these datasets. In addition, scMAE accurately identifies rare cell types, which are challenging to detect due to their low abundance. Furthermore, biological analyses confirm the biological significance of the identified cell subpopulations.

Availability and implementation: The source code of scMAE is available at: https://zenodo.org/records/10465991.


Conflict of interest statement

The authors declare no competing interests.

Figures

Figure 1.
Figure 1.
Workflow of scMAE. Initially, the expression matrix X undergoes a certain degree of shuffling to create a masked matrix, XM. Next, XM is fed into the encoder, which captures the correlations among genes to generate low-dimensional cell embeddings. These embeddings are then inputted into a mask predictor to determine if masking was applied to the gene expression matrix during the first step. In the fourth step, the low-dimensional embeddings and vectors indicating masking status are concatenated and supplied to the decoder. Finally, these trained embeddings are employed for downstream cell clustering.
Figure 2.
Figure 2.
Real scRNA-seq data analysis results. (A) ARI scores of scMAE and seven comparative methods on 15 real scRNA-seq datasets. Each block represents the performance of a method on a dataset, where the size indicates the ARI score and the color represents the rank. The last column shows the average ARI score of each method. (B) Bar plots showing the average ARI values on the 15 real scRNA-seq datasets using scMAE and seven comparative methods. (C) Bar plots showing the average NMI values on the 15 real scRNA-seq datasets using scMAE and seven comparative methods. (D) UMAP visualization of the cell embeddings for Macosko datasets learned by scMAE and comparative methods. The colors represent the clustering labels of each method. (E) UMAP visualization of the cell embeddings for Macosko datasets learned by scMAE and comparative methods. The colors represent the true cell types.
Figure 3.
Figure 3.
scMAE can accurately identify rare cell types. (A) Overlap of top 50 differentially expressed genes in clusters detected by scMAE and comparative methods with true cell types. (B) Violin plot showing the differential expression genes of the Rod PR cluster and the Cone PR cluster. (C) UMAP visualization of the cell embeddings for the Macosko dataset learned by scMAE. The colors represent the scMAE clustering labels. (D) Dot plot showing the marker genes of the clusters.
Figure 4.
Figure 4.
Biological analysis in the Hrvatin dataset. (A) Sankey plots of clustering results and true cell types for scMAE and comparative methods. For each subplot, the left side represents the clustering labels generated by each method, while the right side represents the true cell types. (B) UMAP visualization of the cell embeddings learned by scMAE and comparative methods. The colors represent the clustering labels assigned by each method. (C) Violin plot showing the differential expression genes of Cluster 2 and Cluster 5. (D) The enriched Gene Ontology (GO) terms in Cluster 2 versus Cluster 5.

References

    1. Bach K, Pensa S, Grzelak M. et al. Differentiation dynamics of mammary epithelial cells revealed by single-cell RNA sequencing. Nat Commun 2017;8:2128. - PMC - PubMed
    1. Baron M, Veres A, Wolock SL. et al. A single-cell transcriptomic map of the human and mouse pancreas reveals inter-and intra-cell population structure. Cell Syst 2016;3:346–60.e4. - PMC - PubMed
    1. Blondel VD, Guillaume J-L, Lambiotte R. et al. Fast unfolding of communities in large networks. J Stat Mech 2008;2008:P10008.
    1. Botta S, Marrocco E, de Prisco N. et al. Rhodopsin targeted transcriptional silencing by DNA-binding. eLife 2016;5:e12242. - PMC - PubMed
    1. Buettner F, Natarajan KN, Casale FP. et al. Computational analysis of cell-to-cell heterogeneity in single-cell RNA-sequencing data reveals hidden subpopulations of cells. Nat Biotechnol 2015;33:155–60. - PubMed

Publication types

MeSH terms