. 2024 Feb 1;131(2):338-359.
doi: 10.1152/jn.00513.2022. Epub 2024 Jan 17.

Motor patterns of patients with spinal muscular atrophy suggestive of sensory and corticospinal contributions to the development of locomotor muscle synergies

Affiliations

Motor patterns of patients with spinal muscular atrophy suggestive of sensory and corticospinal contributions to the development of locomotor muscle synergies

Vincent C K Cheung et al. J Neurophysiol. .

Abstract

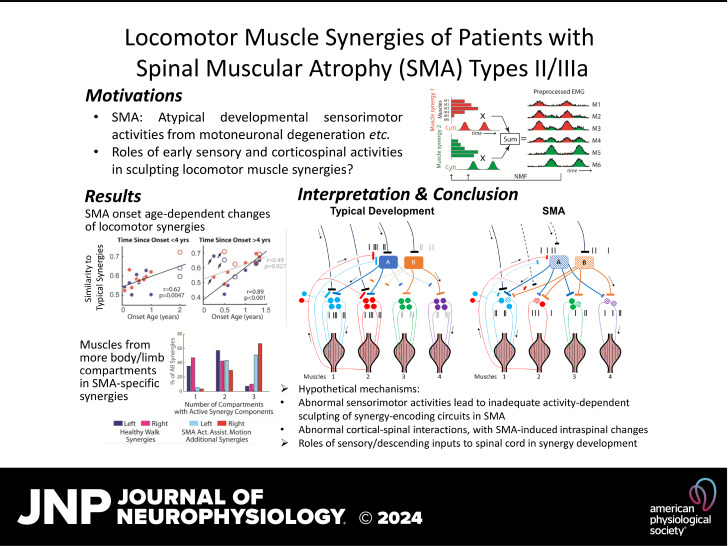
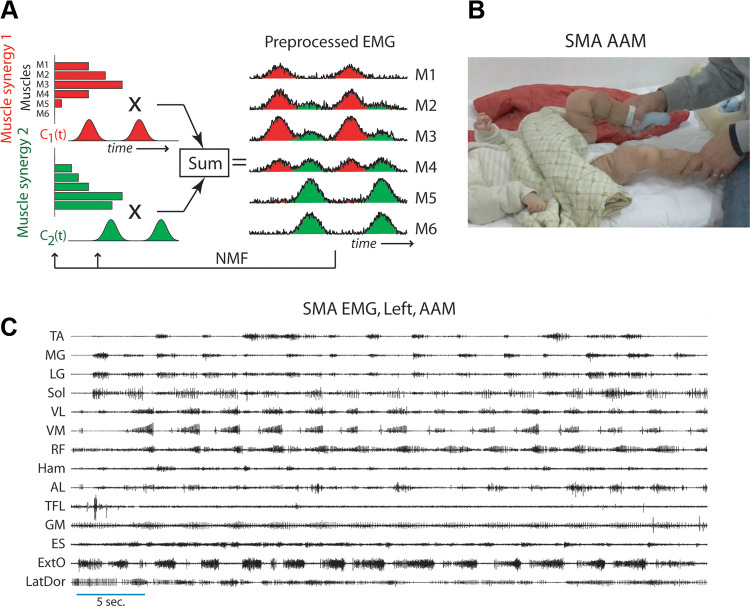
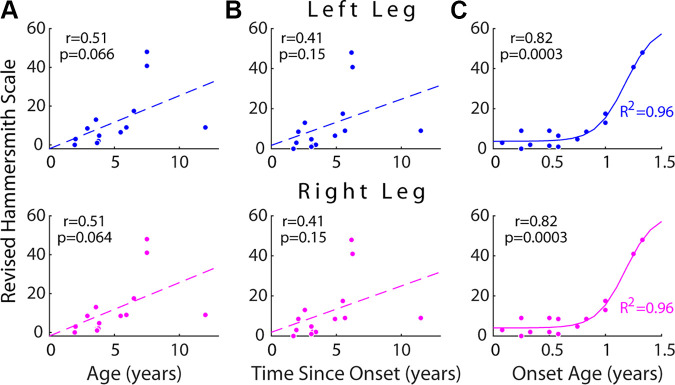
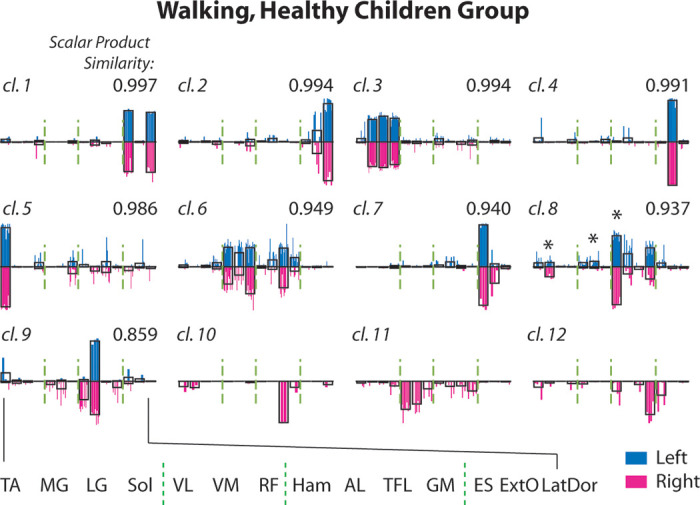
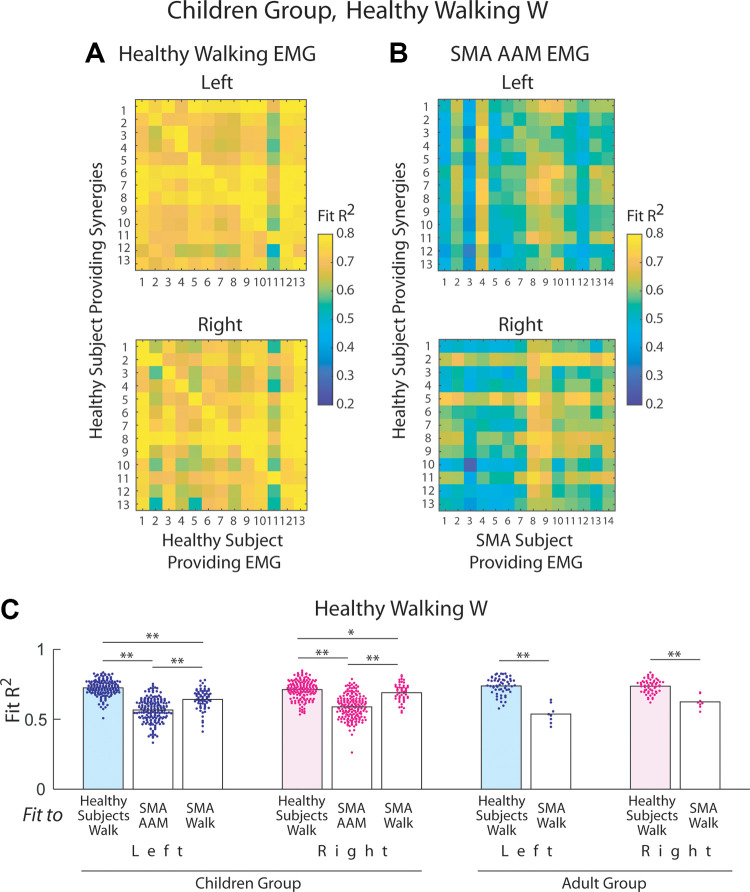
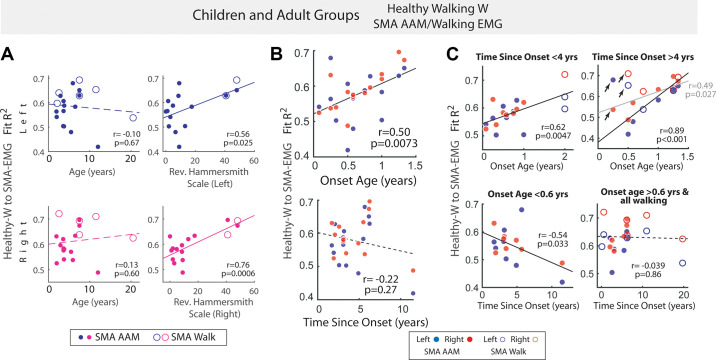
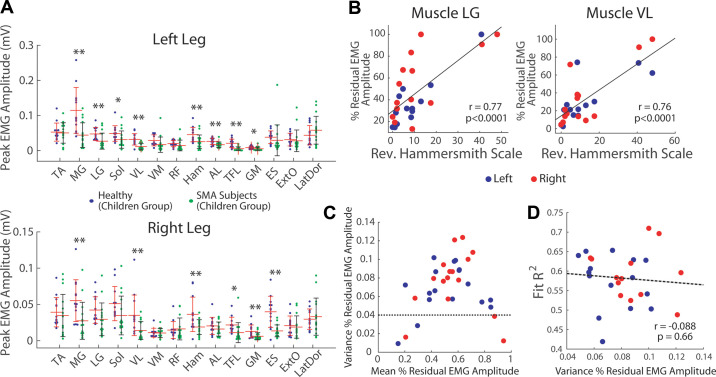
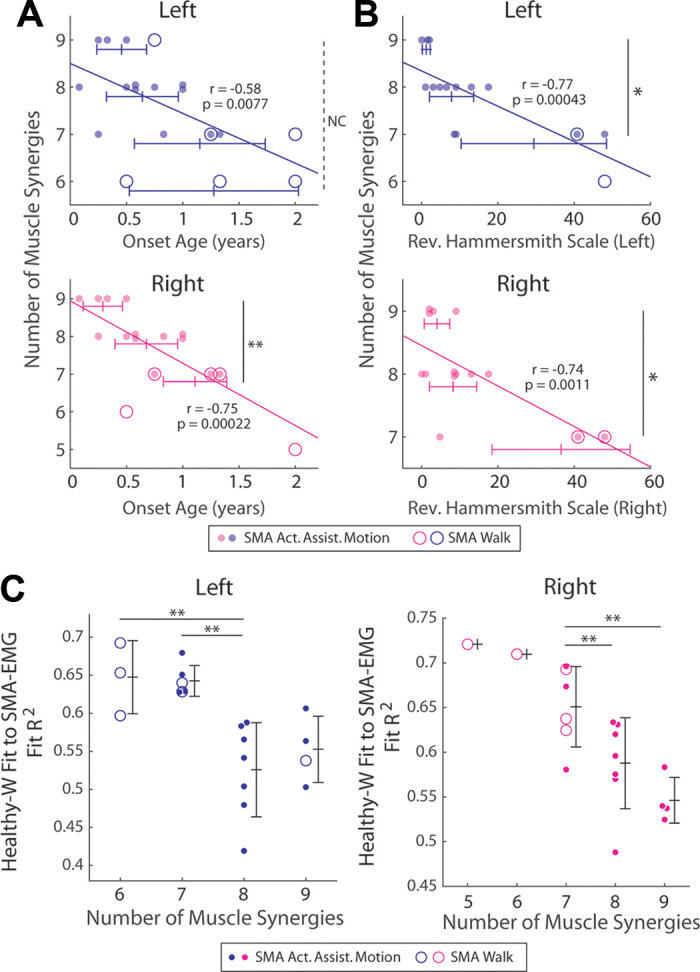
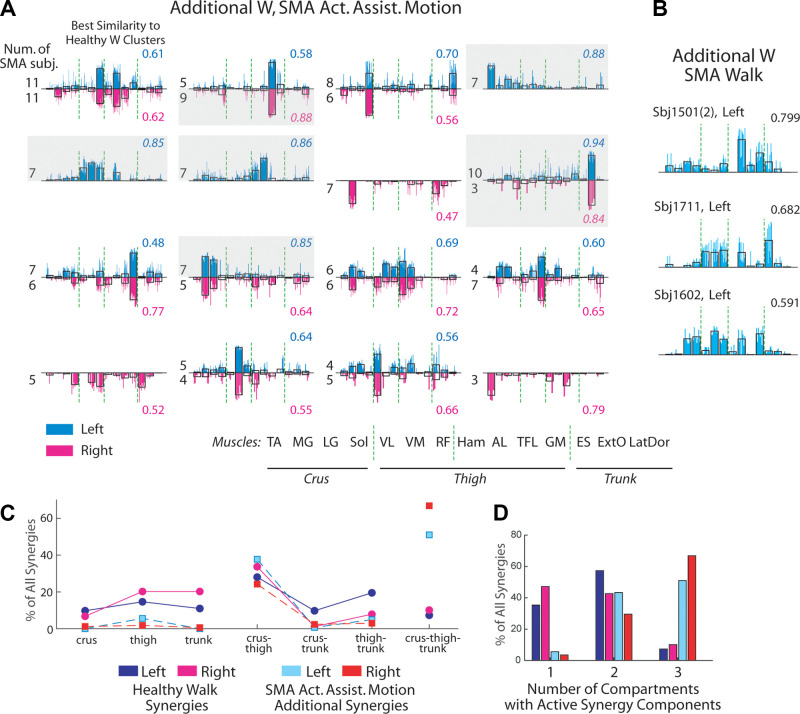
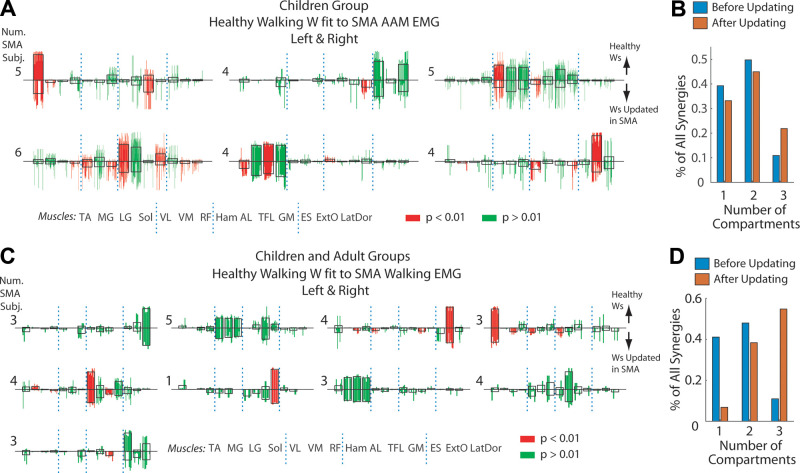
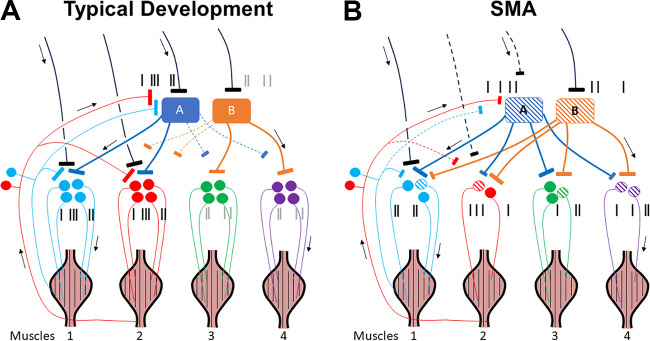
Complex locomotor patterns are generated by combination of muscle synergies. How genetic processes, early sensorimotor experiences, and the developmental dynamics of neuronal circuits contribute to the expression of muscle synergies remains elusive. We shed light on the factors that influence development of muscle synergies by studying subjects with spinal muscular atrophy (SMA, types II/IIIa), a disorder associated with degeneration and deafferentation of motoneurons and possibly motor cortical and cerebellar abnormalities, from which the afflicted would have atypical sensorimotor histories around typical walking onset. Muscle synergies of children with SMA were identified from electromyographic signals recorded during active-assisted leg motions or walking, and compared with those of age-matched controls. We found that the earlier the SMA onset age, the more different the SMA synergies were from the normative. These alterations could not just be explained by the different degrees of uneven motoneuronal losses across muscles. The SMA-specific synergies had activations in muscles from multiple limb compartments, a finding reminiscent of the neonatal synergies of typically developing infants. Overall, while the synergies shared between SMA and control subjects may reflect components of a core modular infrastructure determined early in life, the SMA-specific synergies may be developmentally immature synergies that arise from inadequate activity-dependent interneuronal sculpting due to abnormal sensorimotor experience and other factors. Other mechanisms including SMA-induced intraspinal changes and altered cortical-spinal interactions may also contribute to synergy changes. Our interpretation highlights the roles of the sensory and descending systems to the typical and abnormal development of locomotor modules.NEW & NOTEWORTHY This is likely the first report of locomotor muscle synergies of children with spinal muscular atrophy (SMA), a subject group with atypical developmental sensorimotor experience. We found that the earlier the SMA onset age, the more the subjects' synergies deviated from those of age-matched controls. This result suggests contributions of the sensory/corticospinal activities to the typical expression of locomotor modules, and how their disruptions during a critical period of development may lead to abnormal motor modules.

Keywords: locomotion; motor development; muscle synergy; nonnegative matrix factorization; spinal muscular atrophy.


Conflict of interest statement

No conflicts of interest, financial or otherwise, are declared by the authors.

Figures

None
Graphical abstract
Figure 1.
Figure 1.
Concepts invoked in this study. A: a schematic illustrating the definition of muscle synergy. Each synergy (red or green bars) is a time-invariant activation balance profile across the set of recorded muscles (M1 to M6), and is activated, through multiplication, by a time-varying coefficient (C1(t) and C2(t)). The variability of the preprocessed electromyographic data (EMGs) is then explained by the linear summation of the waveforms contributed by the different synergies. Both the synergies and their coefficients can be extracted from EMG using the nonnegative matrix factorization algorithm (NMF). B: a snapshot showing the performance of active-assisted motion (AAM) in a subject with spinal muscular atrophy (SMA). Many of our subjects with SMA did not possess the ability to walk independently; for them we could at best record EMGs during cycling-like AAM, performed with the subject lying supine and with assistance from a physical therapist. C: an example of raw surface EMGs of 14 leg and trunk muscles recorded from a subject with SMA during AAM. TA, tibialis anterior; MG, medial gastrocnemius; LG, lateral gastrocnemius; Sol, soleus; VL, vastus lateralis; VM, vastus medialis; RF, rectus femoris; Ham, hamstrings; AL, adductor longus; TFL, tensor fascia latae; GM, gluteus maximus; ES, erector spinae at L2; ExtO, external oblique; LatDor, latissimus dorsi.
Figure 2.
Figure 2.
Demographics and motor functional statuses of the enrolled subjects with spinal muscular atrophy (SMA). The residual motor abilities of the subjects with SMA (n = 14) were evaluated by the Revised Hammersmith Scale (RHS) (63), with 1 test item scored separately for the left and right sides. The left- and right-side RHS were regressed against the subjects’ age (A), the time elapsed since disease onset (B), and the age of SMA onset (C). The RHS correlated significantly with the onset age (P < 0.001), but not with age nor time since onset (P > 0.05). For both sides, the RHS-onset age relationship could also be well described by a sigmoidal function: left, RHS = [58.0/(1 + exp−7.7(Onset Age – 1.2))] + 3.7 (R2 = 0.963); right, RHS = [57.2/(1 + exp−7.9(Onset Age – 1.2))] + 4.0 (R2 = 0.959). The Pearson’s r values and their associated P values (t test) of all regressions are shown in the figure. Sigmoidal fitting was performed using Matlab (Curve Fitting Toolbox, Trust-Region algorithm, robust option off).
Figure 3.
Figure 3.
Muscle synergies of the age-matched healthy subjects. As baseline of comparison for assessing the spinal muscular atrophy (SMA) muscle synergies, normative synergies were extracted from electromyographic data (EMGs) recorded from healthy subjects (Children group, n = 13) during overground walking. Muscle synergies for the left (n = 82) and right (n = 89) sides were k-means clustered separately, and the left-side clusters were matched to the right-side clusters by scalar product between cluster centroids (value shown at each panel’s top right). The individual muscle synergies in each cluster (cl. 1 to 12) are shown as colored bars (left, blue; right, magenta) overlaid onto the bars that represent the centroids (uncolored). The left- and right-side normative synergies were highly similar to each other. In all matched clusters, the left and right muscle components were not statistically different (P > 0.01, t test or Mann–Whitney) except medial gastrocnemius (MG) (P = 0.0046, t test), vastus medialis (VM) (P = 0.0080), and hamstrings (Ham) (P = 0.0085) in cl. 8 (*). TA, tibialis anterior; LG, lateral gastrocnemius; Sol, soleus; VL, vastus lateralis; RF, rectus femoris; AL, adductor longus; TFL, tensor fascia latae; GM, gluteus maximus; ES, erector spinae at L2; ExtO, external oblique; LatDor, latissimus dorsi.
Figure 4.
Figure 4.
Control muscle synergies could not well-describe electromyographic data (EMGs) from subjects with spinal muscular atrophy (SMA). A: to generate a baseline for assessing the significance of our fits of the control synergies to the SMA EMGs, we fit the synergies of every control subject to the EMG of every other control, so that the resulting R2s would indicate the synergies’ generalization degree among the controls. The baseline R2s from the healthy Children group are shown here as heatmaps; each column denotes the R2s of fit for the EMG of a single subject. The R2s along the diagonal were not used in subsequent comparisons. B: the walking muscle synergies of the healthy children in A were fit to the EMGs of every subject with SMA with data collected during active-assisted motion (AAM, n = 14). The heat maps show the R2s from these fits using a color scale identical to that for A. The R2s from these control-to-SMA fits were clearly lower than the baseline R2s in A (P < 10−4, t test), thus suggesting that the muscle synergy sets underlying the SMA EMGs are different from those in the controls. C: comparison of the baseline R2s from fits among the control subjects (blue, left side; pink, right side; mean) with R2s from fitting the control muscle synergies to the SMA EMGs from AAM or walking. In all fits, the synergies and EMGs were age group- and side-matched. For both AAM and walking in both age groups, the control-to-control R2s were higher than the control-to-SMA R2s (**significant by multiple comparison after ANOVA with P < 10−4; *P = 0.039, t test).
Figure 5.
Figure 5.
Control muscle synergies could not well-describe electromyographic data (EMGs) from early-onset spinal muscular atrophy (SMA) subjects. For every subject with (SMA), similarity of the EMGs’ structure to the normative walking muscle synergies was evaluated by fitting the walking synergies of age-matched healthy controls to the SMA EMGs from active-assisted motion (AAM) or walking, with the quality of fit quantified by R2s, and the R2s across the fits from the synergies of the control subjects averaged. A: the R2 of fit correlated positively and significantly with Revised Hammersmith Scale (RHS) but not with age (blue, left side; magenta, right side). B: the R2 of fit (AAM, both sides) correlated positively and significantly with SMA onset age (top) but not with time elapsed since SMA onset (bottom). C: the R2 of fit (AAM and walking, both sides) correlated positively and significantly with the SMA onset age in both subgroups of subjects with SMA recorded closer to (time since onset <4 years, top left) or further away from (>4 yr, top right) symptom onset. In the top right, if data from two outlier subjects (arrows) were excluded from regression, the correlation became even more robust (r = 0.89, P < 0.001; black line). Thus, the earlier the SMA onset age and the lower the residual motor function, the more the muscle synergies deviate from the normative. The R2 of fit also tended to decrease with more time elapsed since disease onset, but only in the subgroup with earlier onset age (bottom left). In the regressions with time since onset, all walking data were included in the subgroup with later onset age (bottom right) since ambulatory SMA subjects are generally those with later disease onset. All regressions in all panels were performed on data from both AAM (filled circle) and/or walking (unfilled circle) shown in the graphs. The Pearson’s r and its P value are shown on each graph. Dotted line, P > 0.05; solid line, P < 0.05 (t test).
Figure 6.
Figure 6.
Potential roles of uneven motoneuronal losses across muscles on abnormal spinal muscular atrophy (SMA) synergies. A: the peak absolute electromyographic (EMG) amplitude of every muscle in every healthy (purple dot) and SMA limb (green) was estimated by finding the 99th percentile of the preprocessed, nonnormalized EMG. For many muscles of both the left (top) and right legs (bottom), the healthy-limb average (means ± SD) was significantly higher than the SMA-limb average (**P < 0.01; *P < 0.05; 1-tail t test), suggesting that in each SMA limb, a muscle’s peak EMG amplitude relative to the muscle’s average in healthy limbs could be a proxy for the muscle’s residual motoneuronal number and functions. B: correlations between the residual EMG amplitude (relative to the healthy average, in %) and the Revised Hammersmith Scale (RHS) motor functional scale across the left (blue) and right legs (red) of the SMA subjects, in muscles lateral gastrocnemius (LG) (left, P < 10−4) and vastus lateralis (VL) (right, P < 10−4), respectively. Significant, positive correlations (P < 0.05, t test for Pearson’s r) were observed in all muscles except adductor longus (AL), tensor fascia latae (TFL), erector spinae at L2 (ES), external oblique (ExtO), and latissimus dorsi (LatDor), suggesting that the residual EMG amplitude is a reasonable proxy for residual motoneuronal number and functions. C: the degree of uneven motoneuronal losses of every SMA limb was quantified by the across-muscle variance of the % residual EMG amplitude. A plot of this variance (y-axis) against the across-muscle mean of the residual EMG amplitude (x-axis) shows that limbs with very low variances had either very high or very low means, presumably reflecting motoneuronal loss at the beginning and end of the degeneration process, respectively. SMA limbs with variances <0.04 (dotted line) were excluded from subsequent analysis. D: the across-muscle variance of residual EMG amplitude did not correlate significantly with the R2 from the healthy-to-SMA synergy fits (P = 0.66). Thus, the uneven pattern of motoneuronal loss across muscles is likely not the sole factor that accounts for the abnormal SMA synergies. Sol, soleus; RF, rectus femoris; Ham, hamstrings; GM, gluteus maximus.
Figure 7.
Figure 7.
Muscle synergy sets from early-onset spinal muscular atrophy (SMA) subjects had higher dimensionality. A and B: the numbers of muscle synergies (dimensionality) of the electromyographic data (EMGs) of both behaviors of the SMA limbs were regressed against the SMA onset age (A) or RHS (B). In both regressions, a negative, significant correlation (P < 0.01, t test) was observed in both sides. Thus, the earlier the SMA onset and the lower the residual motor function, the higher the dimensionality of the EMG. All regressions were performed on data from both active-assisted motion (AAM) (filled circle) and walking (unfilled circle) presented in each graph. The Pearson’s r and its P value are shown on each graph. Across the numbers of synergies, the onset age or Revised Hammersmith Scale (RHS) (means ± SD) were also compared by multiple comparison after Kruskal–Wallis (onset age: left, P = 0.098; right, P = 0.0063; RHS: left, P = 0.017; right, P = 0.042). Significantly different pairs are indicated by the end of vertical lines (**P < 0.01; *P < 0.05; NC, P > 0.05). C: the control-to-SMA fit R2s of the SMA limbs (means ± SD) are plotted against the limbs’ dimensionality. On both sides, the higher the dimensionality, the lower the R2 of fit. These results, together with those in A and B, suggest that additional muscle synergies specific to the SMA limbs contribute to the control-SMA synergy differences in early-onset, severely impaired SMA subjects. Left, Kruskal–Wallis across all numbers of synergies, P = 0.0034; right, ANOVA across numbers 7 to 9, P = 0.0073. **significantly different pairs indicated by post hoc multiple comparison.
Figure 8.
Figure 8.
The additional spinal muscular atrophy (SMA)-specific muscle synergies had active muscle components in multiple limb segments. A: for every SMA limb, the number of additional synergies needed to describe the active-assisted motion (AAM) electromyography (EMG) at baseline level (Nadd*) was determined (Table 2). All SMA-specific additional synergies for limbs with Nadd* > 0 from all control-to-SMA fits were collected and k-means clustered (left-limb synergies, blue bars, n = 286; right-limb, magenta bars, n = 169). The clusters of the two sides were paired up by best-matching scalar product (SP) between cluster centroids (>0.8) (uncolored bars) and each matched pair are shown in the same graph. The centroid of every cluster was also compared with the side-matched control synergy cluster centroids (Fig. 3) (SP shown on the graph’s right) and those with SP > 0.8 (gray shaded clusters) are excluded from further analysis. The number of SMA subjects carrying an AAM synergy from each cluster is shown on the graph’s left. Note that many non-gray-shaded clusters have activation components spanning muscles in multiple limb or body segments (crus, thigh, and trunk). B: the SMA-specific additional synergies for walking for the three limbs with Nadd* > 0 (Table 3) from all control-to-SMA fits (n = 34), shown individually for each limb. The number at top right corner indicates best-matching SP between the synergies’ mean (uncolored bars) and age- and side-matched control synergy centroids. C: the percentages of muscle synergies with activation components in muscles of any one, any two, or all three of the limb/body segments (crus, thigh, trunk), respectively, for the additional SMA-specific synergies for AAM (left, cyan; right, red; dotted line) and healthy control synergies for walking (Children group; left, blue; right, magenta; solid line). Components were defined as active if the component magnitude, after l2 normalization of the muscle synergy vector, is >0.1. The percentages of SMA-specific synergies with components in three segments are clearly higher than those of control synergies. D: same data as C, except that the total percentage for each number of limb/body segments (1 to 3) with active synergy components is presented.
Figure 9.
Figure 9.
Synergies modified in subjects with spinal muscular atrophy (SMA) had active muscle components in multiple limb segments. A: for every SMA limb, in addition to Nadd* (Fig. 8), the number of original control synergies updated during the fit to describe the active-assisted motion (AAM) electromyographic data (EMGs) at baseline level (Nup*) was determined (Table 2). All pre- and postupdate synergies from all control-to-SMA fits of all limbs with Nup* > 0 (n = 247, left and right sides combined) were collected, and the preupdate synergies were categorized by k-means into six clusters. In each cluster, muscle components of the l2-normalized preupdate synergies (from healthy subjects; upward bars) and postupdate synergies (updated for SMA EMG; downward bars) were then compared muscle by muscle with the t test or Mann–Whitney test (red, P < 0.01; green, P > 0.01). Like the SMA-specific additional synergies, the postupdate synergies tended to have activations in muscles spanning more limb/body segments. The number of SMA subjects carrying a synergy in each cluster is shown on the graph’s left. B: the percentages of muscle synergies with active muscles in 1 to 3 limb/body segments (crus, thigh, trunk), before (blue) and after (red) updating, for the muscle synergies in A. Definition of active muscle components is the same as that stated for Fig. 8C. Note that the percentage of three-segment synergies after updating doubles that before updating. C: similar to A, but for the SMA limbs with walking EMGs collected (Table 3). The synergies from all SMA limbs (left or right sides) in both age groups with Nup* > 0 (n = 73) were combined for this analysis. As in A, the postupdate synergies tended to have activations in muscles spanning more limb/body segments. D: the percentages of muscle synergies with active muscles in 1 to 3 limb/body segments before (blue) and after (red) updating, for the muscle synergies in C. Note the fivefold increase in the percentage of three-segment synergies after updating.
Figure 10.
Figure 10.
One hypothetical mechanism of muscle synergy fractionation in typically developing children and children with spinal muscular atrophy (SMA). A: during normal development, the spinal interneurons (A in blue, B in orange) that encode the precursor muscle synergy (coactivating muscles 1 to 4) compete for synaptic spaces on the motoneuronal pools of the same muscles (neurons in cyan, red, green, and purple, for muscles 1 to 4, respectively) in an activity-dependent manner. During early exploratory or voluntary movement, any interneuron (e.g., A) and the motoneurons of a subset of muscles within the precursor (e.g., muscles 1 and 2) are synchronized (black spikes) through reinforcements from proprioceptive (cyan and red lines from muscles 1 and 2, respectively) and descending inputs (solid black lines) to the motoneurons and interneurons as the same subset of muscles are coactivated. Such synchronizations strengthen the interneuron’s connections to the reinforced motoneurons, allowing these axons to outcompete the innervations to the same muscles from another interneuron (dotted orange line denoting retracting axons from B). The interneuron’s connections to the other unreinforced muscles in turn are outcompeted by other synchronizations (gray spikes). This way, the original precursor synergy is fractionated into two new synergies (muscles 1 and 2 from A, 3 and 4 from B). Arrows indicate the direction of information flow. B: after SMA onset, the combined effects of motoneuronal degeneration, motoneuronal, and interneuronal dysfunction (neurons with diagonal stripes), and losses of proprioceptive and descending inputs (dotted line) lead to reduced and deranged exploratory and voluntary movement while disrupting any activity synchronizations seen in normal children. The lack of activity-dependent competitions between interneurons results in failed or incomplete fractionation of the precursor muscle synergy.

Similar articles

Cited by

References

    1. Kiehn O. Decoding the organization of spinal circuits that control locomotion. Nat Rev Neurosci 17: 224–238, 2016. doi:10.1038/nrn.2016.9. - DOI - PMC - PubMed
    1. Saltiel P, Wyler-Duda K, D'Avella A, Tresch MC, Bizzi E. Muscle synergies encoded within the spinal cord: evidence from focal intraspinal NMDA iontophoresis in the frog. J Neurophysiol 85: 605–619, 2001. doi:10.1152/jn.2001.85.2.605. - DOI - PubMed
    1. Ivanenko YP, Poppele RE, Lacquaniti F. Five basic muscle activation patterns account for muscle activity during human locomotion. J Physiol 556: 267–282, 2004. doi:10.1113/jphysiol.2003.057174. - DOI - PMC - PubMed
    1. d'Avella A, Bizzi E. Shared and specific muscle synergies in natural motor behaviors. Proc Natl Acad Sci USA 102: 3076–3081, 2005. doi:10.1073/pnas.0500199102. - DOI - PMC - PubMed
    1. Cappellini G, Ivanenko YP, Poppele RE, Lacquaniti F. Motor patterns in human walking and running. J Neurophysiol 95: 3426–3437, 2006. doi:10.1152/jn.00081.2006. - DOI - PubMed

Publication types

LinkOut - more resources