Diversification of gene content in the Mycobacterium tuberculosis complex is determined by phylogenetic and ecological signatures
- PMID: 38230932
- PMCID: PMC10871547
- DOI: 10.1128/spectrum.02289-23
Diversification of gene content in the Mycobacterium tuberculosis complex is determined by phylogenetic and ecological signatures
Abstract
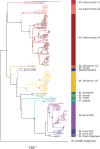
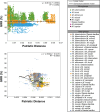
We analyzed the pan-genome and gene content modulation of the most diverse genome data set of the Mycobacterium tuberculosis complex (MTBC) gathered to date. The closed pan-genome of the MTBC was characterized by reduced accessory and strain-specific genomes, compatible with its clonal nature. However, significantly fewer gene families were shared between MTBC genomes as their phylogenetic distance increased. This effect was only observed in inter-species comparisons, not within-species, which suggests that species-specific ecological characteristics are associated with changes in gene content. Gene loss, resulting from genomic deletions and pseudogenization, was found to drive the variation in gene content. This gene erosion differed among MTBC species and lineages, even within M. tuberculosis, where L2 showed more gene loss than L4. We also show that phylogenetic proximity is not always a good proxy for gene content relatedness in the MTBC, as the gene repertoire of Mycobacterium africanum L6 deviated from its expected phylogenetic niche conservatism. Gene disruptions of virulence factors, represented by pseudogene annotations, are mostly not conserved, being poor predictors of MTBC ecotypes. Each MTBC ecotype carries its own accessory genome, likely influenced by distinct selective pressures such as host and geography. It is important to investigate how gene loss confer new adaptive traits to MTBC strains; the detected heterogeneous gene loss poses a significant challenge in elucidating genetic factors responsible for the diverse phenotypes observed in the MTBC. By detailing specific gene losses, our study serves as a resource for researchers studying the MTBC phenotypes and their immune evasion strategies.IMPORTANCEIn this study, we analyzed the gene content of different ecotypes of the Mycobacterium tuberculosis complex (MTBC), the pathogens of tuberculosis. We found that changes in their gene content are associated with their ecological features, such as host preference. Gene loss was identified as the primary driver of these changes, which can vary even among different strains of the same ecotype. Our study also revealed that the gene content relatedness of these bacteria does not always mirror their evolutionary relationships. In addition, some genes of virulence can be variably lost among strains of the same MTBC ecotype, likely helping them to evade the immune system. Overall, our study highlights the importance of understanding how gene loss can lead to new adaptations in these bacteria and how different selective pressures may influence their genetic makeup.
Keywords: Mycobacterium africanum; Mycobacterium bovis; Mycobacterium tuberculosis; evolution; genomics; pan-genome.
Conflict of interest statement
The authors declare no conflict of interest.
Figures


Similar articles
-
The Bioinformatics Analysis of Comparative Genomics of Mycobacterium tuberculosis Complex (MTBC) Provides Insight into Dissimilarities between Intraspecific Groups Differing in Host Association, Virulence, and Epitope Diversity.Front Cell Infect Microbiol. 2017 Mar 21;7:88. doi: 10.3389/fcimb.2017.00088. eCollection 2017. Front Cell Infect Microbiol. 2017. PMID: 28377903 Free PMC article.
-
A Comprehensive Map of Mycobacterium tuberculosis Complex Regions of Difference.mSphere. 2021 Aug 25;6(4):e0053521. doi: 10.1128/mSphere.00535-21. Epub 2021 Jul 21. mSphere. 2021. PMID: 34287002 Free PMC article.
-
Phylogenomics of Mycobacterium africanum reveals a new lineage and a complex evolutionary history.Microb Genom. 2021 Feb;7(2):000477. doi: 10.1099/mgen.0.000477. Microb Genom. 2021. PMID: 33555243 Free PMC article.
-
The Nature and Evolution of Genomic Diversity in the Mycobacterium tuberculosis Complex.Adv Exp Med Biol. 2017;1019:1-26. doi: 10.1007/978-3-319-64371-7_1. Adv Exp Med Biol. 2017. PMID: 29116627 Review.
-
Biological and Epidemiological Consequences of MTBC Diversity.Adv Exp Med Biol. 2017;1019:95-116. doi: 10.1007/978-3-319-64371-7_5. Adv Exp Med Biol. 2017. PMID: 29116631 Review.
Cited by
-
Mycobacterium tuberculosis biology, pathogenicity and interaction with the host.Nat Rev Microbiol. 2025 Jun 30. doi: 10.1038/s41579-025-01201-x. Online ahead of print. Nat Rev Microbiol. 2025. PMID: 40588584 Review.
-
Genomic insights into five selected multidrug-resistant Pseudomonas aeruginosa isolated from Sodwana Bay, South Africa.Front Microbiol. 2025 Jul 2;16:1578578. doi: 10.3389/fmicb.2025.1578578. eCollection 2025. Front Microbiol. 2025. PMID: 40673149 Free PMC article.
-
Interred mechanisms of resistance and host immune evasion revealed through network-connectivity analysis of M. tuberculosis complex graph pangenome.mSystems. 2025 Apr 22;10(4):e0049924. doi: 10.1128/msystems.00499-24. Epub 2025 Mar 6. mSystems. 2025. PMID: 40261029 Free PMC article.
-
Insight into blood proteinase-inhibitor system and pathogenesis of renal tuberculosis induced by phylogenomically different Mycobacterium tuberculosis strains in rabbit model.BMC Nephrol. 2025 Aug 20;26(1):473. doi: 10.1186/s12882-025-04411-w. BMC Nephrol. 2025. PMID: 40836283 Free PMC article.
-
Pitfalls of bacterial pan-genome analysis approaches: a case study of Mycobacterium tuberculosis and two less clonal bacterial species.Bioinformatics. 2025 May 6;41(5):btaf219. doi: 10.1093/bioinformatics/btaf219. Bioinformatics. 2025. PMID: 40341387 Free PMC article.
References
-
- WHO. 2018. Global tuberculosis report 2018.
-
- Azami HY, Zinsstag J. 2018. Economics of bovine tuberculosis: a one health issue, p 31–42. In Chambers M, Gordon S, Olea-Popelka F, Barrow P (ed), Bovine tuberculosis.
-
- Brites D, Loiseau C, Menardo F, Borrell S, Boniotti MB, Warren R, Dippenaar A, Parsons SDC, Beisel C, Behr MA, Fyfe JA, Coscolla M, Gagneux S. 2018. A new phylogenetic framework for the animal-adapted Mycobacterium tuberculosis complex. Front Microbiol 9:2820. doi:10.3389/fmicb.2018.02820 - DOI - PMC - PubMed
MeSH terms
Substances
Grants and funding
- D17ZO-307/Morris Animal Foundation (MAF)
- 2016/26108-0, 2019/20786-5/Fundação de Amparo à Pesquisa do Estado de São Paulo (FAPESP)
- 88887.508739/2020-00, 001/Coordenação de Aperfeiçoamento de Pessoal de Nível Superior (CAPES)
- 140003/2019-3/Conselho Nacional de Desenvolvimento Científico e Tecnológico (CNPq)
LinkOut - more resources
Full Text Sources
Medical
Molecular Biology Databases

