. 2024 Jan 31;146(4):2524-2548.
doi: 10.1021/jacs.3c10741. Epub 2024 Jan 17.

Biomimetic Synthesis and Chemical Proteomics Reveal the Mechanism of Action and Functional Targets of Phloroglucinol Meroterpenoids

Affiliations

Biomimetic Synthesis and Chemical Proteomics Reveal the Mechanism of Action and Functional Targets of Phloroglucinol Meroterpenoids

Amy K Bracken et al. J Am Chem Soc. .

Abstract

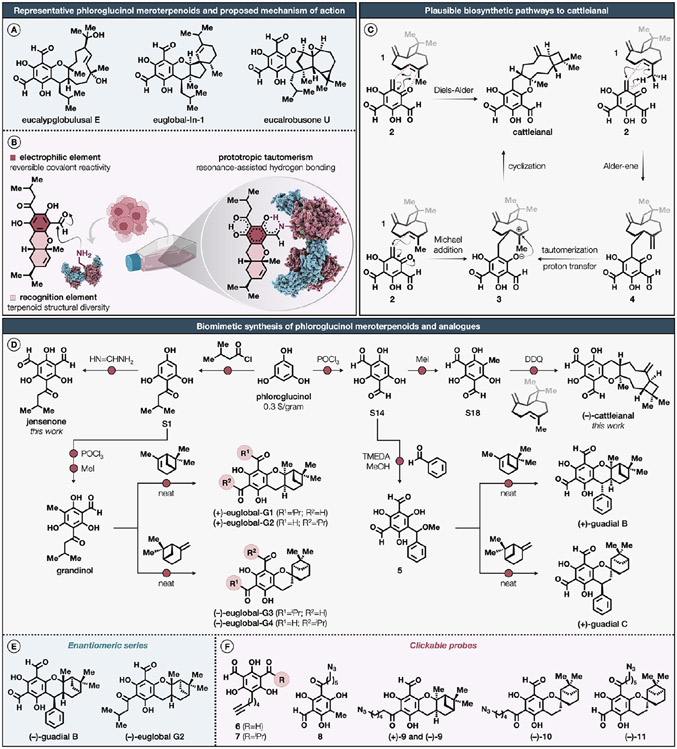
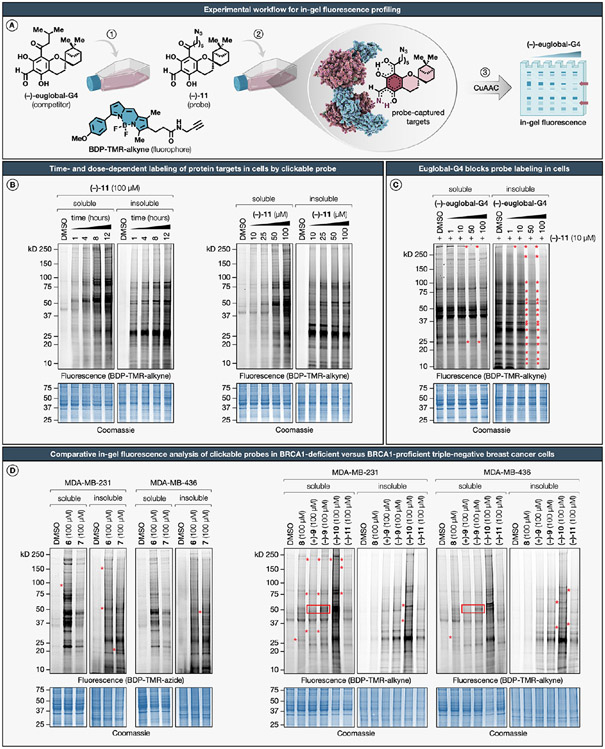
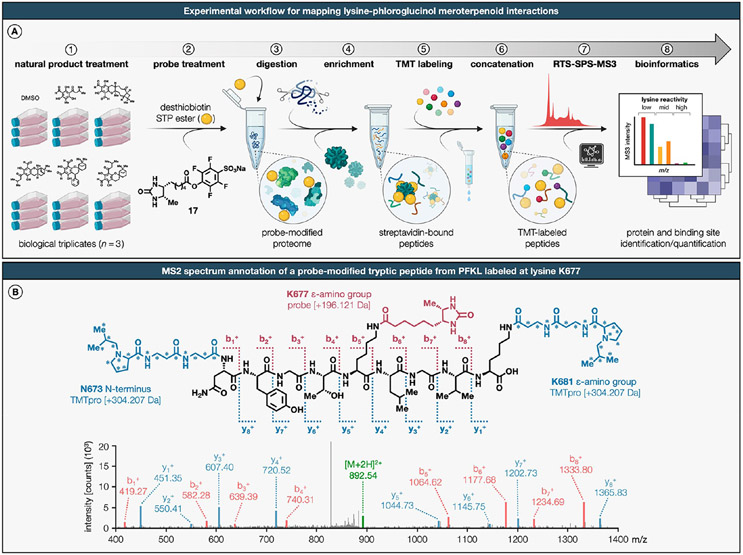
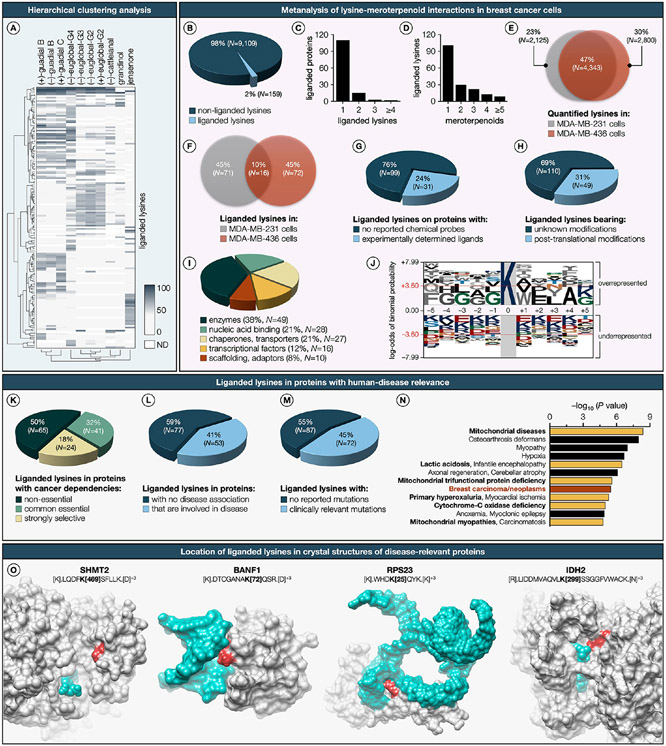
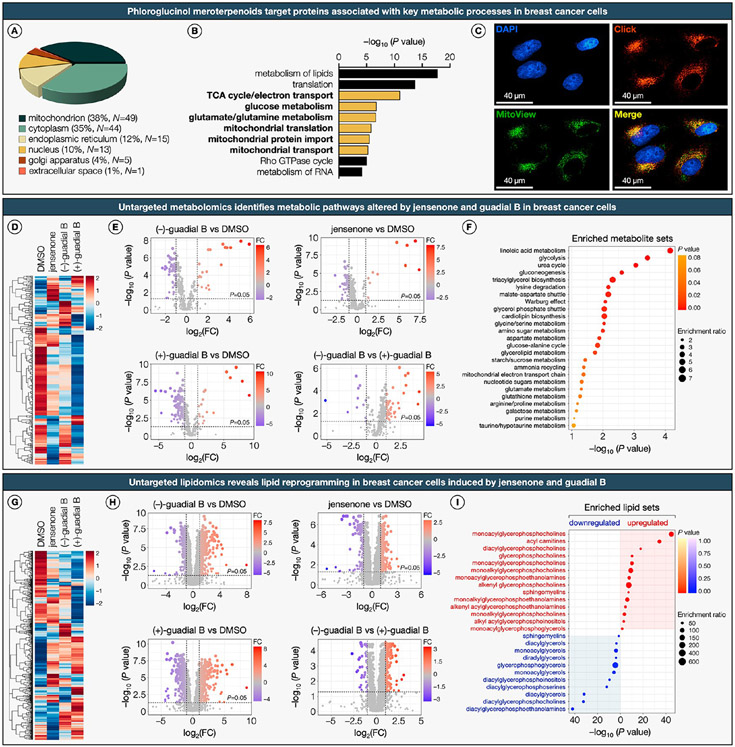
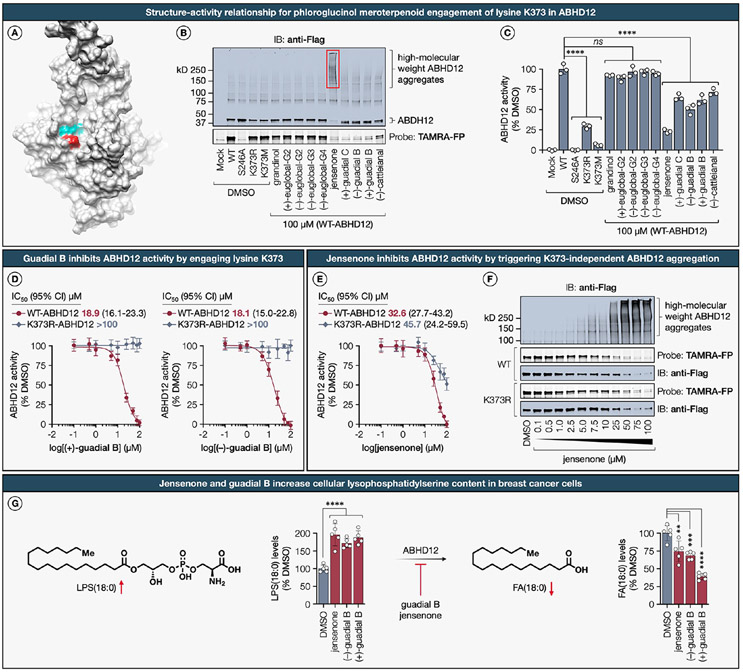
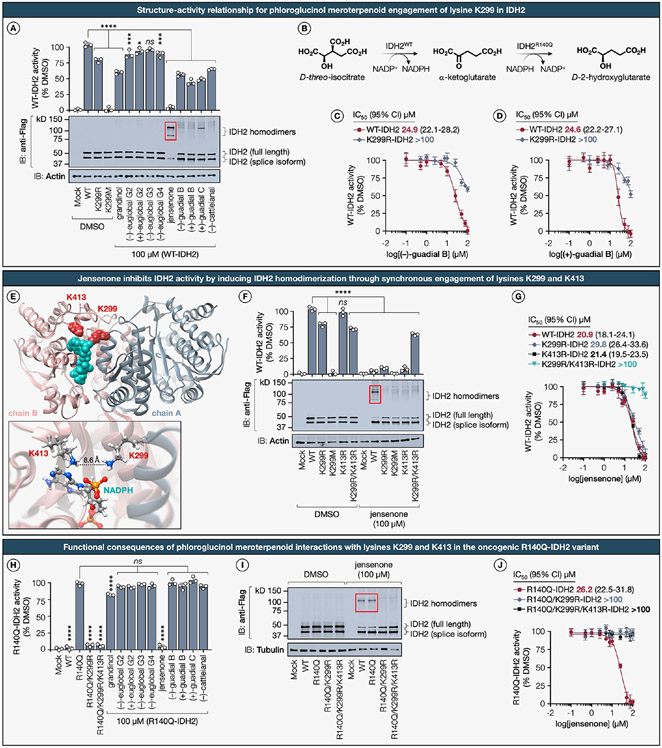
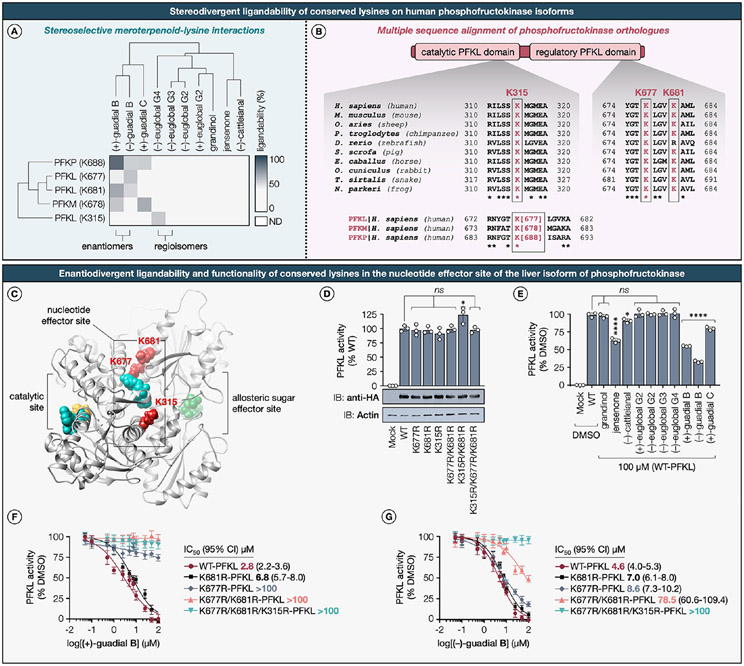
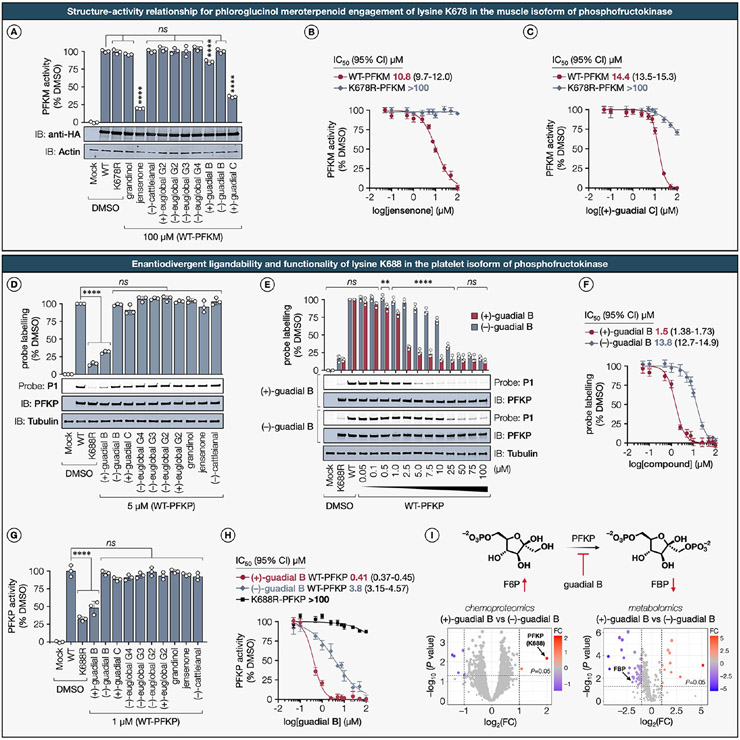
Natural products perennially serve as prolific sources of drug leads and chemical probes, fueling the development of numerous therapeutics. Despite their scarcity, natural products that modulate protein function through covalent interactions with lysine residues hold immense potential to unlock new therapeutic interventions and advance our understanding of the biological processes governed by these modifications. Phloroglucinol meroterpenoids constitute one of the most expansive classes of natural products, displaying a plethora of biological activities. However, their mechanism of action and cellular targets have, until now, remained elusive. In this study, we detail the concise biomimetic synthesis, computational mechanistic insights, physicochemical attributes, kinetic parameters, molecular mechanism of action, and functional cellular targets of several phloroglucinol meroterpenoids. We harness synthetic clickable analogues of natural products to probe their disparate proteome-wide reactivity and subcellular localization through in-gel fluorescence scanning and cell imaging. By implementing sample multiplexing and a redesigned lysine-targeting probe, we streamline a quantitative activity-based protein profiling, enabling the direct mapping of global reactivity and ligandability of proteinaceous lysines in human cells. Leveraging this framework, we identify numerous lysine-meroterpenoid interactions in breast cancer cells at tractable protein sites across diverse structural and functional classes, including those historically deemed undruggable. We validate that phloroglucinol meroterpenoids perturb biochemical functions through stereoselective and site-specific modification of lysines in proteins vital for breast cancer metabolism, including lipid signaling, mitochondrial respiration, and glycolysis. These findings underscore the broad potential of phloroglucinol meroterpenoids for targeting functional lysines in the human proteome.


Figures

Figure 1.
Figure 1.. Proposed mechanism of action and biomimetic synthesis of representative phloroglucinol meroterpenoids and analogues.
(A) Representative phloroglucinol meroterpenoids isolated from Eucalyptus globulus and Eucalyptus robusta. (B) Proposed reversible covalent reactivity of phloroglucinol meroterpenoids with proteinaceous lysines. (C) Plausible biosynthetic pathways to cattleianal, involving either an inverse electron-demand hetero-Diels–Alder, Michael addition/cyclization, or Alder-ene/cyclization sequence. (D) Biomimetic synthesis of cattleianal, euglobals G1–4, guadials B and C, grandinol, and jensenone. (E, F) Corresponding enantiomeric and clickable analogues as probes for in-gel fluorescence scanning, molecular imaging, and chemical proteomics. For a detailed description of reagents and reaction conditions, including stereochemical assignments by two-dimensional NMR, see the Supporting Information.
Figure 2.
Figure 2.. In-gel fluorescence profiling of clickable phloroglucinol meroterpenoid probes in breast cancer cells.
(A) Experimental workflow for detecting probe–protein interactions in cells by SDS-PAGE coupled with in-gel fluorescence scanning. (B) Time- and dose-dependent labeling by the clickable azide probe (−)-11. MDA-MB-231 cells were treated with (−)-11 for the indicated times or concentrations, harvested, lysed, and separated into soluble and insoluble fractions. Following CuAAC conjugation to BDP-TMR-alkyne (1 h, 20 °C), samples were resolved by SDS-PAGE and analyzed by in-gel fluorescence scanning. (C) Excess (−)-euglobal-G4 blocks probe (−)-11 labeling of several proteins in MDA-MB-231 cells (marked with red stars). (D) Comparative analysis of clickable phloroglucinol meroterpenoid probes shows differential protein targets across cell lines (marked with red stars) and enantiodivergent labeling within cell lines (marked by red boxes) in BRCA1-proficient and BRCA1-deficient triple-negative breast cancer cells. SDS-PAGE data shown are representative of three independent biological experiments (n = 3). For a detailed description of in-gel fluorescence studies, including compound treatment and CuAAC conjugation protocols, see the Supporting Information.
Figure 3.
Figure 3.. Multiplexed mass spectrometry-based quantification for expedited discovery of lysine–natural product interactions in cells.
(A) Schematic of TMTpro-18plex-based workflow for mapping lysine–phloroglucinol meroterpenoid interactions in breast cancer cells. (B) MS/MS spectrum annotation of a desthiobiotin probe-modified tryptic peptide from PKFL. Covalent modification with desthiobiotin STP ester probe results in addition of +196.121 Da to the ε-amino groups of lysines (K677 from PFKL shown as a representative example). The TMTpro-18plex reagents are amine-reactive and modify the ε-amino groups of lysines and peptide N-termini by addition of +304.207 Da. Data shown are representative of three experiments (n = 3 biologically independent experiments). For a detailed description of the TMTpro-18plex-based protocol, see the Supporting Information.
Figure 4.
Figure 4.. Global map of phloroglucinol meroterpenoid–lysine interactions in the human proteome.
(A) Hierarchical clustering heatmap (Euclidean distance, complete-linkage method) of the liganded lysines and phloroglucinol meroterpenoids. Each row represents a liganded lysine and each column represents a phloroglucinol meroterpenoid. Dendrogram for liganded lysines is shown on the left side of the heatmap, and dendrogram for phloroglucinol meroterpenoids is shown below the heatmap. Dark blue to light gray color gradient denotes higher to lower ligandability (also see Supplementary Dataset). (B) Fraction of total quantified lysines liganded by natural products. (C) Number of liganded lysines per protein. (D) Number of natural product hits per liganded lysine. (E) Overlap of quantified lysines in MDA-MB-231 and MDA-MB-436 cells. (F) Overlap of liganded lysines in MDA-MB-231 and MDA-MB-436 cells. (G) Number of proteins harboring liganded lysines with reported probes. (H) Number of lysines bearing post-translational modifications (also see Extended Data Figure S3). (I) Functional class distribution of proteins with liganded lysines. (J) Sequence logo of the lysine-modified amino acid motif. Sequence logo of the probe lysine-modified amino acid motif depicting over- and underrepresented residues which are scaled to their log10 odds of the binomial probability, as a direct measure of a residue’s likelihood of being statistically significantly over- or underrepresented. The sequence plot was generated with the pLogo (http://plogo.uconn.edu). The horizontal red line indicates the threshold of the Bonferroni corrected p-value of p < 0.05. (K) Proportion of proteins harboring liganded lysines that are defined as Strongly Selective in the Cancer Dependency Map, reflecting a restricted dependency relationship with a subset of the cancer cell line panel, and as Common Essential to indicate their general requirement for the growth of most cancer cell lines. (L) Distribution of liganded lysines in proteins that have human-disease relevance (as assessed by pathogenic mutations that lead to monogenic disorders defined in the OMIM database). (M) Functional consequences of clinically relevant variants of the liganded lysine residues themselves (in cases where these mutations are associated with disease) as classified by ClinVar, gnomAD, and ClinGen databases. (N) Clusters of human diseases identified through DisGeNET term enrichment analysis on liganded proteins. Dark red represents breast carcinoma, and yellow highlights mitochondrial disorders. (O) Location of liganded lysines (dark red) mapped onto the crystal structures (gray) bound to metabolites or nucleic acids (blue). K469 of SHMT2 (PDB: 6QVG) bound to PLP; K72 of BANF1 (PDB: 2BZF) bound to DNA; K25 of RPS23 (PDB: 4CXG) bound to RNA; K299 of IDH2 mutant R172K (PDB: 5SVN) bound to NADPH. ND, not determined.
Figure 5.
Figure 5.. Phloroglucinol meroterpenoids target key metabolic pathways in breast cancer cells.
(A) Subcellular distribution of proteins with liganded lysines. (B) Top-10 enriched clusters of biological processes from GO-term enrichment analysis of proteins harboring liganded lysines. (C) Fluorescence cell imaging of the clickable azide probe (−)-11 visualized by copper-catalyzed azide–alkyne cycloaddition (CuAAC). MDA-MB-231 cells were treated with (−)-11 at 100 μM for 8 h, fixed with 4% formaldehyde, permeabilized, and blocked (0.1% Triton-X, 5% BSA in PBS). Following CuAAC conjugation to BDP-TMR-alkyne (30 min, 20 °C), samples were counterstained with DAPI (nucleus, blue) and MitoView (mitochondria, green). (D) Hierarchical clustering heatmap (Euclidean distance, complete-linkage method) of identified metabolites in MDA-MB-231 cells treated with representative phloroglucinol meroterpenoids (also see Supplementary Dataset and Extended Data Figure S4). Shades of red and blue represent upregulation and downregulation of a metabolite, respectively. (E) Volcano plots depicting statistically significant (false discovery rate-corrected P value <0.05 and fold change >2.0) altered metabolites in MDA-MB-231 cells treated with jensenone and guadial B. P values were determined by Student’s t test (two-tailed, two-sample equal variance). Blue circles represent metabolites selectively downregulated by meroterpenoids, red circles represent metabolites selectively upregulated by meroterpenoids, and gray circles represent metabolites with no significant difference. Data represent average values ± SD, n = 6 per group from six biologically independent experiments. FC, fold change. (F) Top-25 metabolic pathway enrichment of metabolites significantly altered by representative phloroglucinol meroterpenoids. Colors represent the statistical significance (P value) of the enriched pathways, and point size represents the enrichment ratio of matched metabolites and total metabolites in the corresponding pathway. (G) Hierarchical clustering heatmap (Euclidean distance, complete-linkage method) of identified lipid species in MDA-MB-231 cells treated with representative phloroglucinol meroterpenoids (also see Supplementary Dataset and Extended Data Figure S4). Shades of red and blue represent upregulation and downregulation of a lipid, respectively. (H) Volcano plots depicting statistically significant (false discovery rate-corrected P value <0.05 and fold change >2.0) altered lipid species in MDA-MB-231 cells treated with jensenone and guadial B. P values were determined by Student’s t test (two-tailed, two-sample equal variance). Blue circles represent metabolites selectively downregulated by meroterpenoids, red circles represent metabolites selectively upregulated by meroterpenoids, gray circles represent metabolites with no significant difference. Data represent average values ± SD, n = 6 per group from six biologically independent experiments. FC, fold change. (I) Top-25 enriched lipid species significantly upregulated and downregulated by representative phloroglucinol meroterpenoids. Shades of red and blue represent upregulation and downregulation of a lipid, respectively. Point size represents the enrichment ratio of matched lipid species and total lipids in the corresponding pathway.
Figure 6.
Figure 6.. Functional impact and structure–activity relationship for phloroglucinol meroterpenoid engagement of lysine K373 in the lysophosphatidylserine lipase ABHD12.
(A) The location of the liganded lysine K373 (dark red) is mapped onto the AlphaFold structure of the human ABHD12 (gray, AF-Q8N2K0-F1), with the catalytic triad (teal) residues (S246, D333, H372) positioned within the active site. Only the segment spanning residues 86–389 with high per-residue confidence score (pLDDT > 70) are displayed in the analysis. (B) Representative in-gel fluorescence data and immunoblot analysis showing SAR across phloroglucinol meroterpenoids for blockade of probe TAMRA-FP labeling and formation of high-molecular-weight aggregates of recombinantly expressed Flag-tagged WT-ABHD12 in HEK293T cell lysates. (C) SAR for phloroglucinol meroterpenoid inhibition (100 μM, 1 h, 37 °C) of LPS hydrolysis activity measured using recombinantly expressed WT-, S246A-ABHD12, and indicated K373 mutants in HEK293T cell lysates with 17:1 LPS substrate (100 μM, 20 min, 37 °C). Data represent average values ± SD, n = 3 per group from three biologically independent experiments. Statistical significance was calculated using a one-way ANOVA with Dunnett’s post hoc test: ****P < 0.0001. ns, not significant. (D) Fitted IC50 (95% CI) curves for the dose-dependent inhibition of the LPS hydrolysis activity by (+)-guadial B and (−)-guadial B measured using recombinantly expressed WT- and K373R-ABHD12 in HEK293T cell lysates. Data represent average values ± SD, n = 3 per group from three biologically independent experiments. (E) Fitted IC50 (95% CI) curves for the dose-dependent inhibition of the LPS hydrolysis activity by jensenone measured using recombinantly expressed WT- and K373R-ABHD12 in HEK293T cell lysates. Data represent average values ± SD, n = 3 per group from three biologically independent experiments. (F) Representative in-gel fluorescence data and Western blot analysis showing dose-dependent formation of high-molecular-weight aggregates and blockade of probe TAMRA-FP labeling of recombinantly expressed Flag-tagged WT and K373R mutant forms of ABHD12 in HEK293T cell lysates. (G) MDA-MB-231 cells treated with jensenone and (−)- and (+)-guadial B (100 μM, 8 h), show significantly elevated levels of monoacylglycerophosphoserine LPS(18:0) with a concurrent reduction in its hydrolytic degradation product, stearic acid FA(18:0). Data represent average values ± SD, n = 5 per group from five biologically independent experiments. Statistical significance was calculated using a one-way ANOVA with Dunnett’s post hoc test: ****P < 0.0001, ***P = 0.0003, **P = 0.0021. ns, not significant.
Figure 7.
Figure 7.. Structural and functional consequences for phloroglucinol meroterpenoid engagement with lysines K299 and K413 in the mitochondrial isocitrate dehydrogenase IDH2 and its oncogenic gain-of-function R140Q variant.
(A) SAR for phloroglucinol meroterpenoid inhibition (100 μM, 1 h, 37 °C) of α-KG production measured using recombinantly expressed WT-IDH2 and indicated K299 mutants in HEK293T cell lysates with d-(+)-threo-isocitrate substrate (1.3 mM, 1 h, 25 °C). The panel also includes corresponding representative immunoblot results. (B) IDH2 catalyzes the oxidative decarboxylation of isocitrate to α-ketoglutarate (α-KG); however, the hotspot mutation R140Q in IDH2 leads to neomorphic enzymatic activity that results in overproduction of the oncometabolite, d-2-hydroxyglutarate (2-HG). (C, D) Fitted IC50 (95% CI) curves for the dose-dependent inhibition of the oxidative IDH2 activity by (+)-guadial B and (−)-guadial B measured using recombinantly expressed WT- and K299R-IDH2 in HEK293T cell lysates. Data represent average values ± SD, n = 3 per group from three biologically independent experiments. Statistical significance was calculated using a one-way ANOVA with Dunnett’s post hoc test: ****P < 0.0001, ***P = 0.000315, *P = 0.027574. ns, not significant. (E) The location of liganded lysine K299 (dark red) and proximal lysine K413 (dark red) mapped onto the crystal structure of homodimer IDH2 (PDB ID: 5H3F) bound to NADPH (teal). Inset shows a magnified view of the pocket, detailing the spatial arrangement of K299 on chain A (gray) relative to K413 on chain B (tuscany) with an inter-residual distance of 8.6 Å. (F) Quantitative assessment of IDH2 oxidative activity inhibition by jensenone (100 μM, 1 h, 20 °C) in recombinantly expressed WT-IDH2 and indicated K299 mutants in HEK293T cell lysates, complemented by representative immunoblotting data. (G) Fitted IC50 (95% CI) curves for the dose-dependent inhibition of the oxidative IDH2 activity by jensenone measured using recombinantly expressed WT-, K299R-, K413R-, and double-mutant K299R/K413R-IDH2 in HEK293T cell lysates. Data represent average values ± SD, n = 3 per group from three biologically independent experiments. Statistical significance was calculated using a one-way ANOVA with Dunnett’s post hoc test: ****P < 0.0001. ns, not significant. (H) SAR for phloroglucinol meroterpenoid inhibition (100 μM, 2 h, 20 °C) of oncometabolite 2-HG production measured using recombinantly expressed R140Q-IDH2 and indicated K299 mutants in HEK293T cell lysates with α-KG substrate (0.6 mM, 1 h, 25 °C). Data represent average values ± SD, n = 3 per group from three biologically independent experiments. Statistical significance was calculated using a one-way ANOVA with Dunnett’s post hoc test: ****P < 0.0001. ns, not significant. (I) Representative immunoblot depicting jensenone-mediated IDH2 homodimerization of recombinantly expressed Flag-tagged WT- and R140Q-IDH2 with indicated K299 and K413 mutants in HEK293T cell lysates. (J) Fitted IC50 (95% CI) curves for the dose-dependent inhibition of reductive R140Q-IDH2 activity by jensenone measured using recombinantly expressed R140Q-, double mutant R140Q/K299R-, and triple mutant R140Q/K299R/K413R-IDH2 in HEK293T cell lysates. Data represent average values ± SD, n = 3 per group from three biologically independent experiments.
Figure 8.
Figure 8.. Differential ligandability and functionality of conserved lysines in the liver isoform of human phosphofructokinase PFKL.
(A) Hierarchical clustering heatmap depicting TMT quantification of stereoselective meroterpenoid–lysine interactions on human phosphofructokinase isoforms in MDA-MB-231 and MDA-MB-436 breast cancer cells. (B) Multiple sequence alignment of phosphofructokinase orthologues across multiple vertebrate species. (C) Location of liganded lysines K315, K677, and K681 (dark red) mapped onto the Cryo-EM structure of the human PFKL (PDB ID: 7LW1) bound to ADP (teal; superimposed from PDB ID: 3O8N) in the nucleotide effector site. Catalytic and regulatory domains are colored light and dark gray, respectively. ADP (teal) and F6P (yellow) are bound to the catalytic site. FBP (green) is bound to the allosteric sugar effector site. (D) Quantitative assessment of enzymatic activity in recombinantly expressed WT-PFKL and indicated lysine mutants in HEK293T cell lysates, complemented by representative immunoblotting data. Data represent average values ± SD, n = 3 per group from three biologically independent experiments. Statistical significance was calculated using a one-way ANOVA with Dunnett’s post hoc test: *P = 0.0122. ns, not significant. (E) SAR for phloroglucinol meroterpenoid inhibition (100 μM, 1 h, 20 °C) of the F6P phosphorylation measured using recombinantly expressed epitope-tagged WT-PFKL in HEK293T cell lysates. Data represent average values ± SD, n = 3 per group from three biologically independent experiments. Statistical significance was calculated using a one-way ANOVA with Dunnett’s post hoc test: ****P < 0.0001, *P = 0.034. ns, not significant. (F, G) Fitted IC50 (95% CI) curves for the dose-dependent inhibition of PFKL activity by (+)-guadial B and (−)-guadial B measured using recombinantly expressed WT-PFKL and indicated lysine mutants in HEK293T cell lysates. Data represent average values ± SD, n = 3 per group from three biologically independent experiments.
Figure 9.
Figure 9.. Enantiodivergent ligandability and functionality of conserved lysines in the muscle and platelet isoforms of human phosphofructokinase PFKM and PFKP.
(A) SAR for phloroglucinol meroterpenoid inhibition (100 μM, 2 h, 37 °C) of the F6P phosphorylation measured using recombinantly expressed epitope-tagged WT-PFKM in HEK293T cell lysates. Data represent average values ± SD, n = 3 per group from three biologically independent experiments. Statistical significance was calculated using a one-way ANOVA with Dunnett’s post hoc test: ****P < 0.0001. ns, not significant. (B, C) Fitted IC50 (95% CI) curves for the dose-dependent inhibition of PFKM activity by jensenone and (+)-guadial C measured using recombinantly expressed WT-PFKM and the corresponding K678R mutant in HEK293T cell lysates. Data represent average values ± SD, n = 3 per group from three biologically independent experiments. (D) HEK293T cell lysates recombinantly expressing epitope-tagged WT-PFKP and the corresponding K688R mutant were treated with the indicated phloroglucinol meroterpenoids (5 μM, 1 h, 20 °C) followed by treatment with the lysine-reactive probe P1 (1 μM, 1 h, 20 °C) and analysis by gel-ABPP and immunoblotting. (E) Representative gel-ABPP, immunoblotting, and densitometric analysis demonstrating dose-dependent blockade of probe P1 labeling of recombinant WT-PFKP in HEK293T cell lysates by (+)-guadial B and (−)-guadial B. Data represent average values ± SD, n = 3 per group from three biologically independent experiments. Statistical significance was calculated using a one-way ANOVA with Dunnett’s post hoc test: ****P < 0.0001, **P = 0.0011. ns, not significant. P1, NHS-fluorescein (carboxyfluorescein succinimidyl ester). (F) Fitted IC50 (95% CI) curves for the dose-dependent blockade of P1 probe labeling by (+)-guadial B and (−)-guadial B measured using recombinantly expressed WT-PFKP in HEK293T cell lysates. Data represent average values ± SD, n = 3 per group from three biologically independent experiments. (G) SAR for phloroglucinol meroterpenoid inhibition (1 μM, 1 h, 20 °C) of the F6P phosphorylation measured using recombinantly expressed epitope-tagged WT-PFKP in HEK293T cell lysates. Data represent average values ± SD, n = 3 per group from three biologically independent experiments. Statistical significance was calculated using a one-way ANOVA with Dunnett’s post hoc test: ****P < 0.0001. ns, not significant. (H) Fitted IC50 (95% CI) curves for the dose-dependent inhibition of PFKP activity by (+)-guadial B and (−)-guadial B measured using recombinantly expressed WT-PFKP and the corresponding K688R mutant in HEK293T cell lysates. Data represent average values ± SD, n = 3 per group from three biologically independent experiments. (I) Left: Volcano plot showing statistically significant (false discovery rate-corrected P value <0.05 and fold change >2.0) lysines liganded by (+)- and (−)-guadial B in MDA-MB-231 cells with log2(FC) on the x axis and −log10(P value) on the y axis (RTS-SPS-MS3 acquisition). P values were determined by Student’s t test (two-tailed, two-sample equal variance). Ligandable lysines are indicated as (+)-guadial B selective (red), (−)-guadial B selective (blue) and nonselective (gray). Data represent average values ± SD, n = 3 per group from three biologically independent experiments. Right: Volcano plot depicting statistically significant (false discovery rate-corrected P value <0.05 and fold change >2.0) altered metabolites in MDA-MB-231 cells treated with (+)- and (−)-guadial B. P values were determined by Student’s t test (two-tailed, two-sample equal variance). Blue circles represent metabolites selectively downregulated by (+)-guadial B treatment, red circles represent metabolites selectively upregulated by (+)-guadial B treatment, gray circles represent metabolites with no significant difference. Data represent average values ± SD, n = 6 per group from six biologically independent experiments. FC, fold change.

Similar articles

Cited by

References

    1. Gerry CJ; Schreiber SL Chemical probes and drug leads from advances in synthetic planning and methodology. Nat. Rev. Drug Discovery 2018, 17 (5), 333–352. - PMC - PubMed
    1. Hopkins AL; Groom CR The druggable genome. Nat. Rev. Drug Discovery 2002, 1 (9), 727–730. - PubMed
    1. Macarron R; Banks MN; Bojanic D; Burns DJ; Cirovic DA; Garyantes T; Green DVS; Hertzberg RP; Janzen WP; Paslay JW; et al. Impact of high-throughput screening in biomedical research. Nat. Rev. Drug Discovery 2011, 10 (3), 188–195. - PubMed
    1. Boike L; Henning NJ; Nomura DK Advances in covalent drug discovery. Nat. Rev. Drug Discovery 2022, 21 (12), 881–898. - PMC - PubMed
    1. Parker CG; Galmozzi A; Wang Y; Correia BE; Sasaki K; Joslyn CM; Kim AS; Cavallaro CL; Lawrence RM; Johnson SR; et al. Ligand and target discovery by fragment-based screening in human cells. Cell 2017, 168 (3), 527–541.e529. - PMC - PubMed

Publication types