. 2024 Jan 16;16(2):1161-1181.
doi: 10.18632/aging.205387. Epub 2024 Jan 16.

A circRNA ceRNA network involved in cognitive dysfunction after chronic cerebral hypoperfusion

Affiliations

A circRNA ceRNA network involved in cognitive dysfunction after chronic cerebral hypoperfusion

Wan-Rong Jiang et al. Aging (Albany NY). .

Abstract

Chronic Cerebral Hypoperfusion (CCH) is associated with cognitive dysfunction, the underlying mechanisms of which remain elusive, hindering the development of effective therapeutic approaches. In this study, we employed an established CCH animal model to delve into neuropathological alterations like oxidative stress, inflammation, neurotransmitter synthesis deficits, and other morphological alterations. Our findings revealed that while the number of neurons remained unchanged, there was a significant reduction in neuronal fibers post-CCH, as evidenced by microtubule-associated protein 2 (MAP2) staining. Moreover, myelin basic protein (MBP) staining showed exacerbated demyelination of neuronal fibers. Furthermore, we observed increased neuroinflammation, proliferation, and activation of astrocytes and microglia, as well as synaptic loss and microglial-mediated synapse engulfment post-CCH. Utilizing RNA sequencing, differential expression analysis displayed alterations in both mRNAs and circRNAs. Following gene ontology (GO) and Kyoto Encyclopedia of Genes and Genomes (KEGG) enrichment analyses, both showed significant enrichment in immunological and inflammation-related terms and pathways. Importantly, the differentially expressed circular RNAs (DE circRNAs) exhibited a notable coexpression pattern with DE mRNAs. The ternary circRNA-miRNA-mRNA competing endogenous RNAs (ceRNA) network was constructed, and subsequent analysis reiterated the significance of neuroimmunological and neuroinflammatory dysfunction in CCH-induced neuropathological changes and cognitive dysfunction. This study underscores the potential role of circRNAs in these processes, suggesting them as promising therapeutic targets to mitigate the detrimental effects of CCH.

Keywords: RNA sequencing; ceRNA; chronic cerebral hypoperfusion; cognitive dysfunction.


Conflict of interest statement

CONFLICTS OF INTEREST: The authors declare that they have no conflicts of interest.

Figures

Figure 1
Figure 1
Schematic representation of the experimental arrangement for two groups of rats. (A) The timeline diagram of the experimental design; (B) The grouping and order of experimental arrangement. The Con group(n=15): the sham operation group, and the 2VO group(n=25): the bilateral common carotid arteries occlusion group.
Figure 2
Figure 2
The rats’ spatial learning and memory abilities were tested with the Morris water maze. (A) The latency time was recorded during 7-day learning trials for the rats of the Con group (n=15) and 2VO group (n=25); After 1-day rest, the platform was removed and the rats were re-tested in the water maze. And (B) the latency time, (C) crossing times, (D) staying time, as well as (E) swimming speed was recorded and analyzed.
Figure 3
Figure 3
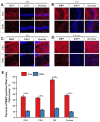
The neuronal densities in different regions of the brain were evaluated with the immunofluorescent NeuN-labeled staining. (A) CA1, (B) CA3, (C) DG, (D) Cortex, (E) Striatium regions were stained with NeuN antibody and DAPI. The red and blue staining indicated the NeuN-labeled neurons and the nucleus, respectively. The purple indicated the merge of both. (F) Count of NeuN-labeled neurons in different regions. Scale bar=10μm. [(Con group, n=3), (2VO group, n=3)].
Figure 4
Figure 4
The neuronal fiber density in different regions of the brain was evaluated with the immunofluorescent MAP2-labeled staining. (A) CA1, (B) CA3, (C) DG, (D) Cortex, (E) Striatum regions were stained with MAP2 antibody and DAPI. The green and blue staining indicated the MAP2-labeled neuronal fibers and the nucleus, respectively. (F) The density of MAP2-labeled neuronal fibers in different regions. Scale bar = 25μm. The scale bar in the magnified image = 5μm. [(Con group, n=3), (2VO group, n=3)].
Figure 5
Figure 5
The degree of myelination of neuronal fibers in different regions of the brain was evaluated with the immunofluorescent MBP-labeled staining. (A) CA1, (B) CA3, (C) DG, and (D) Cortex regions were stained with MBP antibody and DAPI. The red and blue staining indicated the MBP-labeled neuronal fibers and the nucleus, respectively. (E) Percentage of the MBP-positive fiber area in various regions. Scale bar = 25μm. [(Con group, n=3), (2VO group, n=3)].
Figure 6
Figure 6
The astrocyte profiles in different regions of the brain were evaluated with the immunofluorescent GFAP-labeled staining. (A) astrocytes in CA1 were shown with GFAP antibody staining. (B) density, (C) body area, (D) branch number, (E) total projection length, and (F) maximum length of GFAP-positive cells were analyzed. (G) astrocytes in CA3 were shown with GFAP antibody staining. (H) density, (I) body area, (J) branch number, (K) total projection length, and (L) maximum length of GFAP-positive cells were analyzed. (M) astrocytes in the DG were shown with GFAP antibody staining. (N) density, (O) body area, (P) branch number, (Q) total projection length, and (R) maximum length of GFAP-positive cells were analyzed. (S) astrocytes in the cortex were shown with GFAP antibody staining. (T) density, (U) body area, (V) branch number, (W) total projection length, and (X) maximum length of GFAP-positive cells were analyzed. Scale bar=25μm. The scale bar in the magnified image=5μm. [(Con group, n=3), (2VO group, n=3)].
Figure 7
Figure 7
The microglia profiles in different regions of the brain were evaluated with the immunofluorescent (IBA-1)-labeled staining. (A) Microglia in CA1 were shown with IBA-1 antibody staining. (B) density, (C) body area and (D) branch number of IBA-1 positive cells were analyzed. (E) Microglia in CA3 were shown with IBA-1 antibody staining. (F) density, (G) body area and (H) branch number of IBA-1 positive cells were analyzed. (I) Microglia in DG were shown with IBA-1 antibody staining. (J) density, (K) body area and (L) branch number of IBA-1 positive cells were analyzed. (M) Microglia in the cortex were shown with IBA-1 antibody staining. (N) density, (O) body area and (P) branch number of IBA-1 positive cells were analyzed. Scale bar = 25μm. The scale bar in magnified image = 5μm. [(Con group, n=3), (2VO group, n= 3)].
Figure 8
Figure 8
CCH induces the loss of synapses and increased phagocytosis of synapses by microglia. (A) Brain slices of the hippocampus were stained with synapsin and PSD95 antibodies to show the synapses. (B) The density of synapses was analyzed (n=5). (C) Brain slices of the hippocampus were stained with PSD-95 and IBA-1 antibodies to show the engulfing of synapses by microglia. (D) The PSD-95 positive punctation number of microglia’s cell body was analyzed (n=6). Scale bar = 2.5μm.
Figure 9
Figure 9
The homogeneous quality analysis of RNA sequencing in different samples. (A) log10(FPKM) level in different groups; (B) Gene expression density of FPKM bases in each sample; (C) The gene number of different intervals of FPKM bases values(0-0.5, 0.5-1, 1-10, >=10); (D) Coefficient analysis of gene number of FPKM bases in different groups; (E) log10(RPM) level in different groups; (F) Gene expression density of RPM bases in each sample; (G) The gene number of different intervals of RPM bases values(0-0.25, 0.25-1.5, 1.5-2.5, >=2.5); (H) Coefficient analysis of gene number of RPM bases in different groups. [(Con group, n=3), (2VO group, n=3)].
Figure 10
Figure 10
The MA plot of RNA sequencing data. (A) The MA plot of mRNA data; (B) The MA plot of circRNA data. The Y-axis indicates the log2(fold change), and the X-axis indicates the mean of normalized counts. The pink horizontal line represents the boundary between increased and decreased gene expression. [(Con group, n=3), (2VO group, n=3)].
Figure 11
Figure 11
The validation of RNA sequencing by qRT-PCR. (A) The fold change of selected mRNA and circRNA detected by RNA sequencing and qRT-PCR; (B) Relative mRNA level by qRT-PCR. [(Con group, n=3), (2VO group, n=3)].
Figure 12
Figure 12
GO and KEGG enrichment analysis of DE mRNAs. Through a hypergeometric algorithm, the DE mRNAs were enriched on different GO terms and KEGG pathways. (A) Top 30 GO terms with upregulated DE mRNAs. (B) Top 30 GO terms with downregulated DE mRNAs. (C) enriched KEGG pathways. (D) The chord diagram showed the corresponding relationship between upregulated GO enrichment terms and related DE circRNAs. (E) The chord diagram showed the corresponding relationship between downregulated GO enrichment terms and related DE circRNAs. (F) The chord diagram showed the corresponding relationship between KEGG pathways and related DE circRNAs. [(Con group, n=3), (2VO group, n=3)].
Figure 13
Figure 13
Co-expression network analysis. According to the threshold of P<0.05, Pearson correlation coefficient >0.85, the circRNA and mRNA pairs were filtered to construct the co-expression network. (AC), The red triangle represented the mRNAs, and the Azure arrow represented circRNAs. [(Con group, n=3), (2VO group, n=3)].
Figure 14
Figure 14
CircRNA-miRNA-mRNA ceRNA network. The top 48 MuTATE score pairs were used to plot a ternary network diagram. The arrow represented circRNA, the triangle represented mRNA, diamond represented miRNA. Red and green colors represented upregulation or downregulation. The gray line represents the regulation effect. [(Con group, n=3), (2VO group, n=3)].
Figure 15
Figure 15
GO and KEGG analysis of the mRNAs in ceRNA network. (A) GO analysis, p-Value=0.05 as the threshold of significant enrichment. Red represented molecular function, blue represented cellular component, green represented biological process, the x-axis represented different terms, y-axis –log10(P-value); (B) KEGG analysis, the x-axis represented enrichment score, y-axis represented different pathways. [(Con group, n=3), (2VO group, n=3)].

Similar articles

Cited by

References

    1. Duncombe J, Kitamura A, Hase Y, Ihara M, Kalaria RN, Horsburgh K. Chronic cerebral hypoperfusion: a key mechanism leading to vascular cognitive impairment and dementia. Closing the translational gap between rodent models and human vascular cognitive impairment and dementia. Clin Sci (Lond). 2017; 131:2451–68. 10.1042/CS20160727 - DOI - PubMed
    1. Daulatzai MA. Cerebral hypoperfusion and glucose hypometabolism: Key pathophysiological modulators promote neurodegeneration, cognitive impairment, and Alzheimer’s disease. J Neurosci Res. 2017; 95:943–72. 10.1002/jnr.23777 - DOI - PubMed
    1. Washida K, Hattori Y, Ihara M. Animal Models of Chronic Cerebral Hypoperfusion: From Mouse to Primate. Int J Mol Sci. 2019; 20:6176. 10.3390/ijms20246176 - DOI - PMC - PubMed
    1. Yan N, Xu Z, Qu C, Zhang J. Dimethyl fumarate improves cognitive deficits in chronic cerebral hypoperfusion rats by alleviating inflammation, oxidative stress, and ferroptosis via NRF2/ARE/NF-κB signal pathway. Int Immunopharmacol. 2021; 98:107844. 10.1016/j.intimp.2021.107844 - DOI - PubMed
    1. Zhao Y, Zhang J, Zheng Y, Zhang Y, Zhang XJ, Wang H, Du Y, Guan J, Wang X, Fu J. NAD+ improves cognitive function and reduces neuroinflammation by ameliorating mitochondrial damage and decreasing ROS production in chronic cerebral hypoperfusion models through Sirt1/PGC-1α pathway. J Neuroinflammation. 2021; 18:207. 10.1186/s12974-021-02250-8 - DOI - PMC - PubMed

Publication types