. 2024 Mar 15;30(6):1175-1188.
doi: 10.1158/1078-0432.CCR-23-2368.

Preclinical Evaluation of NTX-301, a Novel DNA Hypomethylating Agent in Ovarian Cancer

Affiliations

Preclinical Evaluation of NTX-301, a Novel DNA Hypomethylating Agent in Ovarian Cancer

Yinu Wang et al. Clin Cancer Res. .

Abstract

Purpose: DNA methylation causes silencing of tumor-suppressor and differentiation-associated genes, being linked to chemoresistance. Previous studies demonstrated that hypomethylating agents (HMA) resensitize ovarian cancer to chemotherapy. NTX-301 is a highly potent and orally bioavailable HMA, in early clinical development.

Experimental design: The antitumor effects of NTX-301 were studied in ovarian cancer models by using cell viability, stemness and ferroptosis assays, RNA sequencing, lipidomic analyses, and stimulated Raman spectroscopy.

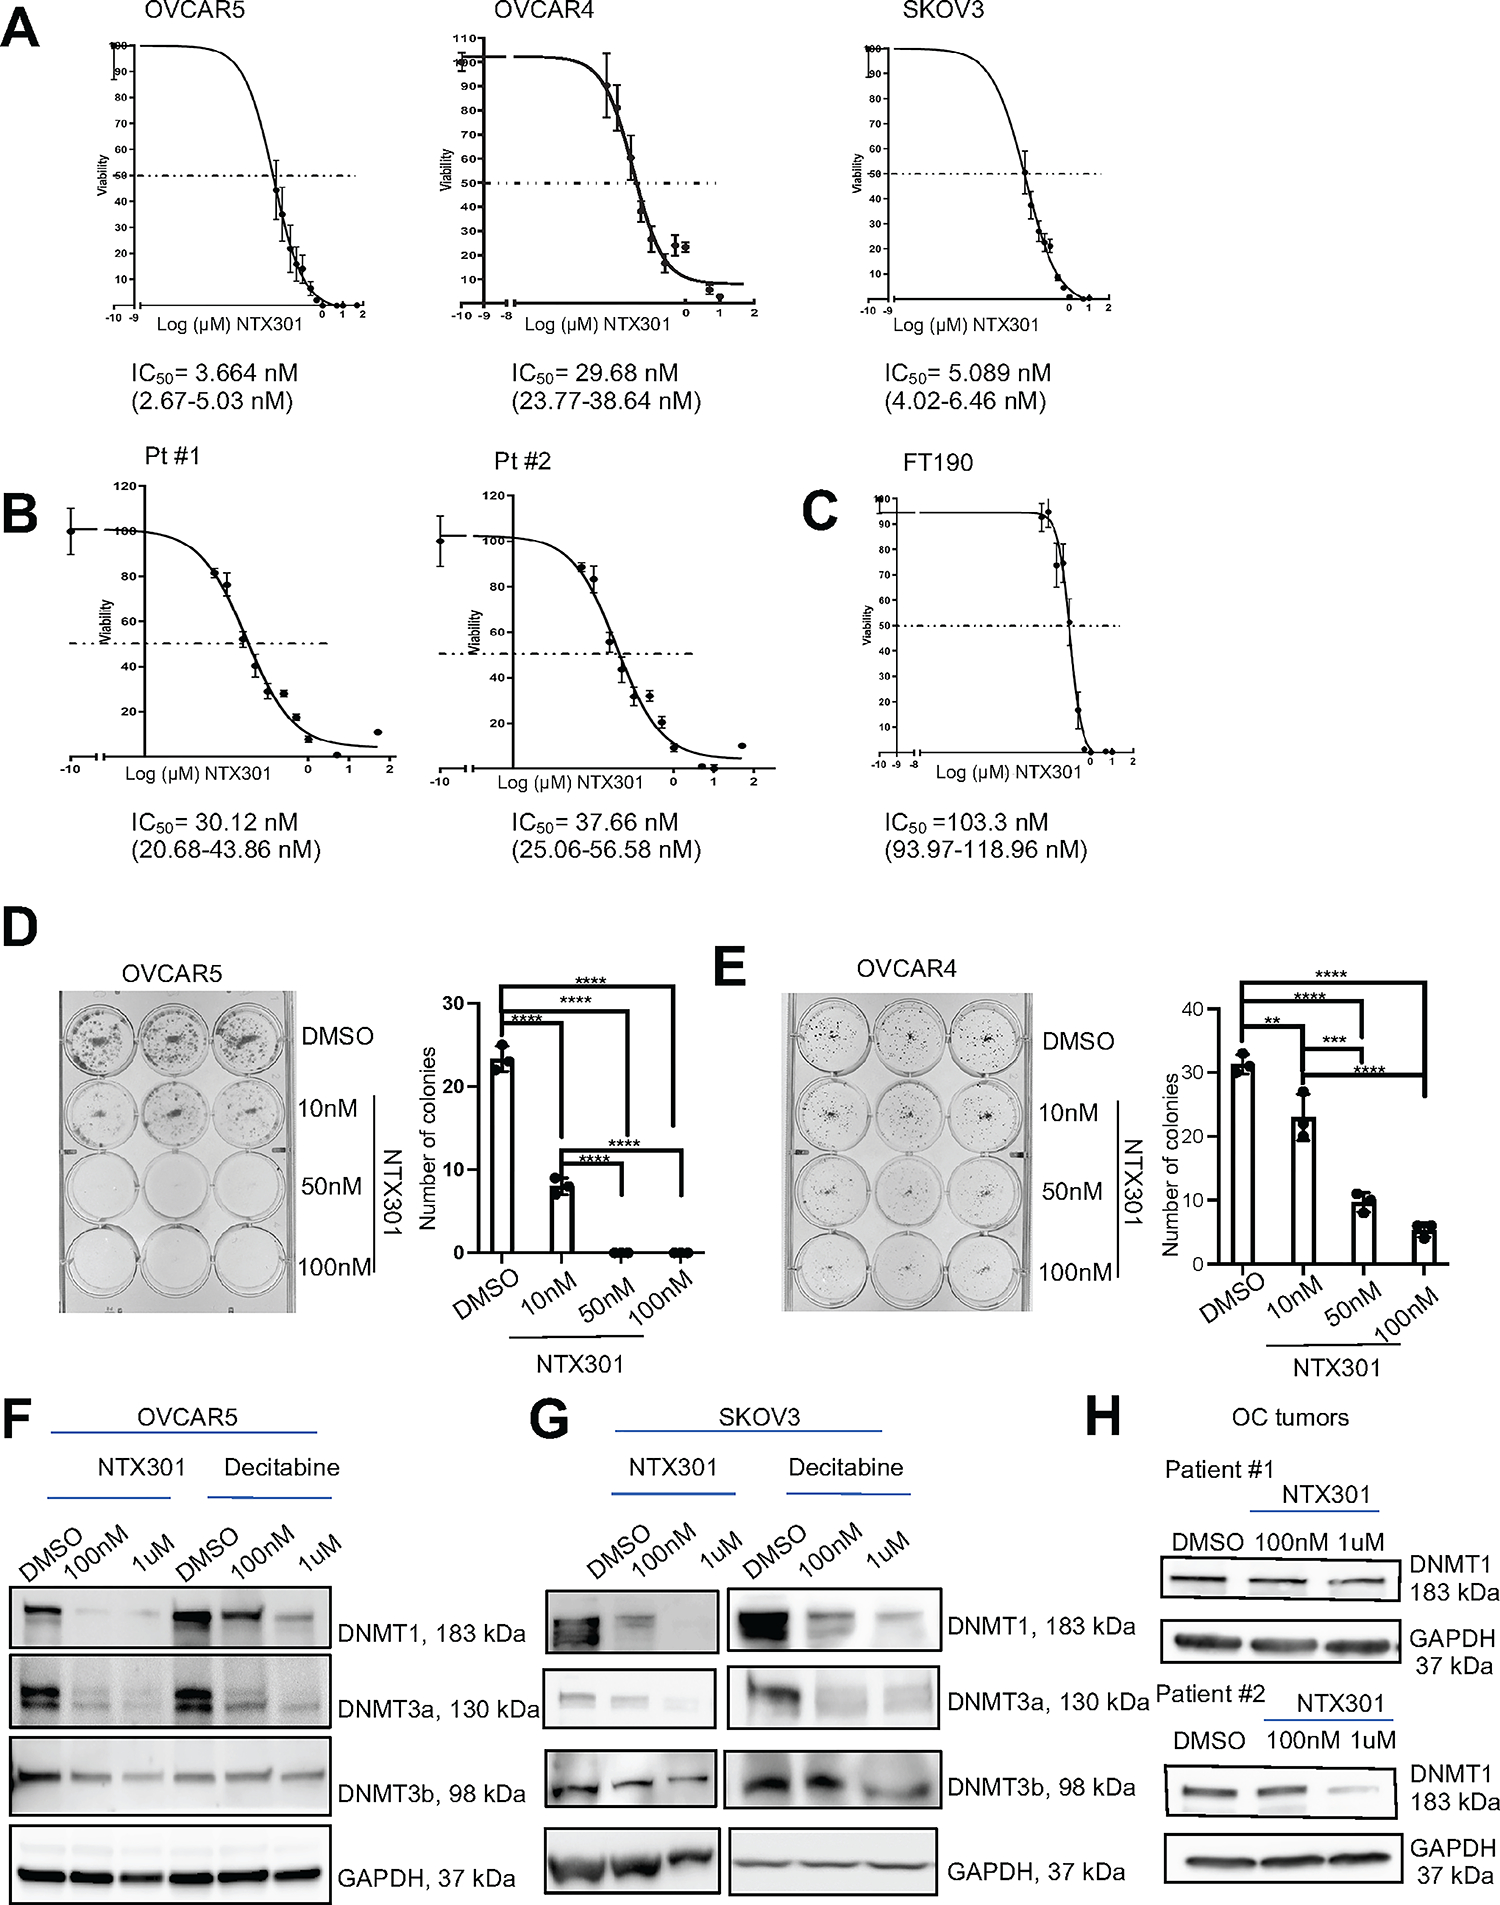
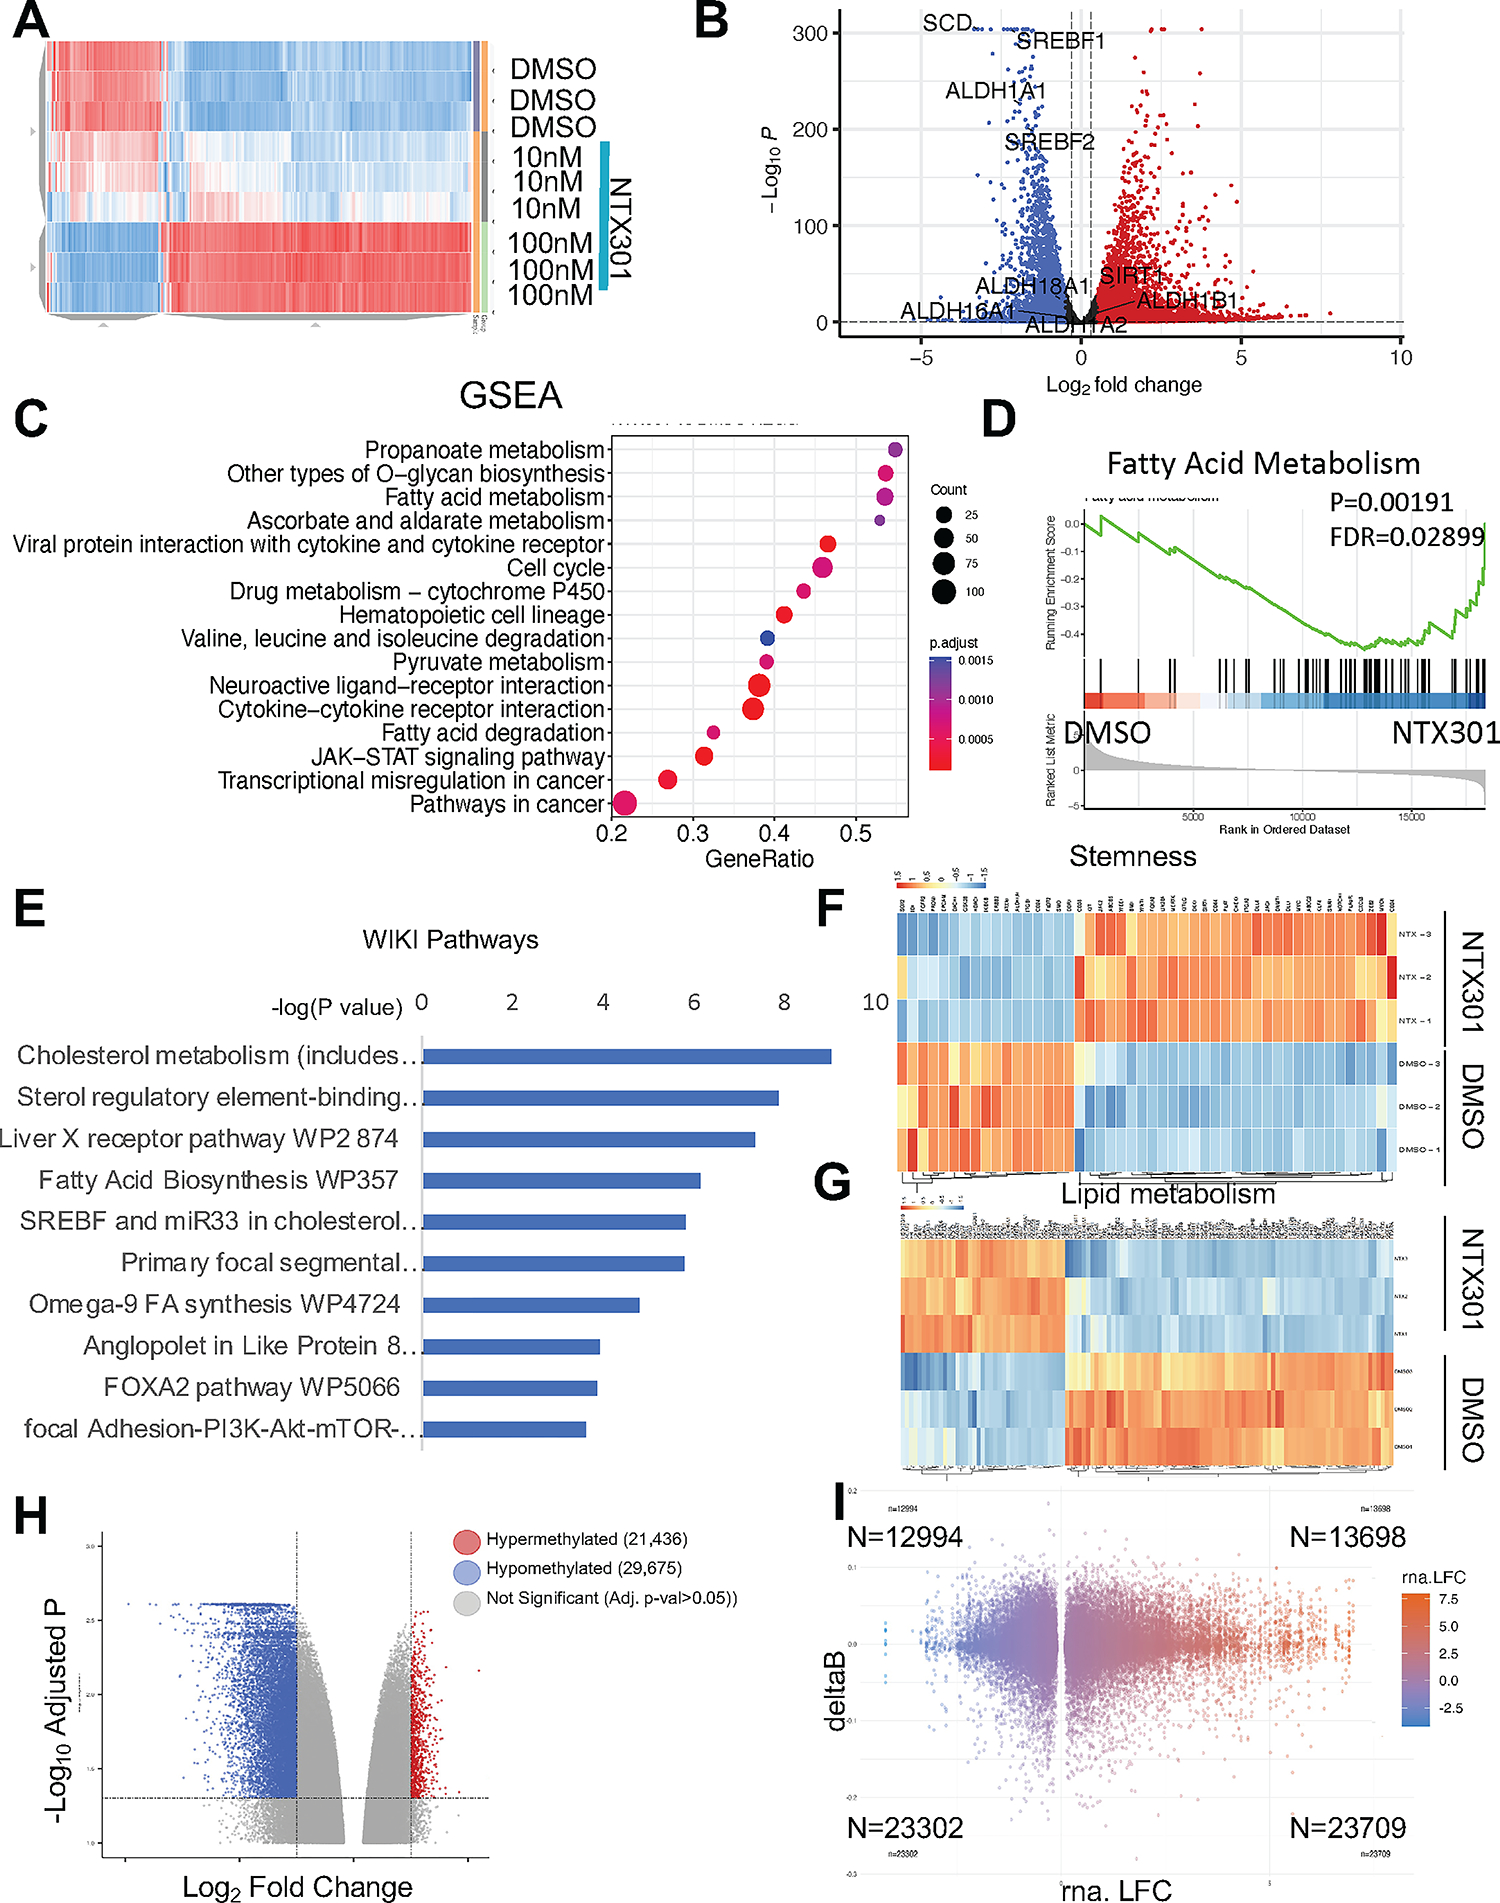
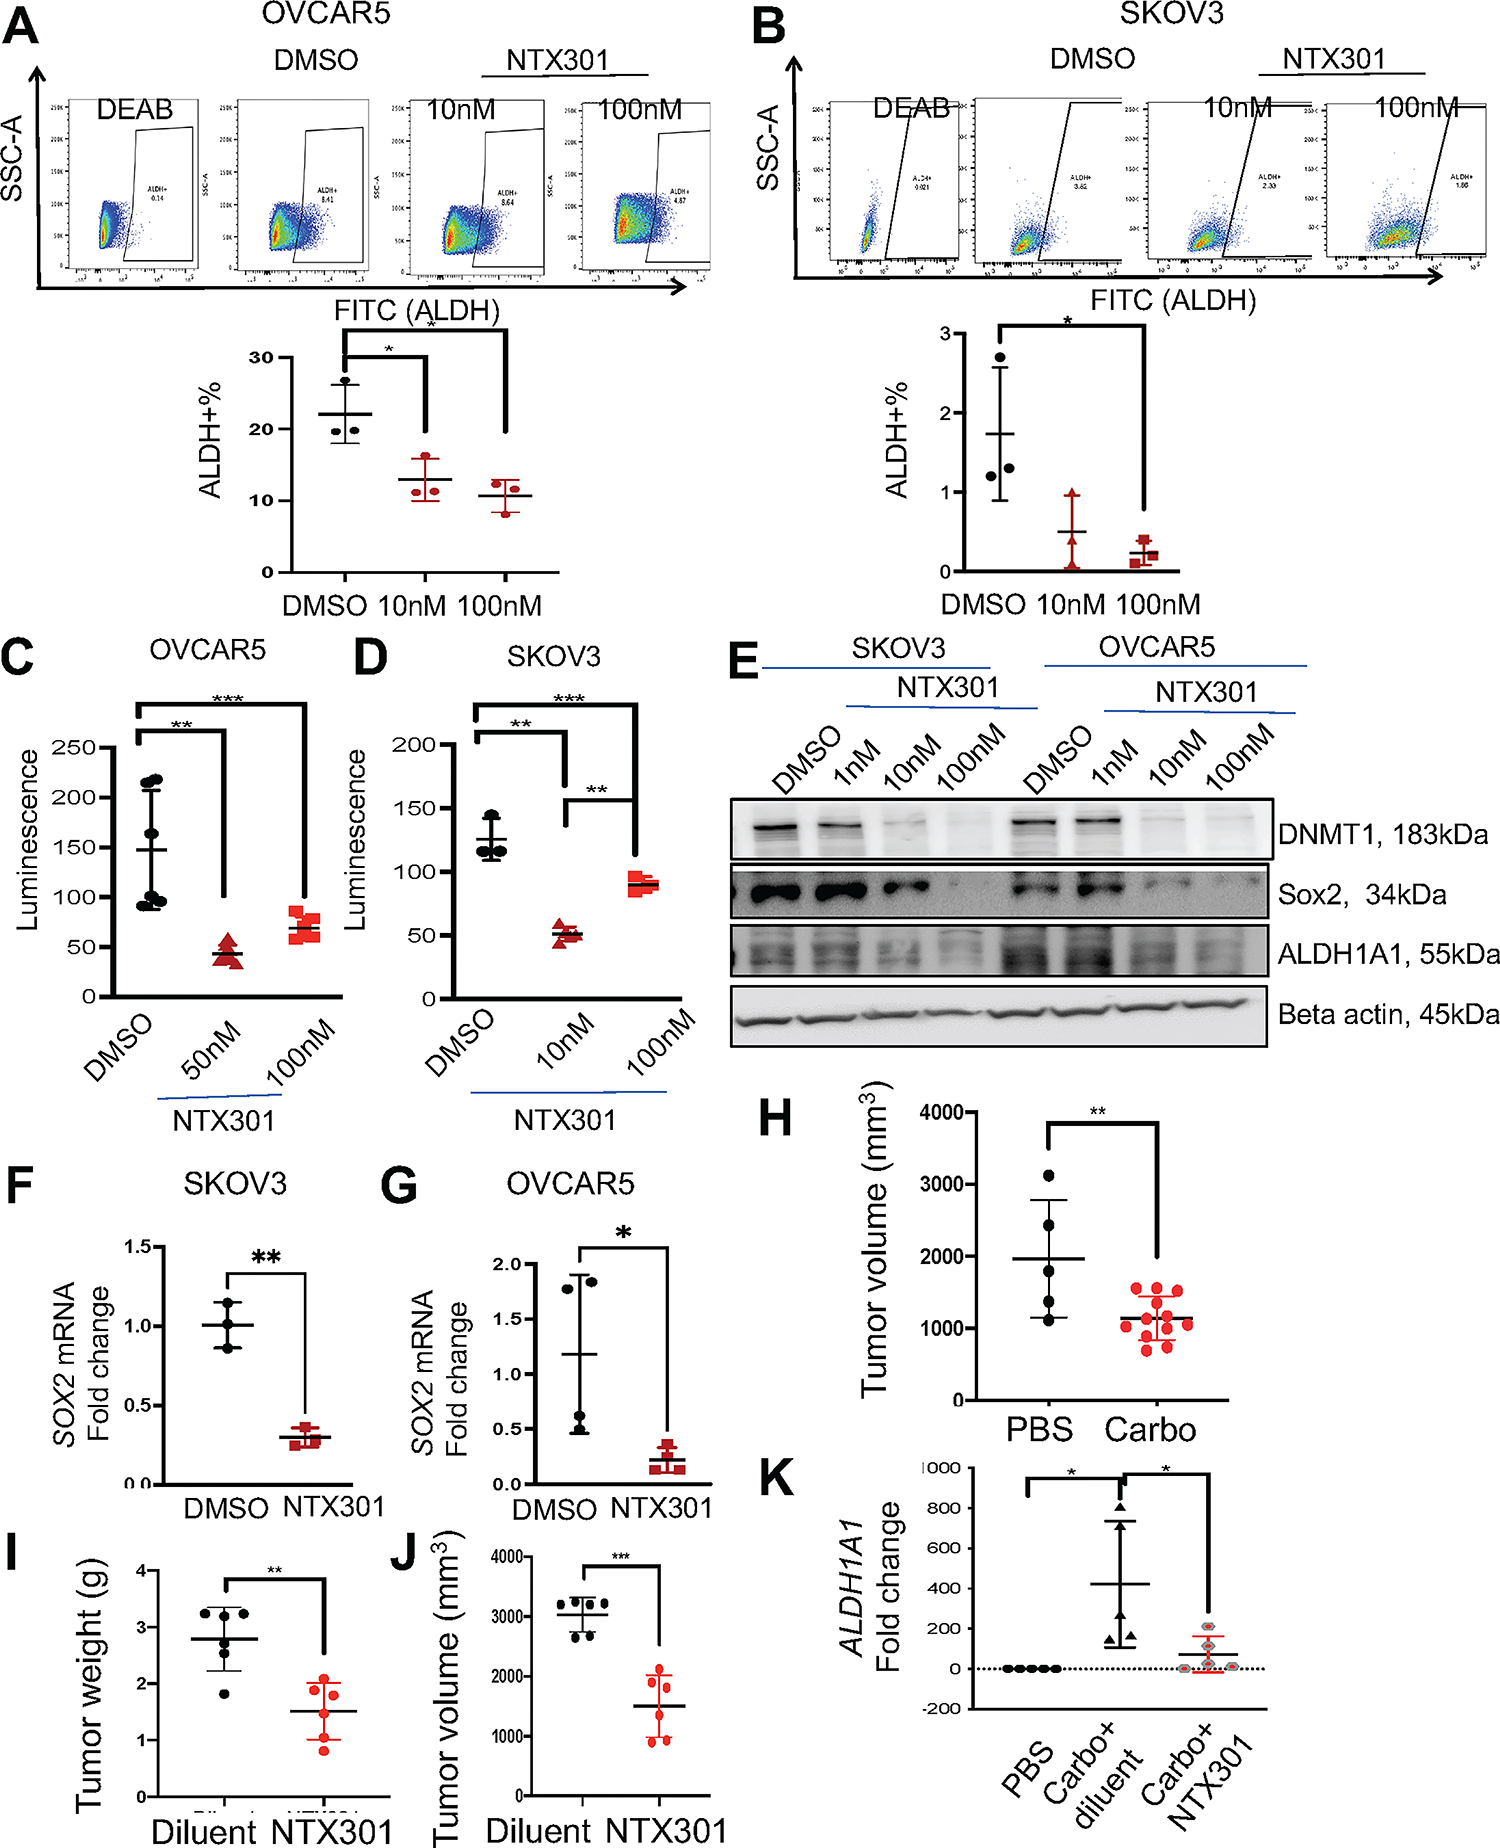
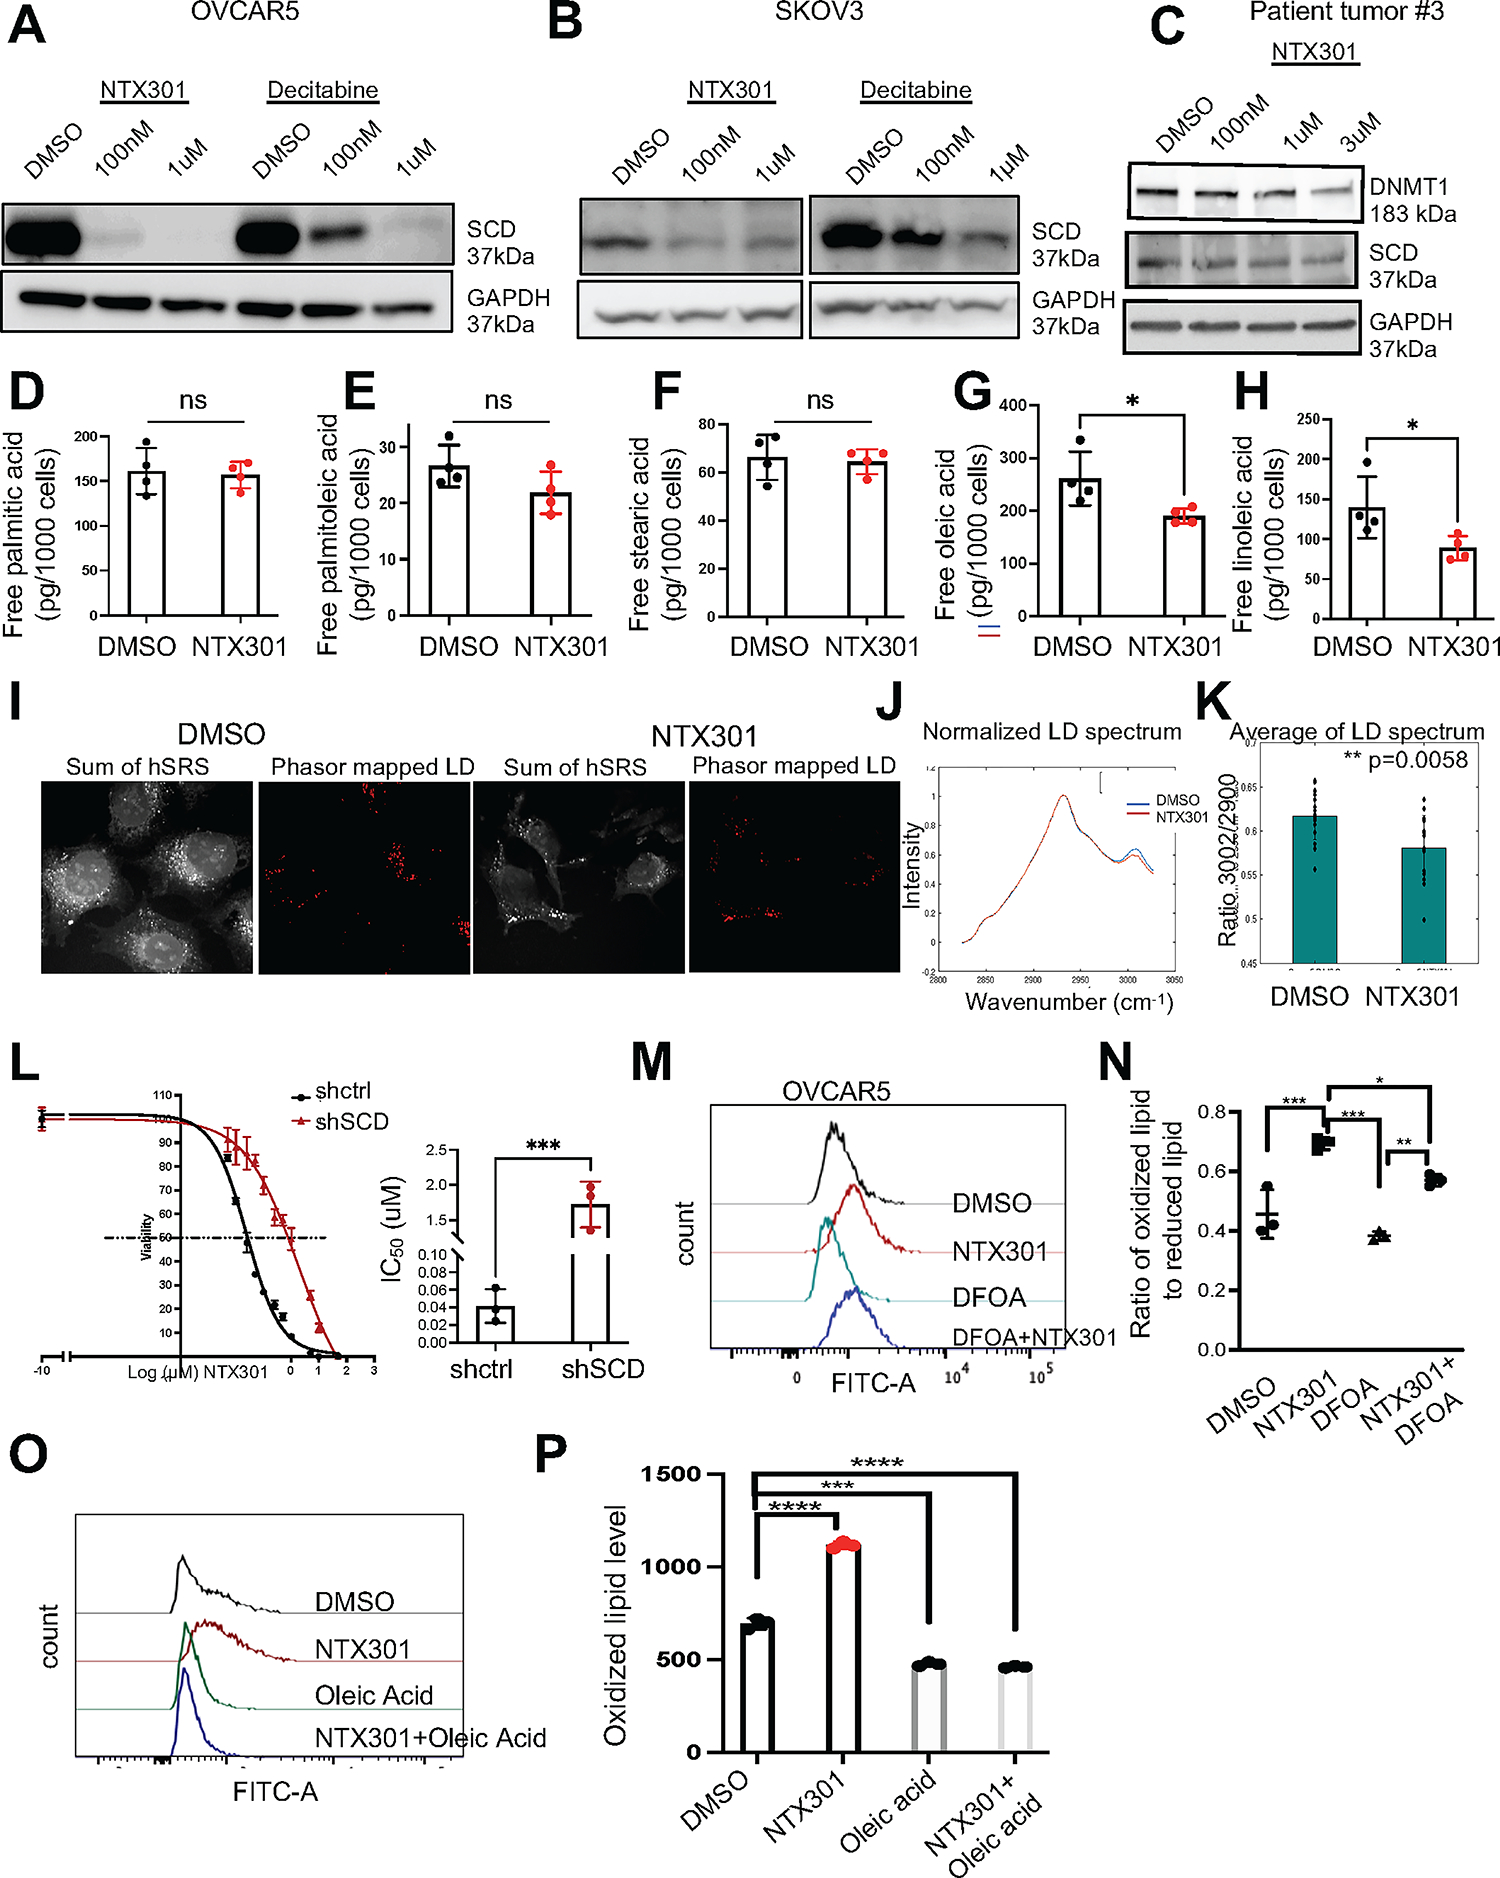
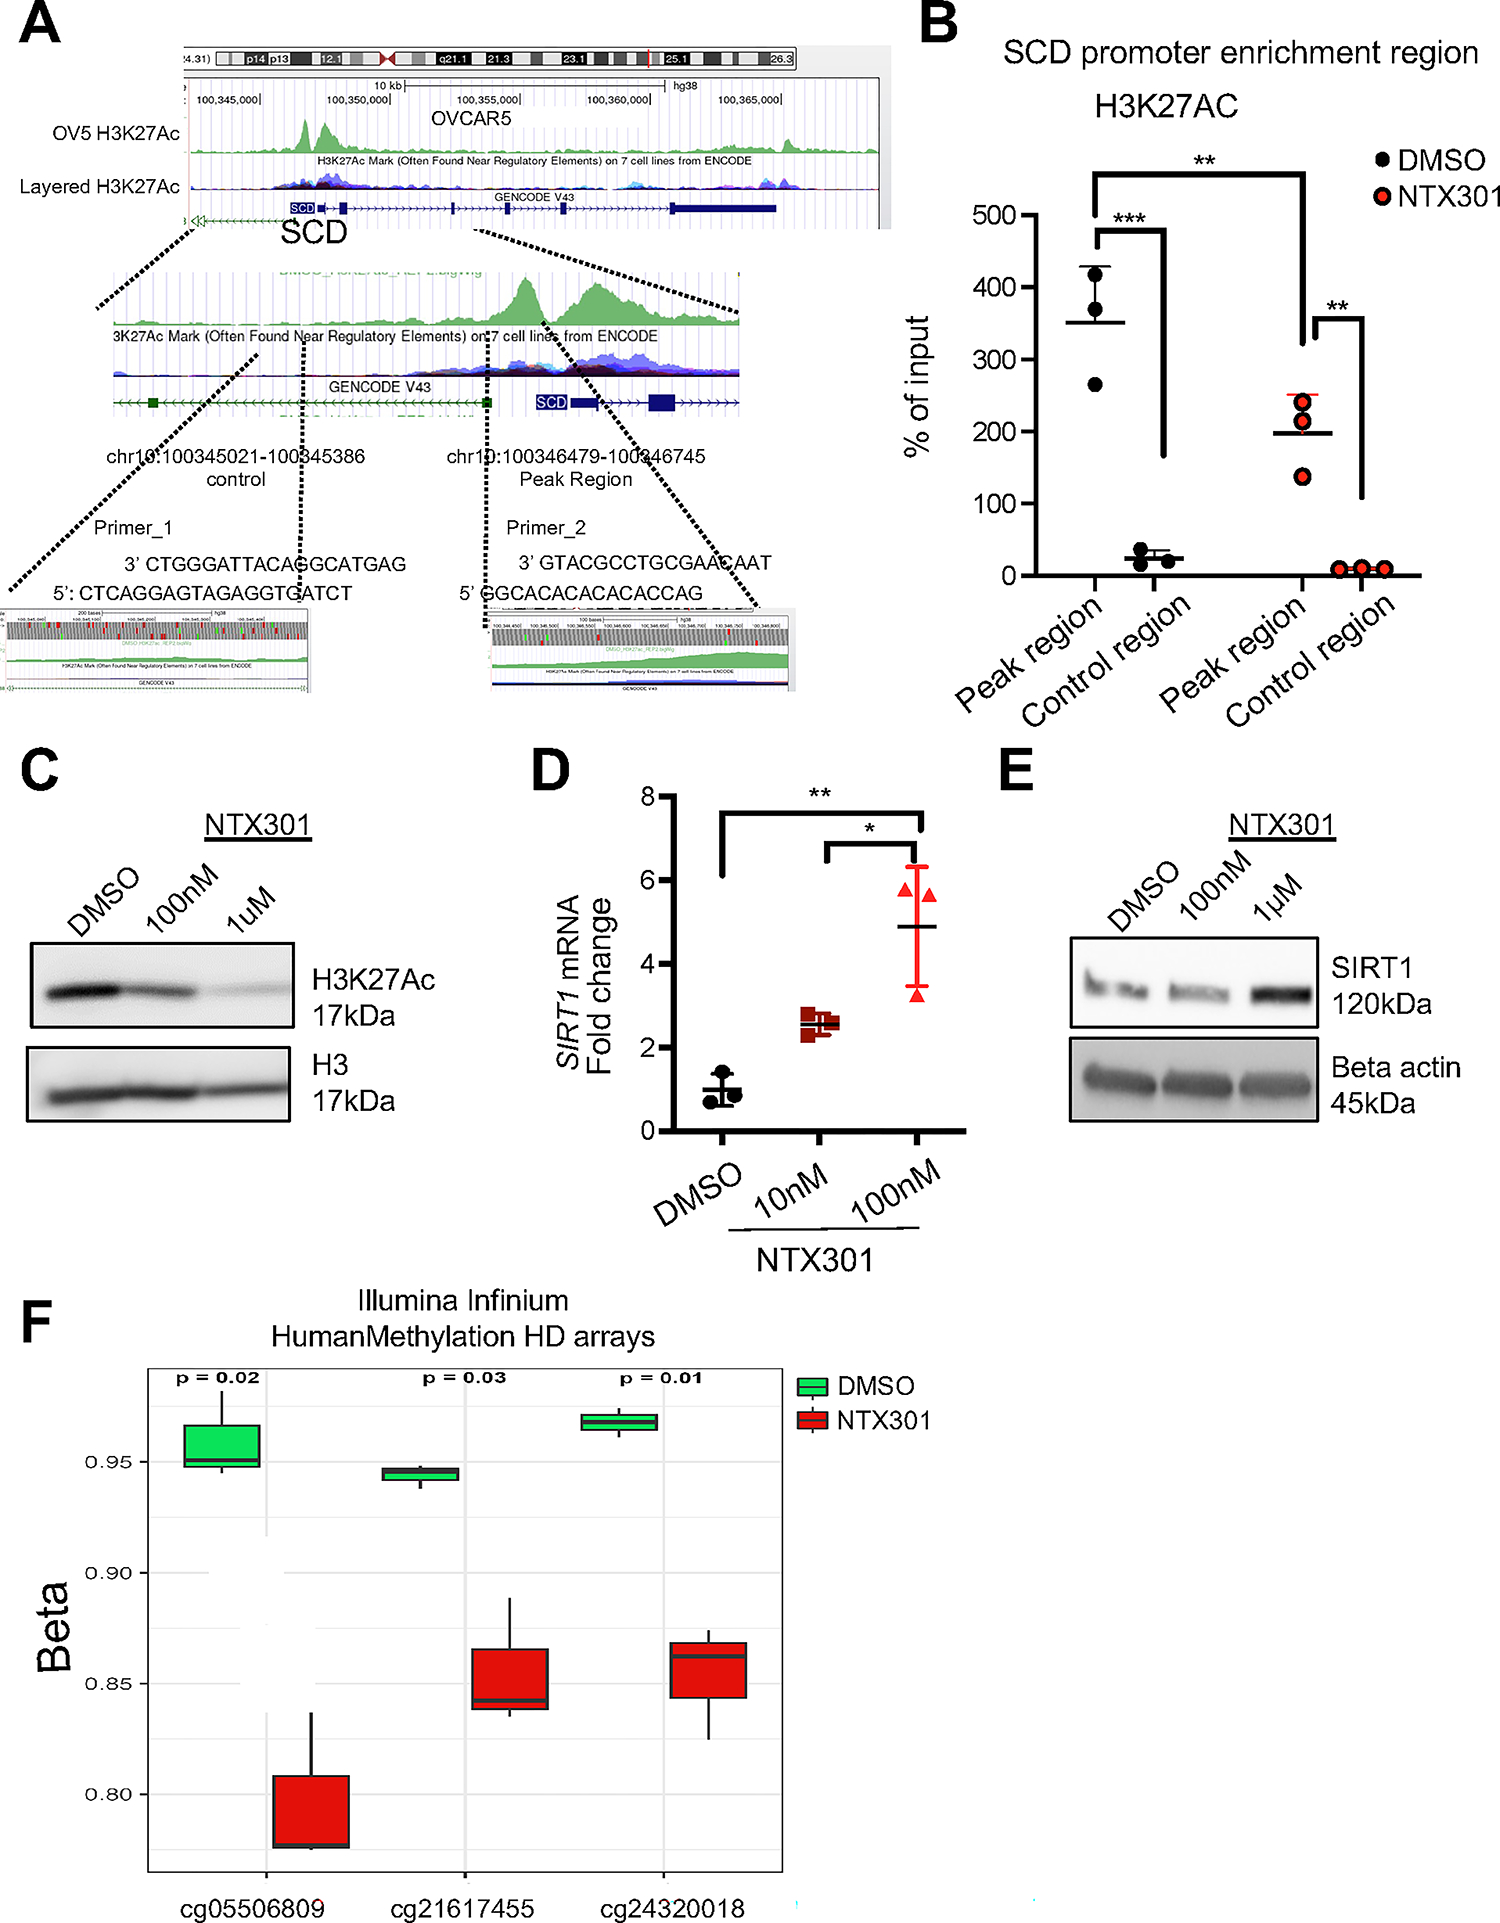
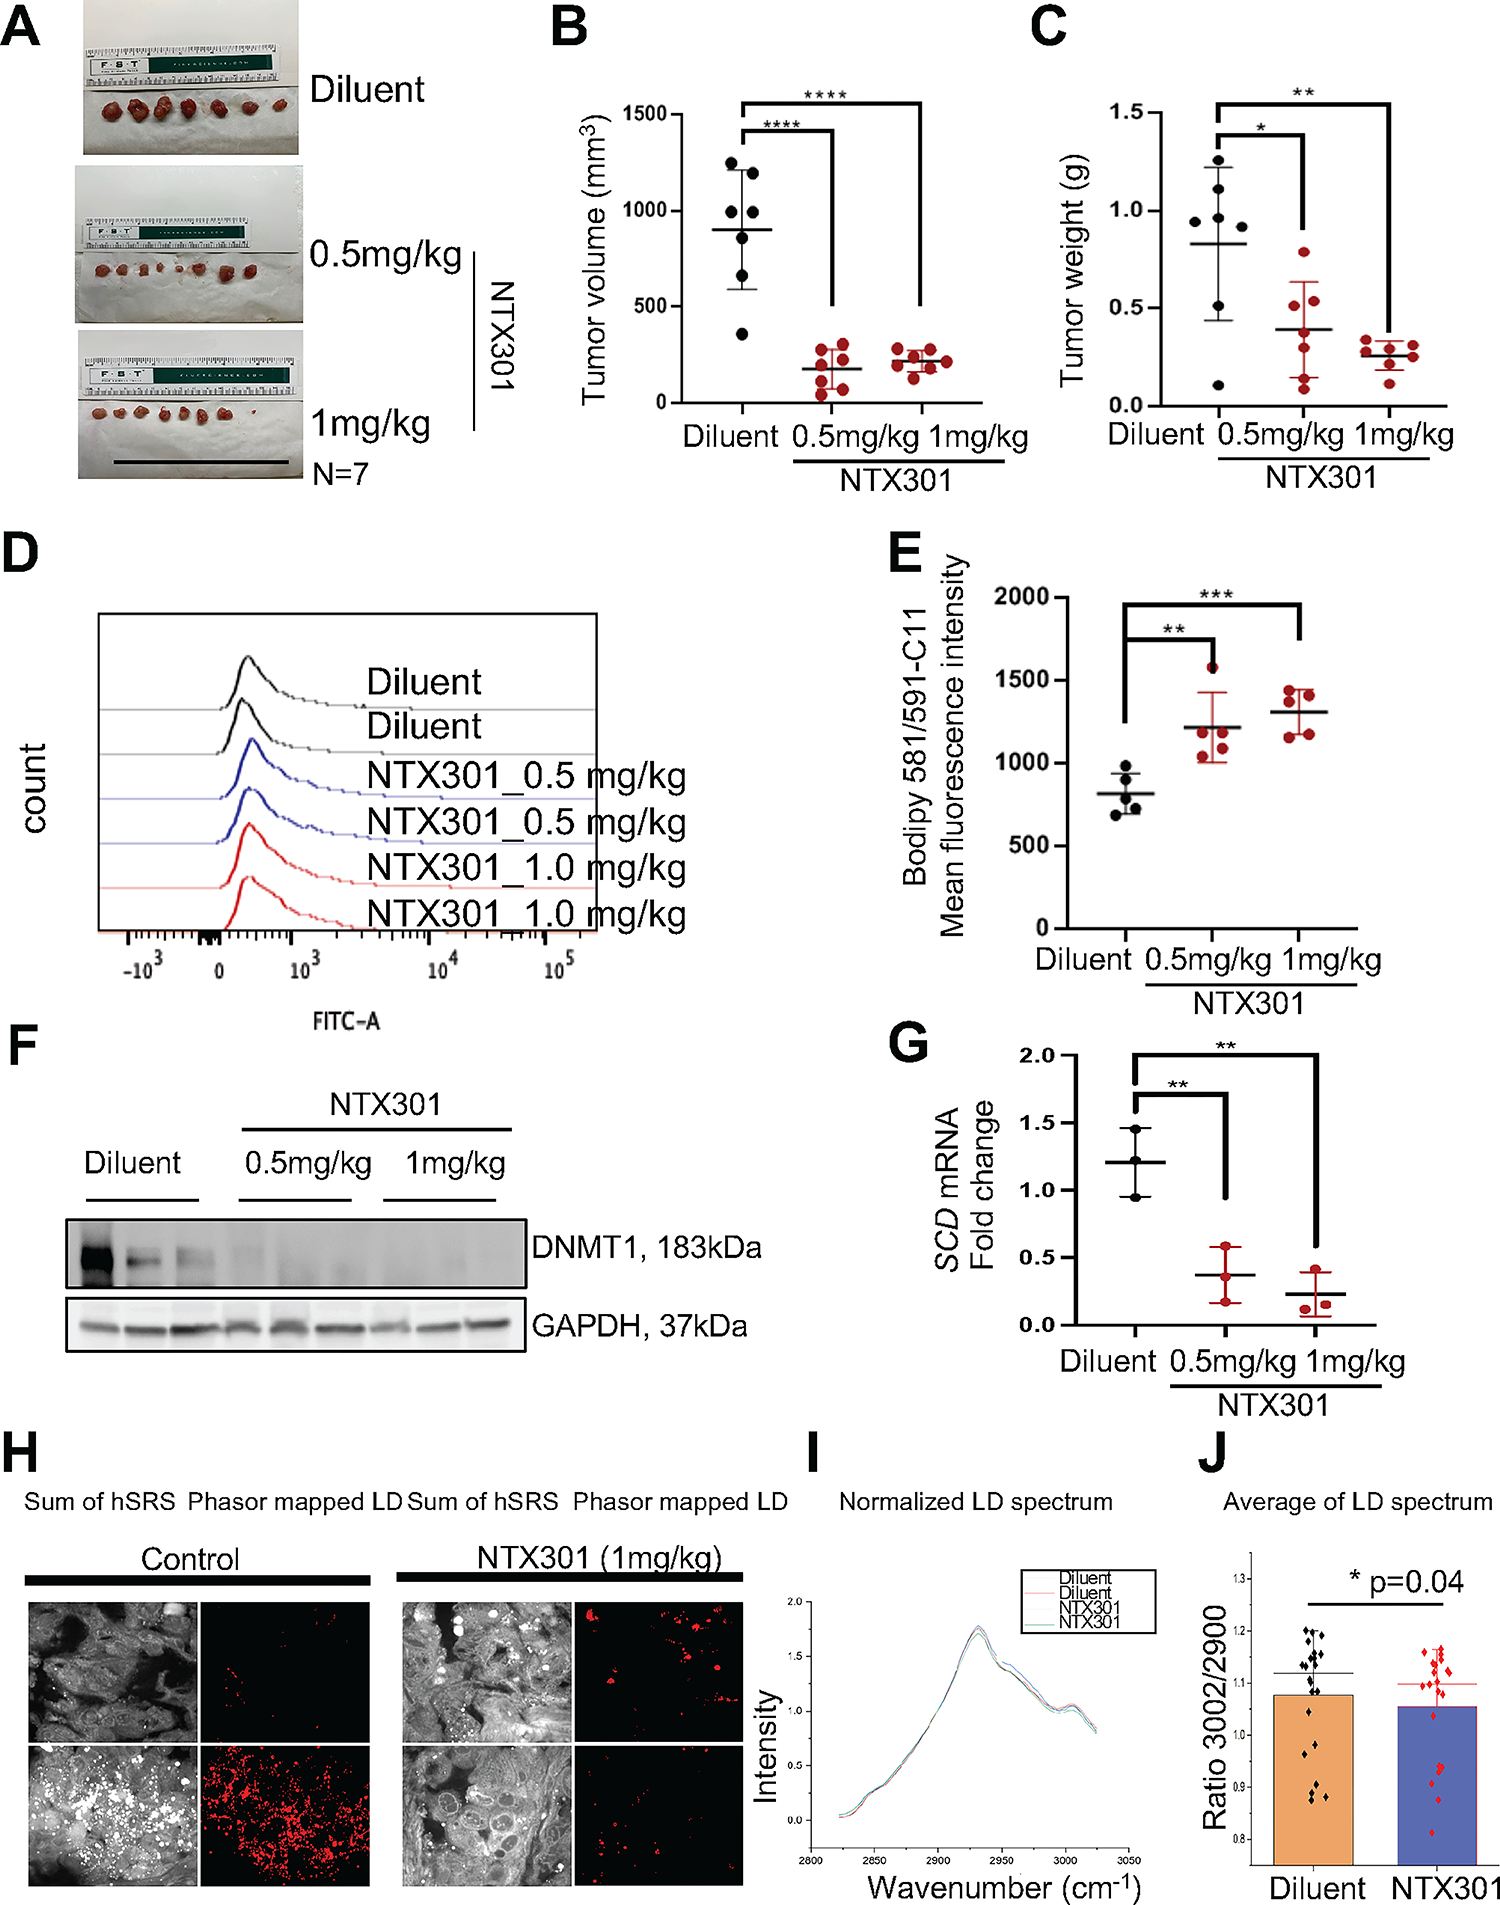
Results: Ovarian cancer cells (SKOV3, IC50 = 5.08 nmol/L; OVCAR5 IC50 = 3.66 nmol/L) were highly sensitive to NTX-301 compared with fallopian tube epithelial cells. NTX-301 downregulated expression of DNA methyltransferases 1-3 and induced transcriptomic reprogramming with 15,000 differentially expressed genes (DEG, P < 0.05). Among them, Gene Ontology enrichment analysis identified regulation of fatty acid biosynthesis and molecular functions related to aldehyde dehydrogenase (ALDH) and oxidoreductase, known features of cancer stem cells. Low-dose NTX-301 reduced the ALDH(+) cell population and expression of stemness-associated transcription factors. Stearoyl-coenzyme A desaturase 1 (SCD), which regulates production of unsaturated fatty acids (UFA), was among the top DEG downregulated by NTX-301. NTX-301 treatment decreased levels of UFA and increased oxidized lipids, and this was blunted by deferoxamine, indicating cell death via ferroptosis. NTX-301-induced ferroptosis was rescued by oleic acid. In vivo, monotherapy with NTX-301 significantly inhibited ovarian cancer and patient-derived xenograft growth (P < 0.05). Decreased SCD levels and increased oxidized lipids were detected in NTX-301-treated xenografts.

Conclusions: NTX-301 is active in ovarian cancer models. Our findings point to a new mechanism by which epigenetic blockade disrupts lipid homeostasis and promotes cancer cell death.


Conflict of interest statement

Conflict of Interest: PinotBio provided drug and funding to support part of the study.

Figures

Figure 1.
Figure 1.. OC cells are highly sensitive to NTX-301 treatment.
(A-C) Effects of NTX-301 on cell viability and estimation of IC50 values in OVCAR5, OVCAR4 and SKOV3 cells (A), OC cells derived from HGSOC tumors (B) and immortalized fallopian tube epithelial cells (FT-190) (C). Cells were treated daily with NTX-301 for 4 days, and cell viability was measured (CCK8 assay) on day 5. (D, E) Colony formation assay (left), and numbers of colonies (mean ± SD, n=3) (right) developed from 1,000 OVCAR5 (D) or OVCAR4 (E) cells treated with different doses of NTX-301 for 7 days. (F, G) Western blot of DNMT1, DNMT3a, DNMT3b, and GAPDH (loading control) in OVCAR5 (F) and SKOV3 (G) cells treated with DMSO, NTX-301(100nM, or 1uM), or decitabine (100nM or 1uM) for 48 hours (n=2 replicates). (H) Western blot of DNMT1 and GAPDH (loading control) in primary OC cells isolated from human HGSOC tumors and treated with DMSO or NTX-301 (100nM or 1uM) for 48 hours (n=2). For all comparisons: *p<0.05, **p<0.01, ***p<0.001.
Figure 2.
Figure 2.. NTX-301 induced transcriptome and methylome reprogramming in OC cells.
(A) Hierarchical clustering heatmap for DEGs (FDR<0.05) measured by RNAseq in OVCAR5 cells treated with NTX-301. Rows represent replicates (n=3/group). (B) Volcano plot of DEGs comparing OVCAR5 cells treated with NTX-301 100nM with DMSO. NTX-301-induced upregulated genes are shown in red and downregulated gene are shown in blue. (C) Dot plot of Gene Set Enrichment Analysis (GSEA) of DEG shows the top sixteen KEGG pathways in OVCAR5 cells treated with NTX-301 (100nM). The size of the circles represents the counts of DEGs within each term, and the color of the circles represents statistical significance. Gene ratio (x axis) is the relative number of DEGs per term. (D) GSEA enrichment plots for the KEGG “fatty acid metabolism” gene set using the gene expression profiles of OVCAR5 cells treated with NTX-301 (100nM) vs. DMSO (n=3). (E) WikiPathways analysis of downregulated DEGs in OVCAR5 OC cells treated with NTX-301 (100nM) vs. DMSO shows the top significantly enriched molecular pathways. Gene expression was measured by RNA-seq (n=3 replicates per group). (F, G) Hierarchical clustering heatmap for DEGs (FDR<0.05) stemness-related genes (F) (23) and lipid metabolism (G) in OVCAR5 cells treated with NTX-301 (100nM) vs. DMSO. Rows represent replicates (n=3/group). (H) Volcano plot of DMPs comparing OVCAR5 cells treated with NTX-301 vs control. Hypermethylated CpG probes are shown in red (positive delta Beta) and hypomethylated CpG probes are shown in blue (negative delta Beta). (I) Scatter plot shows overlapping DEGs associated with promoter-associated DMPs in response to treatment with NTX-301 (100nM, 3days; n = 3 replicates per group). A total of 23,709 genes were both upregulated and were associated with hypomethylated CpG sites (lower right quadrant), =whereas 23,302 genes were downregulated and were associated with hypomethylated CpGs (lower left quadrant).
Figure 3.
Figure 3.. NTX-301 inhibits ALDH+ ovarian CSC population.
(A, B) Representative results of FACS side scatter analysis (top), and percentage (mean ± SD, n=3) (bottom) of ALDH(+) cells in OVCAR5 (A) and SKOV3 (B) OC cells treated with DMSO or NTX-301 (10nM and 100nM, 3 days). (C, D) Effects of NTX-301 (10nM and 100nM, 3days) on spheroid formation assessed by measuring cell viability in OVCAR5 (C) and SKOV3 (D) cells (n = 4–6 per dose). (E) Western blot measured protein levels of DNMT1, Sox2, ALDH1A1, and beta actin (loading control) in SKOV3 and OVCAR5 cells treated with DMSO or NTX-301 for 3 days (n=2). (F, G) mRNA expression levels of SOX2 measured by qRT-PCR (n=3–4) in SKOV3 (F) and OVCAR5 (G) cells treated with DMSO or NTX-301 (100nM, 3days). (H-K) Tumor bearing SQ xenografts were treated with PBS or carboplatin (40mg/kg weekly, 3-weeks) before being randomly assigned to receive NTX-301 (1.0 mg/kg) or diluent. Effects of carboplatin on tumor volume (H) and NTX-301 on tumor weight (I) and tumor volume (J) (n=6/group). (K) mRNA expression levels of ALDH1A1 measured by qRT-PCR in xenografts (n=5, 6) after treatment with diluent or NTX-301 as described in (H). Carbo, carboplatin. For all comparisons, *p<0.05, **p<0.01, ***p<0.001.
Figure 4.
Figure 4.. NTX-301 induces ferroptosis in OC cells by targeting SCD-mediated lipid balance.
(A, B) Western blot measured SCD and GAPDH (loading control) protein levels in OVCAR5 (A) and SKOV3 (B) OC cells treated with DMSO, NTX-301 or decitabine for 2 days (n=2). (C) Western blot of DNMT1 and SCD in cells isolated from HGSOC tumors and treated with DMSO or NTX-301. (D-H) Lipidomics analysis measured amounts (means ± SD, n=4) of palmitic acid (16:0) (D) palmitoleic acid (16:1) (E) stearic acid (18:0) (F) oleic acid (18:1) (G), and linoleic acid (18:1) (H) in OVCAR5 cells treated with DMSO or NTX-301(100nM, 2days). (I) Representative hSRS images of DMSO- and NTX-301 (100nM, 2days)-treated OVCAR5 cells show lipid droplets (LD) phasor maps. Scale bars: 20 μm. (J) Average hSRS LD spectra of samples described in (I) and normalized to 2900 cm−1. (K) hSRS peak ratio at 3002 cm−1 to 2900 cm−1. Each data point represents one field of view on a plate. Bars indicate means ± SD. (L) Cell survival curves (left) and quantification of IC50 (right) of OVCAR5 transfected with shctrl or shSCD vectors in response to NTX-301 treatment. (M) Representative histograms and (N) mean (± SD, n = 3) fluorescence intensity of BODIPY 581/591-C11 in OVCAR5 OC cells treated for 2 days with DMSO, NTX-301 (500nM), DFOA (800nM) and NTX-301 plus DFOA. (O) Representative histograms and (P) mean (± SD, n = 3) fluorescence intensities (right) of BODIPY 581/591-C11 show effects of oleic acid (200μM, 2days) on rescuing lipid peroxidation levels in OVCAR5 cells treated with DMSO or NTX-301 (100nM, 2days, n=3). For all comparisons, *p<0.05, **p<0.01, ***p<0.001, ***p<0.0001.
Figure 5.
Figure 5.. Inhibitory effects of NTX-301 on SCD in OC cells.
(A) UCSC Genome Browser on Human GRCh38/hg38 tracks of H3K27Ac peaks in the SCD promoter in OVCAR5 cells (33) and other cell lines previously recorded in the ENCODE dataset (GM12878, and HEK293T) (34, 35). The H3K27Ac binding motif along with the position of primer sequences (Primer_2) used for q-PCR are shown. Amplification of a sequence 1 kb downstream was used as a control (Primer_1). (B) ChIP-PCR shows H3K27Ac enrichment in the SCD gene (Primer_2) in OVCAR5 cells treated with DMSO or NTX-301 (100nM, 2days, n=3). Enrichment of H3K27Ac on a sequence 1 kb downstream was used as a control (Primer_1). Results are means ± SD, which was analyzed by two-way ANOVA with multiple comparisons. For all comparisons, *p<0.05; **p<0.01; ***p<0.001. (C) Western blot of H3K27Ac and H3 in OVCAR5 OC cells treated with DMSO or NTX-301 for 2 days. (D, E) mRNA expression levels (mean fold-change ± SD) of SIRT1 measured by qRT-PCR (D) and western blot of SIRT1 and beta actin (loading control) (E) in OVCAR5 cells treated with DMSO or NTX-301 for 2 days (n=3 replicates). (F) DNA methylation levels for 3 significantly demethylated CpG sites (p-adj< 0.05) in the SIRT1 gene as measured with an Illumina EPIC array in OVCAR5 cells treated with DMSO or NTX-301 (100nM, 3 days; n = 3 replicates per group).
Figure 6.
Figure 6.. NTX-301 inhibits OC tumor growth by targeting lipid metabolism.
(A-C) Images of harvested SQ xenografts (A) and means ± SD of tumor volumes (B) and tumor weights (C) from mice treated with diluent or NTX-301. (D, E) Representative histograms (D) and mean (± SD, n = 5) fluorescence intensity of BODIPY 581/591-C11 (E) in cells obtained from OVCAR5 xenografts in the experiment described in (A). (F) Protein levels of DNMT1 and GAPDH (loading control) measured by western blotting in xenograft tumors (n = 3 per group) from the experiment described in (A). (G) mRNA expression levels of SCD in xenograft tumors collected from indicated groups and measured by qRT-PCR (n = 3 per group). (H) Representative hSRS images of xenograft sections from mice treated with diluent or NTX-301 (1mg/ml), and corresponding lipid droplets phasor maps. Scale bars: 20 μm. (I) Average hSRS spectra of sections of xenografts from mice treated with diluent or NTX-301 (1mg/ml), and normalized to 2900 cm−1. (J) Box-scatter plot of the ratio of hSRS peaks at 3002 cm−1 and 2900 cm−1. Each data point represents one field of view in a tissue section, bars indicate means ± SD, p=0.04. *p<0.05; **p<0.01; ***p<0.001.

Similar articles

Cited by

References

    1. Jones PA, and Baylin SB. The epigenomics of cancer. Cell. 2007;128(4):683–92. - PMC - PubMed
    1. Kantarjian H, Issa JP, Rosenfeld CS, Bennett JM, Albitar M, DiPersio J, et al. Decitabine improves patient outcomes in myelodysplastic syndromes: results of a phase III randomized study. Cancer. 2006;106(8):1794–803. - PubMed
    1. Matei D, and Nephew KP. Epigenetic Attire in Ovarian Cancer: The Emperor’s New Clothes. Cancer Res. 2020;80(18):3775–85. - PMC - PubMed
    1. Oza AM, Matulonis UA, Alvarez Secord A, Nemunaitis J, Roman LD, Blagden SP, et al. A Randomized Phase II Trial of Epigenetic Priming with Guadecitabine and Carboplatin in Platinum-resistant, Recurrent Ovarian Cancer. Clin Cancer Res. 2020;26(5):1009–16. - PMC - PubMed
    1. Fang F, Munck J, Tang J, Taverna P, Wang Y, Miller DF, et al. The novel, small-molecule DNA methylation inhibitor SGI-110 as an ovarian cancer chemosensitizer. Clin Cancer Res. 2014;20(24):6504–16. - PMC - PubMed

Publication types