. 2024 Jan 17;19(1):e0286742.
doi: 10.1371/journal.pone.0286742. eCollection 2024.

Rhesus monkeys learn to control a directional-key inspired brain machine interface via bio-feedback

Affiliations

Rhesus monkeys learn to control a directional-key inspired brain machine interface via bio-feedback

Chenguang Zhang et al. PLoS One. .

Abstract

Brain machine interfaces (BMI) connect brains directly to the outside world, bypassing natural neural systems and actuators. Neuronal-activity-to-motion transformation algorithms allow applications such as control of prosthetics or computer cursors. These algorithms lie within a spectrum between bio-mimetic control and bio-feedback control. The bio-mimetic approach relies on increasingly complex algorithms to decode neural activity by mimicking the natural neural system and actuator relationship while focusing on machine learning: the supervised fitting of decoder parameters. On the other hand, the bio-feedback approach uses simple algorithms and relies primarily on user learning, which may take some time, but can facilitate control of novel, non-biological appendages. An increasing amount of work has focused on the arguably more successful bio-mimetic approach. However, as chronic recordings have become more accessible and utilization of novel appendages such as computer cursors have become more universal, users can more easily spend time learning in a bio-feedback control paradigm. We believe a simple approach which leverages user learning and few assumptions will provide users with good control ability. To test the feasibility of this idea, we implemented a simple firing-rate-to-motion correspondence rule, assigned groups of neurons to virtual "directional keys" for control of a 2D cursor. Though not strictly required, to facilitate initial control, we selected neurons with similar preferred directions for each group. The groups of neurons were kept the same across multiple recording sessions to allow learning. Two Rhesus monkeys used this BMI to perform a center-out cursor movement task. After about a week of training, monkeys performed the task better and neuronal signal patterns changed on a group basis, indicating learning. While our experiments did not compare this bio-feedback BMI to bio-mimetic BMIs, the results demonstrate the feasibility of our control paradigm and paves the way for further research in multi-dimensional bio-feedback BMIs.


Conflict of interest statement

The authors have declared that no competing interests exist.

Figures

Fig 1
Fig 1. Bio-feedback BMI paradigm, array implantation, and neuronal signals.
a. Schematic illustration of groups. The summed and normalized firing rate of each group of 4 neurons provides an action value. Four action values correspond to four opposing directions in two dimensions of cursor speed. b. Grouping neurons by preferred direction. We divide the 2D space of linear velocity encoding model coefficients (b1, b2 in Eq 4) into four quadrants, corresponding to each direction. We select neurons based on their preferred directions, encoding strength, and signal stability. Inset shows the same data plotted on a larger range so that all recorded neurons are visible. c. We implanted Utah microelectrode arrays into primary motor cortex hand representational area. Photo shows surgery for Monkey T. A: anterior, L: lateral. d. Sample spike waveforms 44 days after implantation for Monkey T. Waveforms of different colors indicate different units (for visualization only, we did not sort units for group weight control), and waveform thickness represents plus and minus one-half standard deviation. Panels are placed according to positions on the Utah array (wire bundle at bottom). Color shading per channel indicates group assignment. e. Experimental task. The monkey sat before a screen displaying the brain-controlled cursor (green dot) and task target (white ring) and uses brain activity to control the cursor. After moving the cursor into the target, the monkey receives a water reward.
Fig 2
Fig 2. Monkey task performance.
a. Trial count and trial success rate. X-axis indicates the session index (two sessions per day), and y-axis indicates the trial count (total: brown, successful: yellow) and trial success rate (black dots). Success rate data were fitted with a logistic function (black curve). Success rate was always greater than shuffled baseline (grey line). The number of successful trials and the success rate for both monkeys significantly increased with session, indicating that both monkeys could learn the group weight control paradigm. b. Success rate changes for each direction. The task of Monkey T had four possible targets; thus, we separate trials according to target. The success rate for each target increased through learning, with up and left learned early in training, whereas right and down were learned later. The task of Monkey K is not categorical, so here we divide target angles into four angular bins. Monkey K’s success rates of different directions also increase at different times in the training period.
Fig 3
Fig 3. Cursor trajectories clustered through time.
We plot Monkey T’s cursor trajectories from all trials (unit: cm, screen space), with sessions separated into 4 stages and trials separated by target direction. We mark targets with grey shading. In early sessions, the cursor covered similar areas for all four directions. Through learning, trajectories become more compact (e.g. up) and occupy areas not visited in early sessions (e.g. right, down). Note that up trajectories become more consistent early in the sessions, while right trajectories become better only in late sessions.
Fig 4
Fig 4. Trajectory scores decrease during learning.
We separate trials according to target direction for Monkey T and according to the vector direction from cursor initial position to target center for Monkey K. The trajectory score is calculated by dividing trajectory length by the distance from cursor initial position to target center (smaller is straighter). Black lines indicate linear fits. We observed significant decreasing trends (*p < 0.05, * * p < 0.001), except for the left target for Monkey T and the downwards target for Monkey K.
Fig 5
Fig 5. Output-null value distribution change little.
a. Output-potent and output-null space illustration. In our control paradigm, the cursor speed in a dimension is proportional to the difference of two opposing action values (potent), whereas the sum of two opposing action values does not influence cursor speed (null). b. Null-space analysis of neural learning. We averaged the output-null values a1 + a2 across time in each trial, and compare the output-null values from the early sessions versus the late sessions, pooling data from two monkeys and four directions. The null component average of the late sessions was slightly larger than that in the early sessions, (ANOVA, **p < 10−10), this effect mostly comes from monkey T, as there was no difference in monkey K.
Fig 6
Fig 6. Output-potent activity increase significantly.
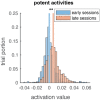
We calculated the output-potent a1a2 value for each monkey and each directions and pool the data. The output-potent distribution for both monkeys changed to more positive from early (blue) to late (red) sessions. Lines indicate distribution mean (horizontal placement). (ANOVA, * * p < 10−10).
Fig 7
Fig 7. Tuning depth and R2 of direct and indirect neurons indicate learning occurred.
a. Tuning depth (Hz) from early learning and late learning periods (first and last 1/4 of sessions) of direct and indirect neurons are shown. No significant difference was found (p = 0.4665, t-test). Note the difference between the direct and indirect groups is due to our neuron inclusion criteria. b. Comparison between early and late learning period shows an increase in tuning R2. The direct neurons R2 ranges from 1 * 10−4 to 0.63 (data pooled between monkeys).
Fig 8
Fig 8. The tuning change of individual neurons.
a. An example neuron with changing preferred direction. x- and y- axes are the 2D space of movements and the z-axis is session. Each disk represents a session. The blue bar on the disk represents the neuron’s preferred direction, and the shaded area on the disk represents the neuron’s assigned direction. It can be seen that the preferred direction changes towards the assigned direction. b. Changes in direct neurons’ PD over time. The PD of direct neurons in early and late learning periods are compared. Data from two monkeys and all four directions are pooled together. We calculate the normalized |PDAD|, which represents the directional difference between the neurons’ PD and their assigned direction (AD). It is 1 for opposite directions and 0 for the same direction. When comparing early and late learning stages, this value becomes smaller, indicating that the tuning is shifting towards the assigned direction.

References

    1. Fetz EE. Operant Conditioning of Cortical Unit Activity. Science. 1969;163(3870):955–958. doi: 10.1126/science.163.3870.955 - DOI - PubMed
    1. Velliste M, Perel S, Spalding MC, Whitford AS, Schwartz AB. Cortical control of a prosthetic arm for self-feeding. Nature. 2008;453(7198):1098–1101. doi: 10.1038/nature06996 - DOI - PubMed
    1. Hochberg LR, Bacher D, Jarosiewicz B, Masse NY, Simeral JD, Vogel J, et al. Reach and grasp by people with tetraplegia using a neurally controlled robotic arm. Nature. 2012;485(7398):372–375. doi: 10.1038/nature11076 - DOI - PMC - PubMed
    1. Balasubramanian K, Southerland J, Vaidya M, Qian K, Eleryan A, Fagg AH, et al. Operant conditioning of a multiple degree-of-freedom brain-machine interface in a primate model of amputation. In: 2013 35th Annual International Conference of the IEEE Engineering in Medicine and Biology Society (EMBC); 2013. p. 303–306. - PubMed
    1. Serruya MD, Hatsopoulos NG, Paninski L, Fellows MR, Donoghue JP. Instant neural control of a movement signal. Nature. 2002;416(6877):141–142. doi: 10.1038/416141a - DOI - PubMed