. 2024 Jan 17;16(730):eadi9711.
doi: 10.1126/scitranslmed.adi9711. Epub 2024 Jan 17.

Commensal antimicrobial resistance mediates microbiome resilience to antibiotic disruption

Affiliations

Commensal antimicrobial resistance mediates microbiome resilience to antibiotic disruption

Shakti K Bhattarai et al. Sci Transl Med. .

Abstract

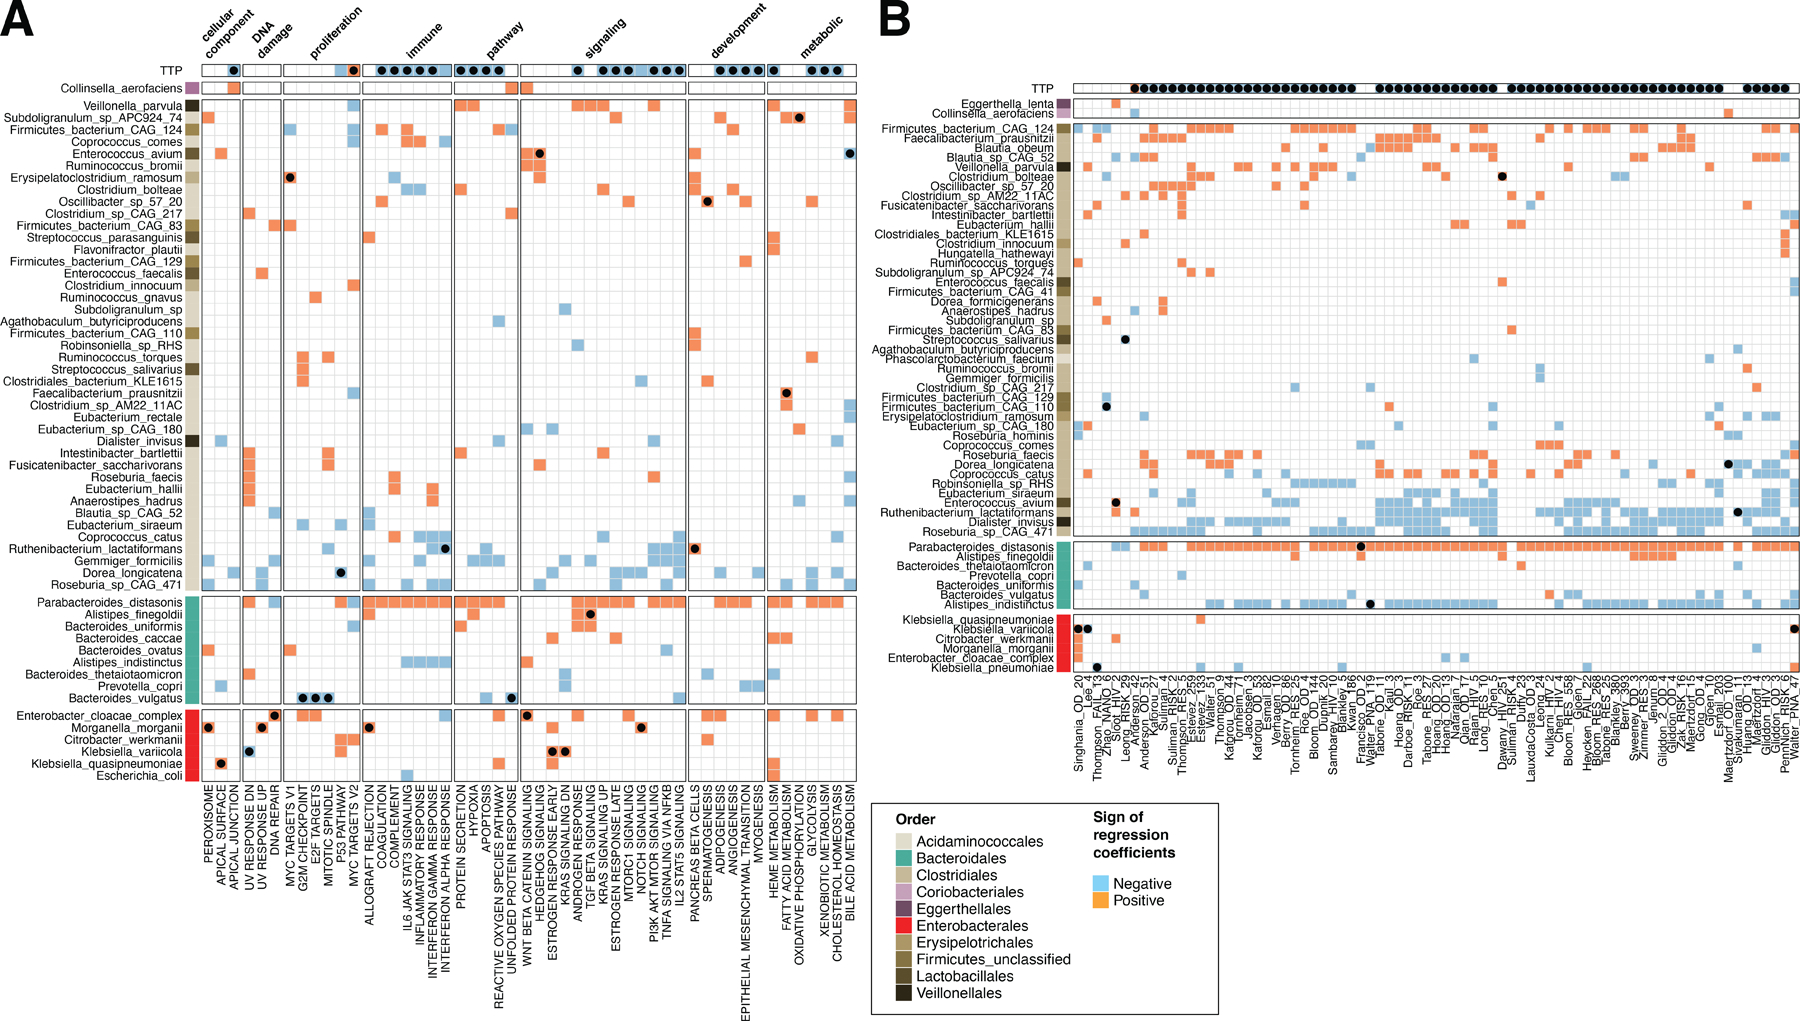
Despite their therapeutic benefits, antibiotics exert collateral damage on the microbiome and promote antimicrobial resistance. However, the mechanisms governing microbiome recovery from antibiotics are poorly understood. Treatment of Mycobacterium tuberculosis, the world's most common infection, represents the longest antimicrobial exposure in humans. Here, we investigate gut microbiome dynamics over 20 months of multidrug-resistant tuberculosis (TB) and 6 months of drug-sensitive TB treatment in humans. We find that gut microbiome dynamics and TB clearance are shared predictive cofactors of the resolution of TB-driven inflammation. The initial severe taxonomic and functional microbiome disruption, pathobiont domination, and enhancement of antibiotic resistance that initially accompanied long-term antibiotics were countered by later recovery of commensals. This resilience was driven by the competing evolution of antimicrobial resistance mutations in pathobionts and commensals, with commensal strains with resistance mutations reestablishing dominance. Fecal-microbiota transplantation of the antibiotic-resistant commensal microbiome in mice recapitulated resistance to further antibiotic disruption. These findings demonstrate that antimicrobial resistance mutations in commensals can have paradoxically beneficial effects by promoting microbiome resilience to antimicrobials and identify microbiome dynamics as a predictor of disease resolution in antibiotic therapy of a chronic infection.


Figures

Fig. 1.
Fig. 1.. MDR TB treatment induces Mtb lung sterilization and causes a temporary perturbation in the microbiome, which recovers by treatment cessation.
A. Schematic of the MDR TB treatment observational cohort. B. Time to positivity (TTP) was measured at baseline (day 0), 2 weeks, 1 month, 2 months, 6 months during treatment, and at treatment cessation (TC) (20–24 months). C to D. Principal Coordinate Analysis on center-log-ratio transformed data for species abundances (C) and functional pathway abundance (D) from metagenomic sequencing. E. Microbiome diversity was computed for each study volunteer at the different time points and quantified using the inverse Simpson index(97). Linear regression modeling (inset) was used to predict fold-change in diversity occurring between 6 months and treatment completion as a function of time from antibiotic cessation. F. Taxonomic abundance of the microbiome during MDR treatment. The annotations to the right of the bacterial names indicate whether a species was significantly perturbed (FDR < 0.05) by treatment at any time point compared to baseline (Day 0) with red indicating enrichment and blue indicating depression in abundance. Grey indicates not significant. Heatmap columns are split by time point membership (including baseline), and rows by phylogenetic order.
Fig. 2.
Fig. 2.. Resolution of TB disease state as a function of microbiome perturbation and pathogen killing.
Mixed-effects Random Forest Regression Modeling was run to predict the normalized enrichment score (NES) of A. MSigDB hallmark pathways or B. TB-associated gene signatures. Permutated importance analysis was used to identify features (both microbiome species and TTP) significantly associated (FDR < 0.1) with each modeled peripheral transcriptional signature. We then used univariate linear mixed-effects models to determine directionality of the associations; blue indicates a negative relationship, and red a positive one. The black dot indicates the strongest predictor for that specific hallmark pathway or TB-associated gene signature.
Fig. 3.
Fig. 3.. MDR TB therapy enriches antimicrobial resistance across drug classes.
A database of antibiotic resistance gene (ARGs) marker sequences from the 2021 CARD database was built using ShortBRED. Shotgun metagenomic data were mapped against this marker database and profiled for the abundance of ARGs. Linear mixed-effects modeling was run to determine whether ARGs were significantly enriched or depressed at treatment points compared to baseline (day 0). A. Heatmap of treatment-affected ARGs. Row annotation represents the value of the regression coefficient. Red = significantly (FDR < 0.05) enriched, blue = significantly (FDR < 0.05) repressed, and grey = not significantly different (FDR > 0.05). The heatmap represents ARGs abundance in each sample quantified as logarithm of the Reads Per Kilobase per Million (Log(RPKM+1)) mapped reads for each ARG. B. Quantification of the total number of ARGs enriched or repressed compared to baseline. C. Pie charts representing the frequency of resistance class for the ARGs significantly affected by MDR TB treatment at different time points.
Fig. 4.
Fig. 4.. Microbiome resilience corresponds to the emergence of antimicrobial resistance in commensals.
(A-D) Allelic composition of B. wexlerae A and D. longicatena B core genomes (with respect to the reference) in treatment cessation and baseline samples. A. and B. SNPs diversity distribution (SNPs/kilobase compared to reference for B. wexlerae A and D. longicatena B. C. and D. Ordination analysis of core genome allele frequencies. E. and F. Random Forest Classification Modeling. For every genetic feature, the distribution of the minor allele DNA nucleotide for each SNP is shown. The numeric value next to gene name is the SNP position in the reference genome (Site ID). Asterisk indicates genes that are known to be related to the mechanism of action or resistance to drugs contained in the MDR TB treatment cocktail. The MIDAS-reported ATP synthase indicates the eubacterial F-type ATP synthase, whereas the MIDAS-reported V-type ATP synthase refers to the eubacterial V/A ATPase. G. Bedaquiline and clofazimine are active against anaerobic commensals in vitro. The axis shows optical density of liquid cultures at different drug concentrations on the X axis. H. Quantitation of bedaquiline, desmethyl bedaquiline (D.BDQ), clofazimine, levofloxacin, and linezolid from stool samples at 6 months of treatment with drug concentration given on a log scale in ug/ml. I to J. The abundance of (I) P. succinatutens and (J) G. formicilis during HRZE therapy showing depletion and recovery as median +/− mean absolute deviation. K and L. Random Forest Classification on MIDAS data identifies SNPs in the Phascolarctobacterium (K) or Gemminger (L) RNA polymerase beta subunit, the direct molecular target of rifampin (R), as the strongest predictor of treatment time. M. and N. Amino acid sequence alignments for baseline and 6-month HRZE samples highlighting mutations S450Y and H445N detected in treatment completion (post) vs. pretreatment samples. The Phascolarctobacterium (M) or Gemminger (N) reference RpoB sequences are displayed above the alignment. The M. tuberculosis RpoB sequence is shown below. Mutation positions are marked with **.
Fig. 5:
Fig. 5:. Evolution of widespread commensal resistance under antibiotic pressure.
Mutations detected by inStrain in the microbiomes of MDR-treated subjects, including in ATP synthase subunit epsilon (A), glpK, (B), atpE (C), and gyrA (E). For each panel, the amino acid positions in the M. tuberculosis protein were determined by inStrain where red shading indicates a position of resistance mutations in M. tuberculosis according to (75). D. M. tuberculosis C subunit (atpE) was modeled by AlphaFold from Uniprot ID P9WPS1 in green. Positions of mutations in atpE associated with bedaquiline resistance were taken from(98) and are shown with amino acid side chains in light green (wild type AA). The S. salivarius (blue, Uniprot ID A0A413AC39) and Prevotella (red, Uniprot ID A0A3C1E6Z4) atpE encoded proteins were predicted using AlphaFold and the positions of the inStrain detected mutations are shown in lighter color than the backbone helix with side chains of the wild type AA shown. The three structures were aligned using the Matchmaker function of ChimeraX. F. Structural modeling of gyrA mutations uses M. tuberculosis GyrA (green, PDB 3IFZ), Ruminococcus E GyrA (Blue, AlphaFold prediction from Uniprot ID A0A7J5TQ36), Bifidobacterium bifidum (red, AlphaFold prediction from Uniprot ID A0A7J5TQ36), and Lachnospira eligens (yellow, AlphaFold prediction from Uniprot ID A0A415M9D7). Only the alignment from AA H85-P108 of Mtb GyrA is shown with the positions of Mtb GyrA A90 and detected mutation positions shown with side chains. G. Widespread RpoB mutations in the microbiomes of subjects treated with standard TB therapy (HRZE).
Fig. 6.
Fig. 6.. MDR TB treatment completion microbiome is desensitized to bedaquiline rechallenge.
A. We performed adoptive microbiome transfer experiments wherein AVNM-pre-treated mice were orally gavaged with a fecal matter transplant (FMT) from MDR TB treatment completion (TC) individuals or healthy community contact controls (HC), before receiving 7 consecutive days of bedaquiline or vehicle via oral gavage. Biologic replicate numbers are shown. B. Principal Component Analysis performed on the Bray-Curtis distance among samples. Samples are colored based on FMT, with shapes corresponding to different treatment days. C-E. We tested the hypothesis that the distance in microbiome composition between AVNM-treated mice receiving a fecal matter transplant (FMT) from MDR TB treatment completion (TC) individuals and challenged with 7 days of bedaquiline or vehicle is smaller than the distance in mice that received FMT from healthy community controls and administered with bedaquiline or vehicle. Linear-mixed effects modeling to predict the Bray-Curtis distance as a function of time since bedaquiline initiation, FMT type (HC/TC), antibiotic type (bedaquiline/vehicle) alone as well as their interaction was fit to the distances between C. every vehicle sample to every other vehicle sample, D. every bedaquiline sample to every other vehicle bedaquiline samples, and E. every vehicle sample to every bedaquiline sample.

References

    1. Langdon A, Crook N, Dantas G. The effects of antibiotics on the microbiome throughout development and alternative approaches for therapeutic modulation. Genome Med. 2016;8(1):39. Epub 2016/04/15. doi: 10.1186/s13073-016-0294-z. - DOI - PMC - PubMed
    1. Reyman M, van Houten MA, Watson RL, Chu MLJN, Arp K, de Waal WJ, Schiering I, Plötz FB, Willems RJL, van Schaik W, Sanders EAM, Bogaert D. Effects of early-life antibiotics on the developing infant gut microbiome and resistome: a randomized trial. Nature Communications. 2022;13(1):893. doi: 10.1038/s41467-022-28525-z. - DOI - PMC - PubMed
    1. Fishbein SRS, Mahmud B, Dantas G. Antibiotic perturbations to the gut microbiome. Nature Reviews Microbiology. 2023. doi: 10.1038/s41579-023-00933-y. - DOI - PubMed
    1. Becattini S, Taur Y, Pamer EG. Antibiotic-Induced Changes in the Intestinal Microbiota and Disease. Trends Mol Med. 2016;22(6):458–78. Epub 2016/05/15. doi: 10.1016/j.molmed.2016.04.003. - DOI - PMC - PubMed
    1. Dethlefsen L, Huse S, Sogin ML, Relman DA. The pervasive effects of an antibiotic on the human gut microbiota, as revealed by deep 16S rRNA sequencing. PLoS Biol. 2008;6(11):e280. Epub 2008/11/21. doi: 10.1371/journal.pbio.0060280. - DOI - PMC - PubMed

Publication types

Substances