. 2024 Jan 19;10(3):eadh5520.
doi: 10.1126/sciadv.adh5520. Epub 2024 Jan 17.

Type 1 immunity enables neonatal thymic ILC1 production

Affiliations

Type 1 immunity enables neonatal thymic ILC1 production

Peter Tougaard et al. Sci Adv. .

Abstract

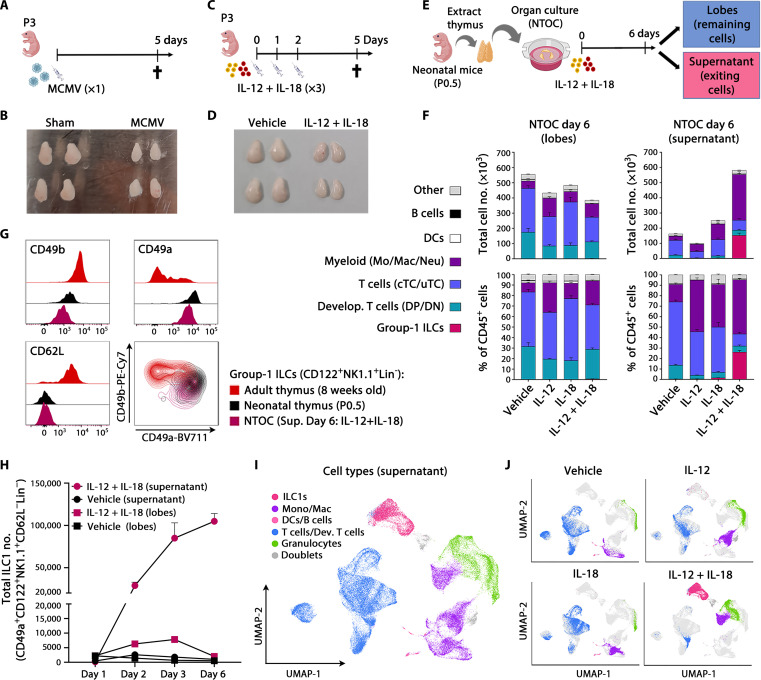
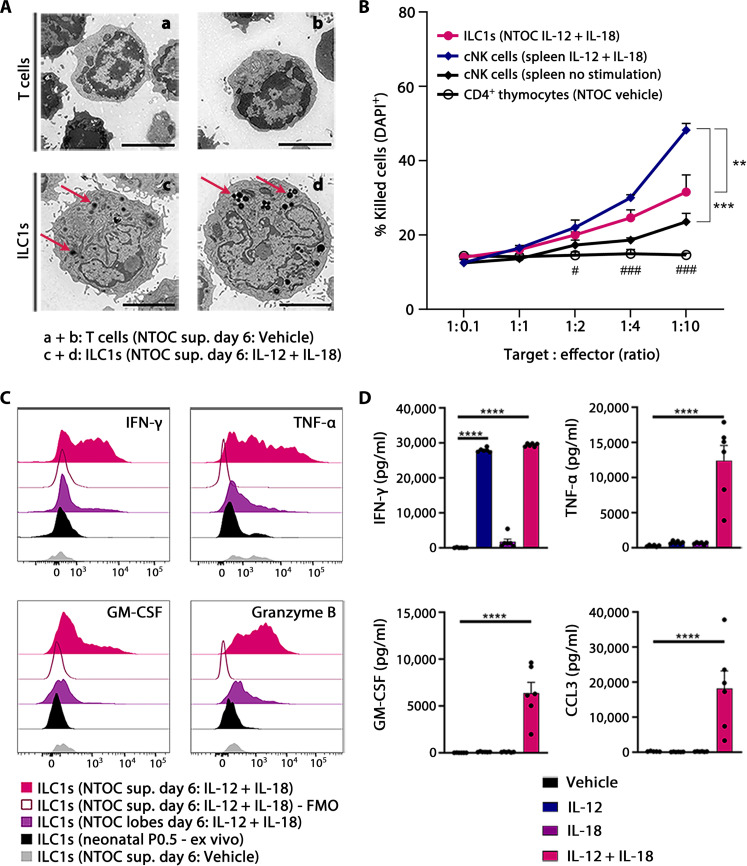
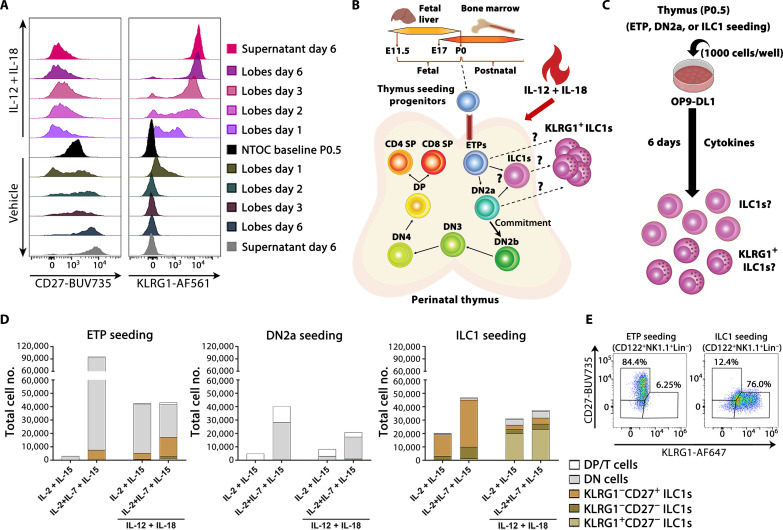
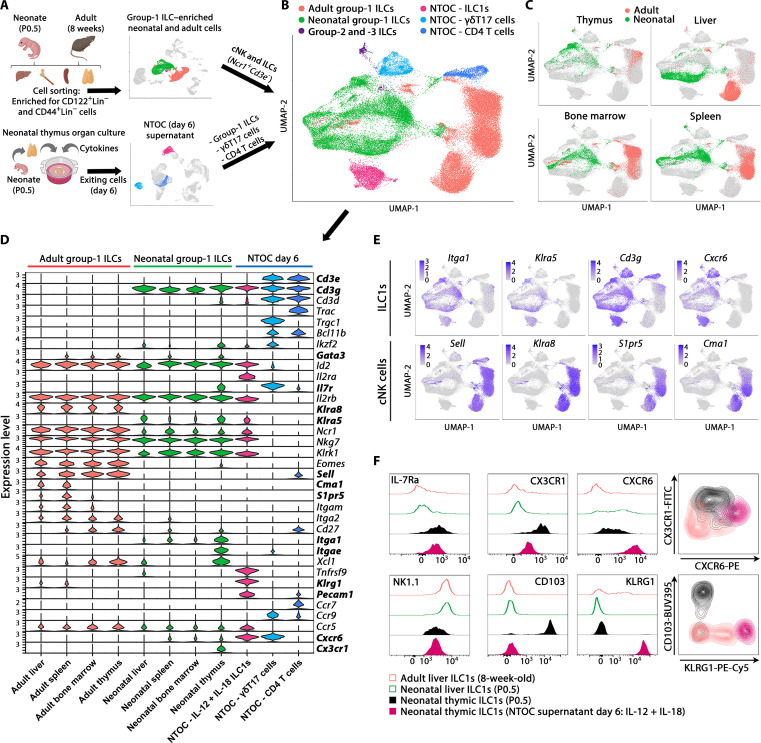
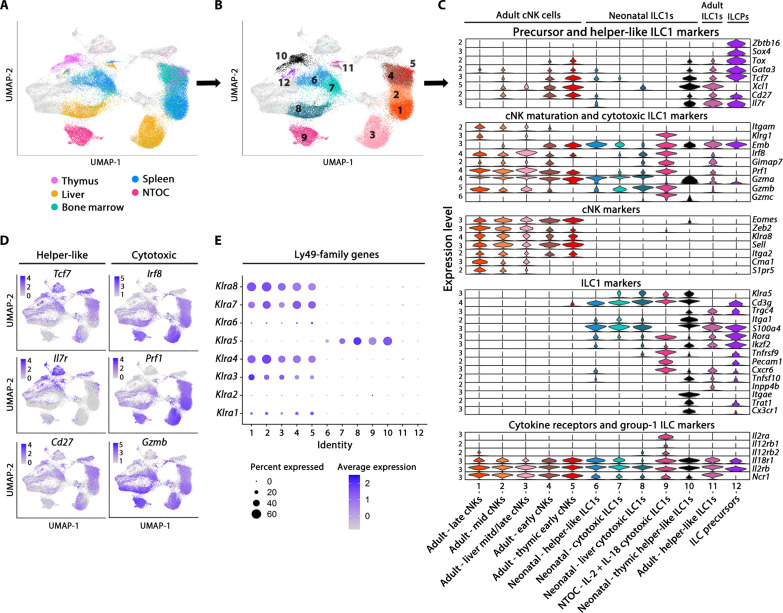
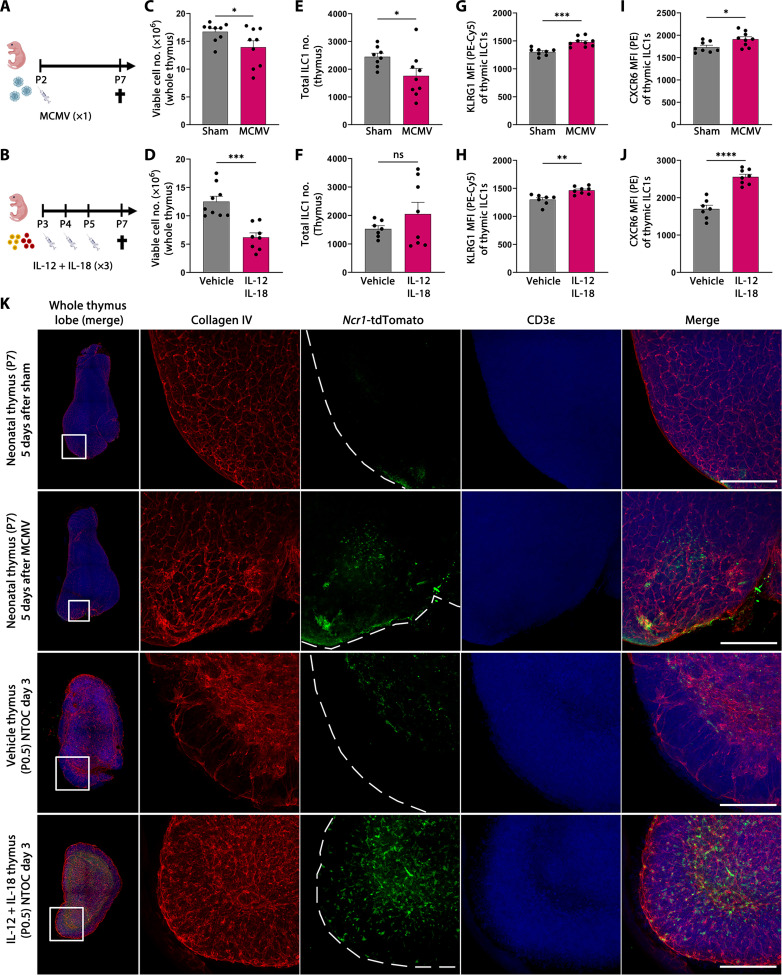
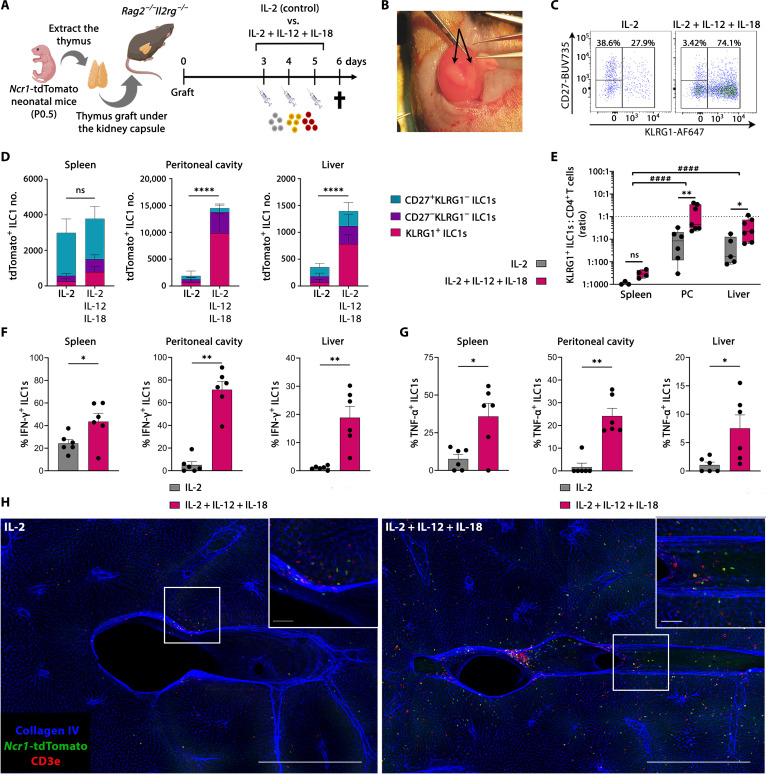
Acute thymic atrophy occurs following type 1 inflammatory conditions such as viral infection and sepsis, resulting in cell death and disruption of T cell development. However, the impact type 1 immunity has on thymic-resident innate lymphoid cells (ILCs) remains unclear. Single-cell RNA sequencing revealed neonatal thymic-resident type 1 ILCs (ILC1s) as a unique and immature subset compared to ILC1s in other primary lymphoid organs. Culturing murine neonatal thymic lobes with the type 1 cytokines interleukin-12 (IL-12) and IL-18 resulted in a rapid expansion and thymic egress of KLRG1+CXCR6+ cytotoxic ILC1s. Live imaging showed the subcapsular thymic localization and exit of ILC1s following IL-12 + IL-18 stimulation. Similarly, murine cytomegalovirus infection in neonates resulted in thymic atrophy and subcapsular localization of thymic-resident ILC1s. Neonatal thymic grafting revealed that type 1 inflammation enhances the homing of cytokine-producing thymus-derived ILC1s to the liver and peritoneal cavity. Together, we show that type 1 immunity promotes the expansion and peripheral homing of thymic-derived ILC1s.


Figures

Fig. 1.
Fig. 1.. Type 1 inflammation induces expansion of thymus-exiting ILC1s during NTOC.
(A) Schematic of MCMV infections in neonates. (B) Picture of thymic lobes 5 days after infection with MCMV or sham, representative of five independent experiments, as shown in (A). (C) Schematic of IL-12 + IL-18 injections in neonates. (D) Picture of thymic lobes 5 days after the first injection with IL-12 + IL-18 or vehicle, representative of four independent experiments, as shown in (C). (E) Schematic of NTOC strategy for cellular analysis; dividing each well into lobes and supernatant. (F) Stacked bar plots of NTOC performed as illustrated in (E), showing the total number (top) and percentage (bottom) of CD45+ cell types in thymic lobes (left) and supernatant (right) (gating shown in fig. S1C). Data are representative of five independent experiments and shown for n = 3 biological replicates per condition with error bars displaying SEM. DCs, dendritic cells; DN, double negative; DP, double positive; cTC, conventional T cells; uTC, unconventional T cells; Mo, monocytes; Mac, macrophages; Neu, neutrophils. (G) Flow cytometry comparison of ILC1 and cNK markers on group-1 ILCs (CD122+NK1.1+Lin) from the thymus in adults (8 weeks old), neonates (P0.5), and IL-12 + IL-18–stimulated NTOC supernatant (day 6). Histograms and density plots are representative of n = 6 biological replicates from two independent experiments. (H) Kinetic analysis of ILC1 expansion in NTOC (lobes and supernatant) as shown in (E). Data are representative of three independent experiments and shown for n = 3 biological replicates per condition. The y axis is divided into two different segments. Error bars display mean with SEM. (I) Uniform Manifold Approximation and Projection (UMAP) plot of scRNA-seq data on day 6 NTOC supernatant cells as shown in (E), from four conditions: (i) vehicle, (ii) IL-18, (iii) IL-12, and (iv) IL-12 + IL-18. The major cell types are divided by color. (J) Split UMAPs of the four conditions as in (I); Lin, Lineage negative, defined as TCRβTCRγδCD3eCD4CD8βTer-119Ly-6GCD19CD11cF4/80.
Fig. 2.
Fig. 2.. NTOC-derived ILC1s are cytokine-producing and have cytotoxic functionality.
(A) Transmission electron microscopy pictures of sorted NTOC-derived CD4 T cells (a + b; vehicle supernatant) or ILC1s (c + d; IL-12 + IL-18 supernatant); representative cells are shown from two independent experiments. Red arrows in ILC1 pictures indicate black organelles identified as dense cytotoxic–like granules. Scale bars, 2 μm. (B) YAC-1 killing assay, showing dose-dependent killing of YAC-1 target cells following increasing cell numbers of four different types of sorted effector cells: (i) ILC1s (NTOC IL-12 + IL-18), (ii) cNK cells (adult spleen IL-12 + IL-18), (iii) cNK cells (adult spleen), and (iv) noncytotoxic CD4+ thymocytes (NTOC vehicle). Killing was shown as 4′,6-diamidino-2-phenylindole–positive (DAPI+) YAC-1 cells after 4 hours of coculture. Data are pooled from three independent experiments showing n = 4 to 6 biological replicates per condition. Error bars display mean with SEM. (C) Histograms of intracellular flow cytometry, visualizing active expression of IFN-γ, TNF-α, GM-CSF, and Granzyme B in different NTOC-derived ILC1s compared to ex vivo P0.5 ILC1s. Expression is shown 4 hours after brefeldin A and monensin block and no further stimulation. Histograms are representative of n = 6 to 9 biological replicates per condition from two to three independent experiments. FMO, fluorescence minus one. (D) Bar plot of protein measurements of cytokines in the supernatant after 6 days of NTOC, measured by multiplex enzyme-linked immunosorbent assay. Data are pooled from three independent experiments showing n = 6 biological replicates per condition. Each dot represents a replicate, and error bars show mean with SEM. Statistical significance was calculated by (B) one-way analysis of variance (ANOVA) between cell types; (D) one-way ANOVA (TNF-α and CCL3). Nonparametric Kruskal-Wallis test (IFN-γ and GM-CSF). **P < 0.01, ***P < 0.001, and ****P < 0.0001. (B) One-way ANOVA between NTOC-derived ILC1 and noncytotoxic CD4+ thymocytes: #P < 0.05 and ###P < 0.001.
Fig. 3.
Fig. 3.. KLRG1+ ILC1s differentiate and expand from immature thymic ILC1s.
(A) Flow cytometry comparison of neonatal thymic ILC1 expression of the maturation markers CD27 and KLRG1 inside the lobes during NTOC, from baseline (P0.5) and days 1, 2, 3, and 6 compared with day 6 in the supernatant. Histograms are representative of n = 9 biological replicates per condition from three independent experiments. (B) Schematic of thymic development, with T cell commitment at the DN2b stage, visualizing hypothesized precursors for the KLRG1+ ILC1s. (C) Schematic of OP9-DL1 organ culture setup to test the hypothesis illustrated in (B), where 1000 cell-sorted progenitor cells were added to each 96-well on top of OP9-DL1 cells to determine whether the rapidly expanded KLRG1+ ILC1s derived from neonatal (P0.5) ETPs or immature ILC1s. DL1 notch ligand–expressing OP9 cells were used to simulate T cell promoting thymic environment to make sure T cell development remained possible. (D) Stacked bar plots showing developing T cells or ILC1s based on their expression of KLRG1 and CD27 following 6 days of OP9-DL1 coculture for ETPs [CD117hiCD44+CD25CD122Lin], DN2a [CD117hiCD44+CD25+CD122Lin], or ILC1s (CD122+Lin) from the neonatal thymus, stimulated with IL-2, IL-7, and IL-15 with or without IL-12 + IL-18. Populations are defined as follows: DP/T cells (CD3e+/CD4+/CD8b+), DN (CD122Lin), and ILC1s (CD122+NK1.1+Lin). The y axes are divided into two segments. Results are shown as the mean of two replicates and representative of n = 4 to 6 biological replicates per condition from two to three independent experiments. (E) Gating on KLRG1 and CD27 expression in CD122+NK1.1+Lin-gated ILC1s as shown in (D) following 6 days of culture with IL-12 + IL-18 + (IL-2 + IL-7 + IL-15) under ETP and ILC1-seeded conditions. SP, single positive.
Fig. 4.
Fig. 4.. Thymic ILC1s shift expression from CX3CR1 to CXCR6 upon IL-12 + IL-18 stimulation.
(A) Schematic of scRNA-seq strategy to extract the liver, bone marrow, spleen, and thymus from P0.5 neonates and 8-week-old adult mice. Group-1 ILC cell enrichment was performed, and CD122+Lin cells and CD44+Lin cells were sorted for the enrichment of group-1 ILCs (ILC1s and cNK cells) and progenitor cells from each organ. The resulting eight scRNA-seq datasets were combined, and from these, the clusters primarily containing ILC1s and cNK cells (identified by Ncr1+Cd3e expression) were selected for downstream analysis. In addition, three clusters from the scRNA-seq data in Fig. 1 were selected from the combined four conditions of NTOC supernatant for integration with the new single-cell data: (i) ILC1s (IL-12 + IL-18), (ii) γδT17 cells, and (iii) CD4 T cells. The two T cell clusters were chosen as internal controls. (B) UMAP of Harmony-integrated data with the same colors as in (A), showing the six major groupings divided on the basis of sample origin and gene expression in the case of group-2 and group-3 ILCs. (C) UMAP visualization of cells derived from the four tissues green (neonates) and red (adults). (D) Violin plots showing gene expression of curated genes with colors based on (B), showing the group-1 ILCs and the eight different tissues of origin and the three NTOC clusters. (E) Feature plots of ILC1 markers (top row) and cNK cell markers (bottom row). (F) Flow cytometry comparison of ILC1s across tissues (CD122+NK1.1+CD49a+CD62LLin) from adult liver (8 weeks old), neonatal liver and thymus (P0.5), and IL-12 + IL-18–stimulated NTOC supernatant (day 6), displayed as histograms with thymus-derived ILC1s (closed) and liver ILC1s (open) or density plots (gating shown in fig. S4C). Histograms and density plots are representative of n = 6 biological replicates per condition from two independent experiments. FITC, fluorescein isothiocyanate; PE, phycoerythrin.
Fig. 5.
Fig. 5.. Steady-state neonatal thymic ILC1s display a unique and immature phenotype.
(A) Tissue overview showing a UMAP of Harmony-integrated scRNA-seq comparison of group-1 ILCs in 8-week-old adult and P0.5 neonatal mice across tissues from (Fig. 4A), showing an overview of the different tissues (thymus, liver, spleen, and bone marrow) and NTOC clusters. As visualized in (B), only cells from the 12 selected clusters are shown, representing tissue-specific group-1 ILCs and ILC precursors (ILCPs) (neonatal and adult tissues are shown with the same color). (B) UMAP overview of the 12 selected clusters in Harmony-integrated scRNA-seq comparison. (C) Violin plot showing gene expression level of curated cell type and functional genes in selected clusters. Cluster order is based on the similarity in expression of selected genes between clusters. (D) Feature plots showing gene signatures associated with the two ILC1 maturation stages; Helper-like ILC1s (left column) and cytotoxic ILC1s genes (right column). (E) Expression of Ly49 family genes in 12 selected clusters.
Fig. 6.
Fig. 6.. Thymic ILC1s display enhanced CXCR6 and KLRG1 expression following MCMV infection.
(A) Schematic of neonates infected with MCMV or sham for 5 days. (B) Schematic of neonates injected three times with IL-12 + IL-18 or vehicle. (C and D) Thymic cellularity at P7 in (C) MCMV-infected and (D) IL-12 + IL-18–injected neonates. (E and F) Flow cytometry–based ILC1 numbers in the thymus at P7 in (E) MCMV-infected and (F) IL-12 + IL-18–injected neonates (gating shown in fig. S6A). (G and H) Flow cytometry–based mean fluorescence intensity of KLRG1 expression on thymic ILC1s in (G) MCMV-infected and (H) IL-12 + IL-18–injected neonates. (I and J) Flow cytometry–based mean fluorescence intensity of CXCR6 expression on thymic ILC1s in (I) MCMV-infected and (J) IL-12 + IL-18–injected neonates. (C) to (J) Data are shown for n = 8 to 9 (MCMV) and n = 7 to 9 (IL-12 + IL-18) neonates and representative of two independent experiments. Bar graphs indicate individual mice (symbol), and error bars display means with SEM. (K) (Column 1) Confocal 3D imaging of neonatal thymic lobes, showing the whole thymic lobe and the zoomed-in section used in the other four columns. (Columns 2 to 4) Single colors and (columns 1 and 5) merged overlay of all colors are shown as maximum projection intensity: red (collagen IV), green (Ncr1-tdTomato), and blue (CD3). (Rows 1 and 2) Neonatal thymus from sham or MCMV-infected mice. (Rows 3 and 4) Thymic lobes from day 3 vehicle or IL-12 + IL-18–stimulated NTOC. Scale bars, 200 μm. Images are representative of n = 3 to 5 mice or biological replicates per condition from two independent experiments. Statistical significance was calculated by unpaired t test: *P < 0.05, **P < 0.01, ***P < 0.001, and ****P < 0.0001. ns, not significant.
Fig. 7.
Fig. 7.. KLRG1+ thymic ILC1s are homing to the liver and the peritoneal cavity.
(A) Schematic of neonatal Ncr1-tdTomato thymus graft experiments. (B) Picture of a kidney with two recently grafted neonatal thymic lobes (arrows). (C) Representative flow plots of tdTomato+ ILC1s from the peritoneal cavity. (D) Stacked bar plots showing total thymic graft–derived ILC1s divided on the basis of CD27 and KLRG1 expression in the indicated organs [gating shown in (C) and fig. S7A]. Error bars are shown as SEM. (E) Count ratio (log10 scale) between thymus graft–derived KLRG1+ ILC1s and CD4 T cells for determining differential homing in indicated tissues. Data are shown as box-and-whiskers plots displaying median, minimum, and maximum. (C) and (E) Data are pooled from two independent experiments from n = 3 to 4 (spleen), n = 6 to 7 (peritoneal cavity), and n = 5 to 7 (liver) and representative of four independent experiments. (F and G) Intracellular cytokine expression showing the percentage of thymus graft–derived ILC1 population actively expressing (F) IFN-γ or (G) TNF-α in indicated organs (gating shown in fig. S7H). Data are pooled from two independent experiments with n = 6 mice per condition. Error bars are shown as SEM. (E) to (G) Each symbol represents an individual mouse. (H) Confocal 3D imaging of 500-μm-thick liver samples from thymus-grafted mice. Representative pictures are shown as maximum projection intensity. Blue, collagen IV; green, Ncr1-tdTomato; red, CD3e. Scale bars, 500 μm (bottom right corner) and 50 μm (zoomed-in section). Images are representative of n = 3 to 4 from two independent experiments. Statistical significance was calculated by (D) unpaired t test (total cell count), (E) two-way ANOVA between treatments and tissues, [(F) and (G); except spleen IFN-γ] Kruskal-Wallis test, and [(F); spleen IFN-γ] unpaired t test, *P < 0.05, **P < 0.01, and ****P < 0.0001. (E) Two-way ANOVA between tissues, ####P < 0.0001.

Similar articles

Cited by

References

    1. Gherardi M. M., Ramírez J. C., Esteban M., IL-12 and IL-18 act in synergy to clear vaccinia virus infection: Involvement of innate and adaptive components of the immune system. J. Gen. Virol. 84 (Pt. 8), 1961–1972 (2003). - PubMed
    1. Pien G. C., Satoskar A. R., Takeda K., Akira S., Biron C. A., Cutting edge: Selective IL-18 requirements for induction of compartmental IFN-γ responses during viral infection. J. Immunol. 165, 4787–4791 (2000). - PubMed
    1. Vanden Berghe T., Demon D., Bogaert P., Vandendriessche B., Goethals A., Depuydt B., Vuylsteke M., Roelandt R., Van Wonterghem E., Vandenbroecke J., Choi S. M., Meyer E., Krautwald S., Declercq W., Takahashi N., Cauwels A., Vandenabeele P., Simultaneous targeting of IL-1 and IL-18 is required for protection against inflammatory and septic shock. Am. J. Respir. Crit. Care Med. 189, 282–291 (2014). - PubMed
    1. Mera S., Tatulescu D., Cismaru C., Bondor C., Slavcovici A., Zanc V., Carstina D., Oltean M., Multiplex cytokine profiling in patients with sepsis. APMIS. 119, 155–163 (2011). - PubMed
    1. Bourgon N., Fitzgerald W., Aschard H., Magny J. F., Guilleminot T., Stirnemann J., Romero R., Ville Y., Margolis L., Leruez-Ville M., Cytokine profiling of amniotic fluid from congenital cytomegalovirus infection. Viruses 14, 2145 (2022). - PMC - PubMed

Publication types