. 2024 Jan 23;121(4):e2314884121.
doi: 10.1073/pnas.2314884121. Epub 2024 Jan 17.

Quantifying local stiffness and forces in soft biological tissues using droplet optical microcavities

Affiliations

Quantifying local stiffness and forces in soft biological tissues using droplet optical microcavities

Gregor Pirnat et al. Proc Natl Acad Sci U S A. .

Abstract

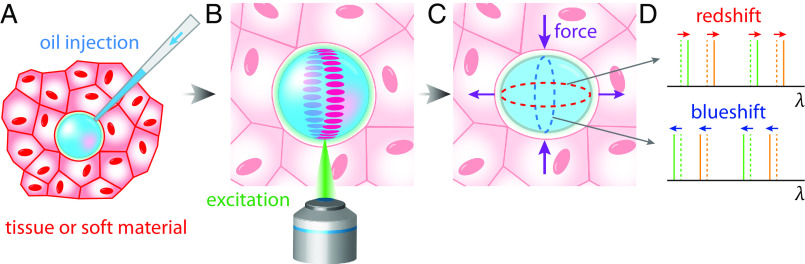
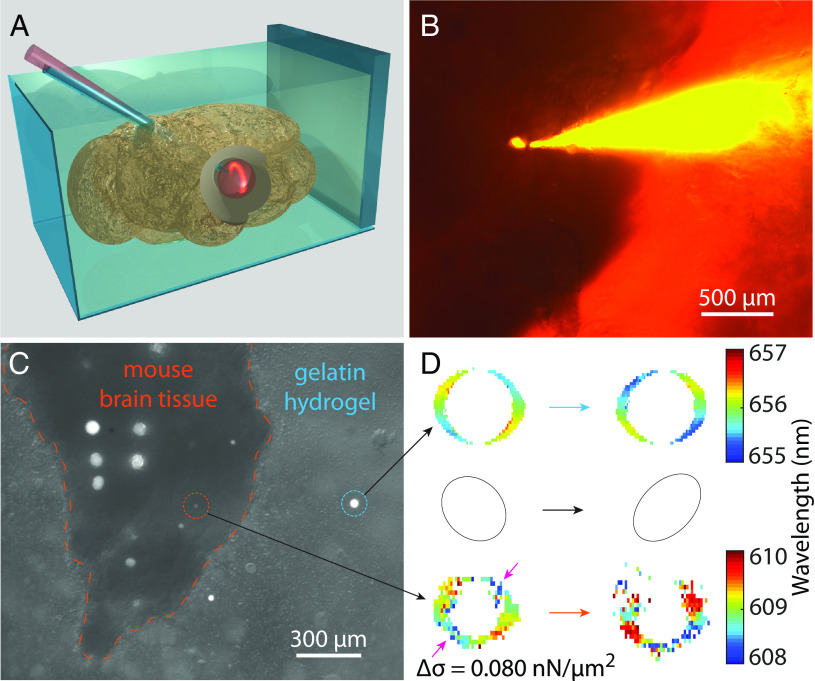
Mechanical properties of biological tissues fundamentally underlie various biological processes and noncontact, local, and microscopic methods can provide fundamental insights. Here, we present an approach for quantifying the local mechanical properties of biological materials at the microscale, based on measuring the spectral shifts of the optical resonances in droplet microcavities. Specifically, the developed method allows for measurements of deformations in dye-doped oil droplets embedded in soft materials or biological tissues with an error of only 1 nm, which in turn enables measurements of anisotropic stress inside tissues as small as a few pN/μm2. Furthermore, by applying an external strain, Young's modulus can be measured in the range from 1 Pa to 35 kPa, which covers most human soft tissues. Using multiple droplet microcavities, our approach could enable mapping of stiffness and forces in inhomogeneous soft tissues and could also be applied to in vivo and single-cell experiments. The developed method can potentially lead to insights into the mechanics of biological tissues.

Keywords: biological tissues; liquid inclusions; microdroplets; stiffness; whispering gallery modes.


Conflict of interest statement

Competing interests statement:The authors declare no competing interest.

Figures

Fig. 1.
Fig. 1.
Schematic illustration of the experimental workflow. (A) A droplet is injected into the investigated material via a microcapillary. (B) Droplet acts as an optical microcavity when its optical resonances are excited by an external light source. (C) The droplet deforms due to external forces, whereas the interfacial tension resists droplet deformation. (D) The measured WGM wavelengths are dependent on the optical path length: Any droplet deformation results in a redshift or a blueshift depending on whether the circumference in that plane increases or decreases, respectively.
Fig. 2.
Fig. 2.
Droplet deformation in a hydrogel. (A) Schematic illustration of the experimental setup. A wall moves in the x-direction deforming the hydrogel, which contains oil droplets. (B) Fluorescence image of microdroplets which are randomly distributed within a single plane in the hydrogel. (C) Droplet before induced deformation (Left) and deformed droplet (Right) at 0 and 2.8% deformation of the hydrogel, with a schematic of the droplet’s shape with exaggerated deformation (20× magnified) to assist visualization of the measurement concept. (D) Spatially resolved spectra along the spectrometer slit (red rectangle) positioned across a single droplet without induced deformation (Top) and a deformed droplet (Bottom). (E) Typical spectrum at a single point on the droplet’s rim without induced deformation.
Fig. 3.
Fig. 3.
Experimental measurements of droplet deformation via shifts of WGMs. (A) Measured wavelength shift of a single WGM peak at different points on the rim of the droplet. The hydrogel surrounding the droplet was stretched up to a strain of ϵ=0.029 and squeezed up to ϵ=0.011. The Top row represents droplet extension and the Bottom row droplet compression. (B) Droplet spectra from xz- and (C) yz-plane, at different strains. (D) Geometry of the droplet deformation is represented by the ellipsoid with semi-axes (rx, ry, and rz), planes of the WGMs circulation (green, blue, and orange dashed lines) and the WGM wavelengths corresponding to these planes (λyz and λxz). Red dashed lines correspond to the droplet circumference as observed through the microscope. The superimposed wavelength shifts at the top belong to the same droplet as figures AE. (E) Wavelength shifts from A (Top row) fitted to an ellipse in polar coordinates at three different strains. (F) WGM shifts at different points on the rim of a diagonally deformed droplet.
Fig. 4.
Fig. 4.
Data analysis and material parameter extraction. (A) Experimental measurements of deformation of droplets with different radii r as the external hydrogel strain is increased. (B) Droplet aspect ratio η=rx/ry with respect to the average hydrogel strain ϵ far from the droplet for simulations of one droplet with radius r=12.2 μm and different elastic moduli E. The slope of the linear fit k=Δη/Δϵ is calculated for both experimental and simulation results and plotted in (C and D). (C) Simulated results for varying elastic moduli E and experimentally measured droplet radii r are represented by crosses and connected with a dashed line. Experimental measurements corresponding to the same droplet sizes are shown as horizontal lines with matching colors. The intersection of the horizontal lines and curved lines for each specific droplet radius indicates the measured Young’s modulus E. (D) Experimental and simulated data on the same curve, and plotted against the dimensionless quantity rE/γ, which gives the final results E = 1,800 Pa and γ=65mN/m.
Fig. 5.
Fig. 5.
Measurement of stiffness and forces in brain tissue. (A) Schematic illustration of the experimental setup for measuring mechanics of mouse brain tissue, where an oil droplet is injected into the brain tissue contained within gelatin hydrogel. (B) Fluorescence image of a microcapillary at the moment of separation from the generated droplet in the brain tissue. (C) Multiple droplets at various positions in the brain tissue as well as in the surrounding gelatin hydrogel. (D) Wavelength shifts of a single WGM peak for the droplets in gelatin (Top) and in brain tissue (Bottom).

Similar articles

Cited by

  • DNA Sensing with Whispering Gallery Mode Microlasers.
    Caixeiro S, Dörrenhaus R, Popczyk A, Schubert M, Kath-Schorr S, Gather MC. Caixeiro S, et al. Nano Lett. 2025 Mar 19;25(11):4467-4475. doi: 10.1021/acs.nanolett.5c00078. Epub 2025 Mar 4. Nano Lett. 2025. PMID: 40035381 Free PMC article.

References

    1. P. G. De Gennes, J. Prost, The Physics of Liquid Crystals (Oxford University Press, 1993), vol. 83.
    1. Kimura Y., Microrheology of soft matter. J. Phys. Soc. Jpn. 78, 041005 (2009).
    1. Levental I., Georges P. C., Janmey P. A., Soft biological materials and their impact on cell function. Soft Matter 3, 299–306 (2007). - PubMed
    1. Cheung H. K., et al. , Composite hydrogel scaffolds incorporating decellularized adipose tissue for soft tissue engineering with adipose-derived stem cells. Biomaterials 35, 1914–1923 (2014). - PubMed
    1. Kai F. B., Laklai H., Weaver V. M., Force matters: Biomechanical regulation of cell invasion and migration in disease. Trends Cell Biol. 26, 486–497 (2016). - PMC - PubMed

LinkOut - more resources