. 2024 Jan 16;5(1):101372.
doi: 10.1016/j.xcrm.2023.101372.

The impact of bed rest on human skeletal muscle metabolism

Affiliations

The impact of bed rest on human skeletal muscle metabolism

Moritz Eggelbusch et al. Cell Rep Med. .

Abstract

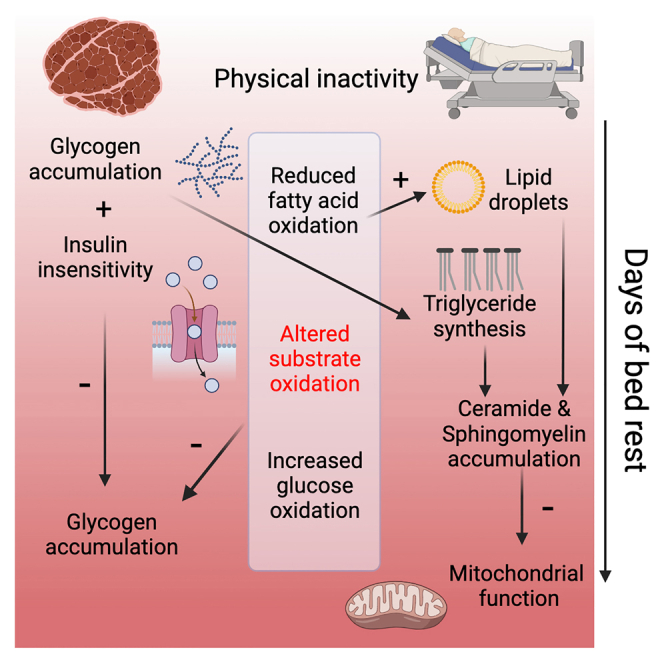
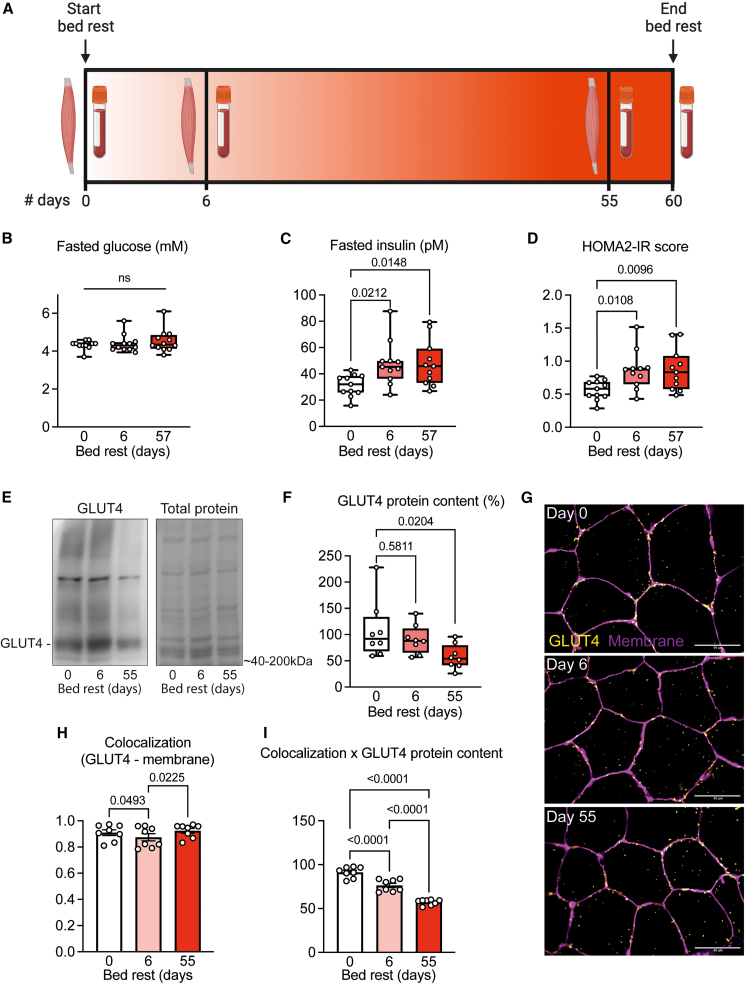
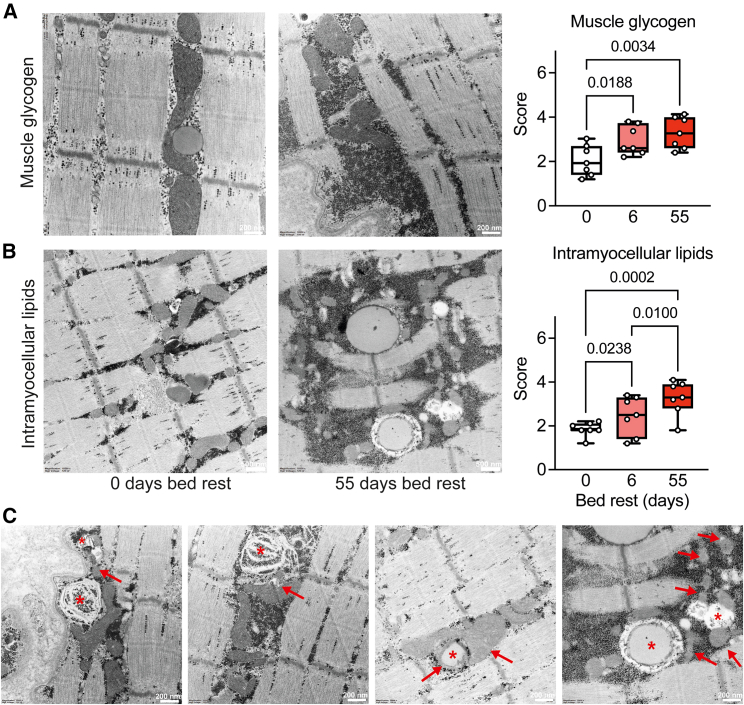
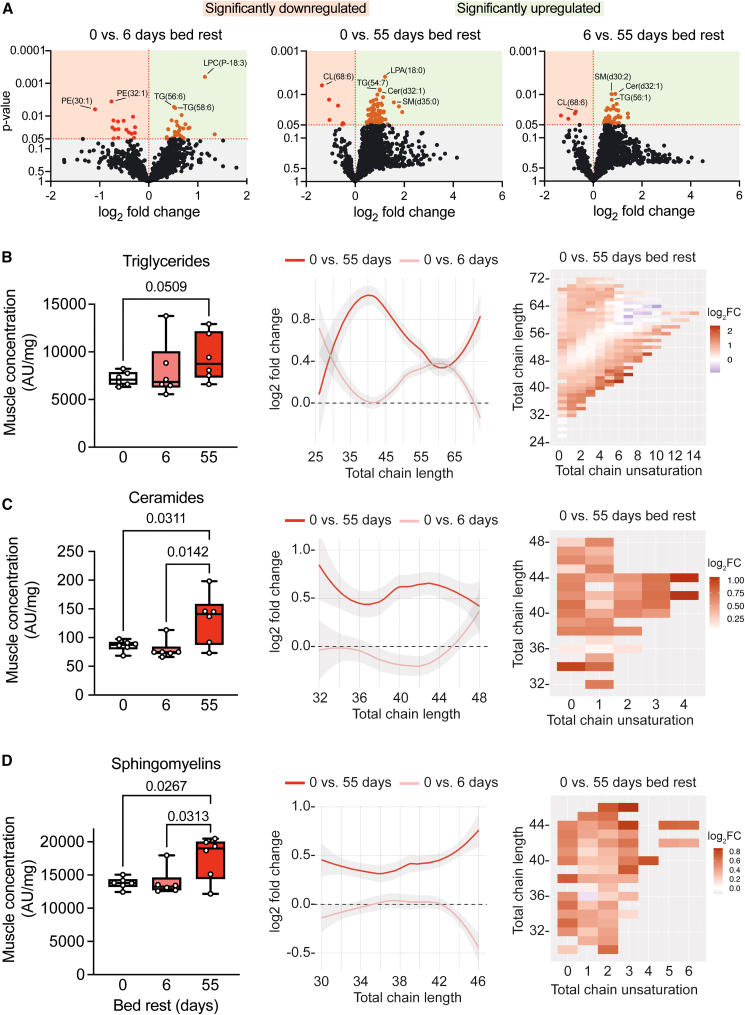
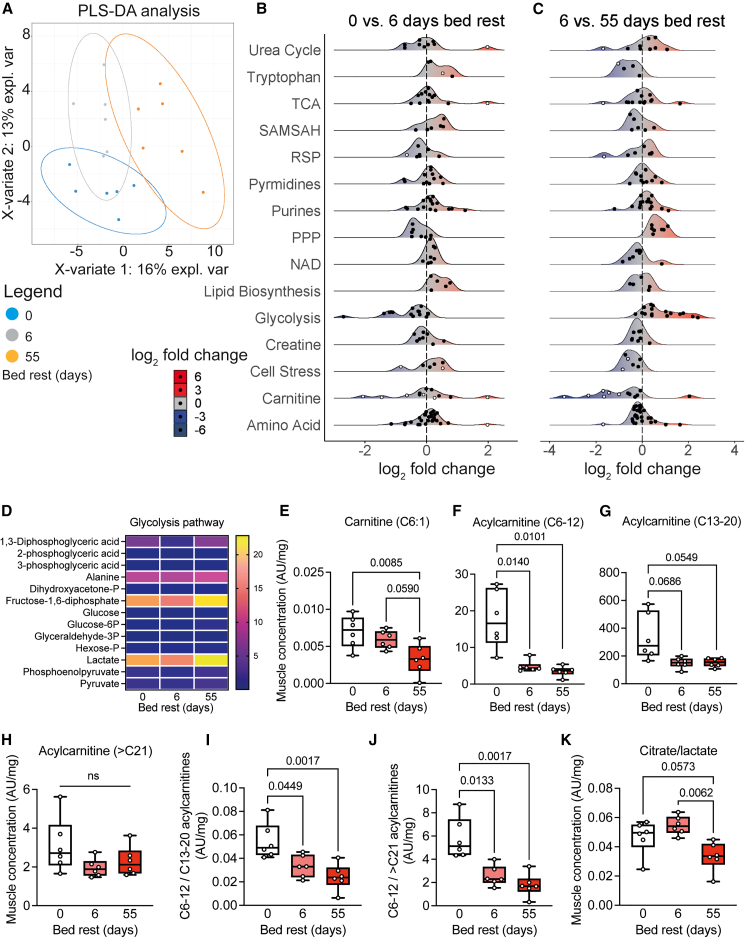
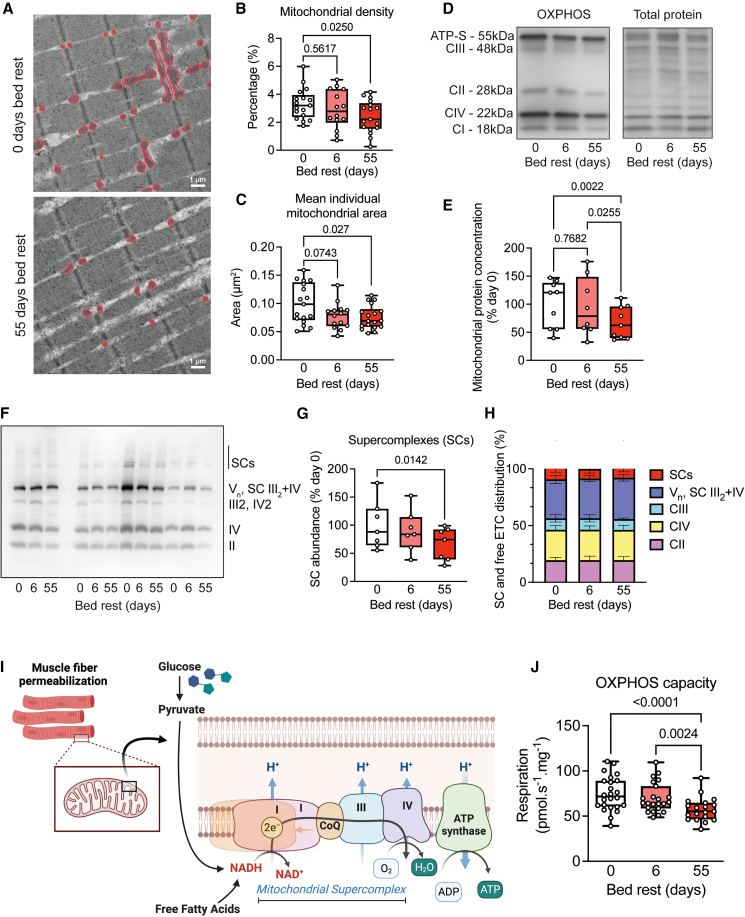
Insulin sensitivity and metabolic flexibility decrease in response to bed rest, but the temporal and causal adaptations in human skeletal muscle metabolism are not fully defined. Here, we use an integrative approach to assess human skeletal muscle metabolism during bed rest and provide a multi-system analysis of how skeletal muscle and the circulatory system adapt to short- and long-term bed rest (German Clinical Trials: DRKS00015677). We uncover that intracellular glycogen accumulation after short-term bed rest accompanies a rapid reduction in systemic insulin sensitivity and less GLUT4 localization at the muscle cell membrane, preventing further intracellular glycogen deposition after long-term bed rest. We provide evidence of a temporal link between the accumulation of intracellular triglycerides, lipotoxic ceramides, and sphingomyelins and an altered skeletal muscle mitochondrial structure and function after long-term bed rest. An intracellular nutrient overload therefore represents a crucial determinant for rapid skeletal muscle insulin insensitivity and mitochondrial alterations after prolonged bed rest.

Keywords: GLUT4; bed rest; insulin sensitivity; lipotoxicity; metabolism; mitochondria; nutrient overload; physical inactivity; skeletal muscle.


Conflict of interest statement

Declaration of interests The authors declare no competing interest.

Figures

None
Graphical abstract
Figure 1
Figure 1
Short- and long-term bed rest induces whole-body and skeletal muscle insulin insensitivity (A) Study design. Vastus lateralis muscle biopsies were taken 1 day before, after 6 days (short term), and after 55 days (long term) of bed rest. Blood was drawn before and after 6 and 57 days of bed rest. (B–D) Fasted blood glucose and insulin levels were used to calculate the HOMA2-IR score (n = 12), which increased after bed rest. (E and F) Western immunoblots of GLUT4 showed a lower GLUT4 protein concentration in skeletal muscle after long-term bed rest (n = 6–7). (G) Representative immunofluorescence microscopy images of skeletal muscle tissue stained for GLUT4 (yellow) and muscle cell membrane (magenta), before and after 6 and 55 days of bed rest (n = 8). (H) Mander’s colocalization analyses showed a lower fraction of GLUT4 at the muscle cell membrane after short- but not long-term bed rest. (I) Estimates of absolute GLUT4 protein (H times F) at the cell membrane were significantly lower after short- and long-term bed rest. All data were analyzed by repeated measures ANOVA, mixed-effects model with Tukey’s post hoc test. Scale bar represents 50 μm. HOMA2-IR: homeostatic model assessment (HOMA) for insulin resistance, GLUT4: glucose transporter type 4, ns = not significant.
Figure 2
Figure 2
Bed rest-induced glycogen and lipid overload, particularly around mitochondria (A and B) Transmission electron microscopy (EM) images of the vastus lateralis were used to quantify skeletal muscle glycogen (A) and intramyocellular lipid (B) accumulation before and after 6 and 55 days of bed rest. (C) Abnormal lipids and mitochondria are indicated by stars and arrows, respectively. All data were analyzed by repeated measures ANOVA, with Tukey’s post hoc test, n = 7 participants for EM. Scale bar represents 200 nm in (A) and (C) and 500 nm in (B).
Figure 3
Figure 3
Bed rest induces skeletal muscle triglyceride accumulation, lipid elongation, and accumulation of lipotoxic species (A) Volcano plots based on mass-spectrometry-based lipidomics analysis performed in vastus lateralis biopsies comparing 0 vs. 6, 0 vs. 55, and 6 vs. 55 days of bed rest. Out of 1,362 identified lipid species, 44 were significantly altered after short-term bed rest (17 downregulated) and 88 lipids changed significantly (7 downregulated) after long-term bed rest. (B–D) Tissue concentration of triglycerides (B), ceramides (C), and sphingomyelins (D) increased with long-term but not short-term bed rest. Elongation of all chain lengths and saturation increased with long-term bed rest. All lipidomics data were normalized to dry tissue weight. Concentration changes of lipid species were analyzed using repeated measures ANOVA, with Tukey’s post hoc test, n = 6.
Figure 4
Figure 4
Altered skeletal muscle metabolism after bed rest (A) Primary component analysis of time-dependent metabolic changes. (B and C) Landscape plots based on vastus lateralis metabolomics analysis, indicating the response of various metabolic pathways upon bed rest. White dots represent significantly altered (p < 0.05) metabolites. Metabolite concentration shifts are presented as log2fold changes to indicate directionality of alterations. (D) Heatmap of changes in metabolites associated with the glycolysis. (E–H) Carnitine (E) and acylcarnitine concentrations with medium (F), long (G), but not very long (H) chain lengths decreased during bed rest, indicative of a reduced fatty acid oxidation capacity. (I and J) Ratio of medium over long-chain (I) and medium over very long-chain (J) acylcarnitines. (K) The altered citrate/lactate tissue concentration is indicative of a shift toward glucose oxidation. All metabolomics data were normalized to dry tissue weight. Concentration changes of individual metabolites were analyzed using repeated measures ANOVA, with Tukey’s post hoc test, n = 6. TCA: tricarboxylic acid cycle; SAMSAH: S-adenosylmethionine/S-adenosylhomocysteine cycle; RSP: reductive stress panel; PPP: pentose phosphate pathway; NAD: nicotinamide adenine dinucleotide pathway.
Figure 5
Figure 5
Impaired mitochondrial structure and function after bed rest (A–C) Representative electron microscopy images (A) were used to assess mitochondrial density (B) and size (C), which were both reduced after long-term bed rest. (D and E) Typical oxidative phosphorylation capacity (OXPHOS) western blot and normalization. Individual protein concentrations of mitochondrial complexes were only reduced after long-term bed rest. (F–H) Representative BN-PAGE to assess mitochondrial supercomplexes (SCs) (F). Relatively fewer mitochondrial proteins were incorporated into SCs after long-term bed rest (G), but the make-up of these supercomplexes was the same (H). (I and J) Saponin-permeabilized fibers were used to assess mitochondrial respiration. OXPHOS capacity was unaffected after short-term bed rest but significantly decreased after long-term bed rest. All data were analyzed using repeated measures ANOVA, with Tukey’s post hoc test, n = 14–17 for mitochondrial density and area, n = 9 for immunoblotting, n = 7 for BN-PAGE, and n = 24 for respirometry. Scale bar represents 1 μm in (A).

References

    1. Booth F.W., Roberts C.K., Thyfault J.P., Ruegsegger G.N., Toedebusch R.G. Role of Inactivity in Chronic Diseases: Evolutionary Insight and Pathophysiological Mechanisms. Physiol. Rev. 2017;97:1351–1402. - PMC - PubMed
    1. Hyatt H.W., Powers S.K. Mitochondrial Dysfunction Is a Common Denominator Linking Skeletal Muscle Wasting Due to Disease, Aging, and Prolonged Inactivity. Antioxidants. 2021;10:588. - PMC - PubMed
    1. Smith R.L., Soeters M.R., Wüst R.C.I., Houtkooper R.H. Metabolic Flexibility as an Adaptation to Energy Resources and Requirements in Health and Disease. Endocr. Rev. 2018;39:489–517. - PMC - PubMed
    1. Sylow L., Tokarz V.L., Richter E.A., Klip A. The many actions of insulin in skeletal muscle, the paramount tissue determining glycemia. Cell Metab. 2021;33:758–780. - PubMed
    1. Rudwill F., O'Gorman D., Lefai E., Chery I., Zahariev A., Normand S., Pagano A.F., Chopard A., Damiot A., Laurens C., et al. Metabolic Inflexibility Is an Early Marker of Bed-Rest-Induced Glucose Intolerance Even When Fat Mass Is Stable. J. Clin. Endocrinol. Metab. 2018;103:1910–1920. - PMC - PubMed

Publication types