. 2024 Jan 16;5(1):101377.
doi: 10.1016/j.xcrm.2023.101377.

Lymph node and tumor-associated PD-L1+ macrophages antagonize dendritic cell vaccines by suppressing CD8+ T cells

Affiliations

Lymph node and tumor-associated PD-L1+ macrophages antagonize dendritic cell vaccines by suppressing CD8+ T cells

Jenny Sprooten et al. Cell Rep Med. .

Abstract

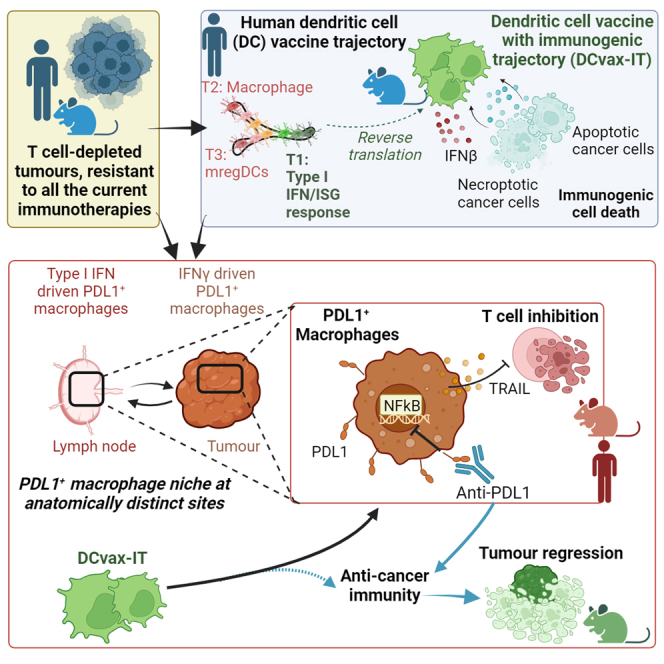
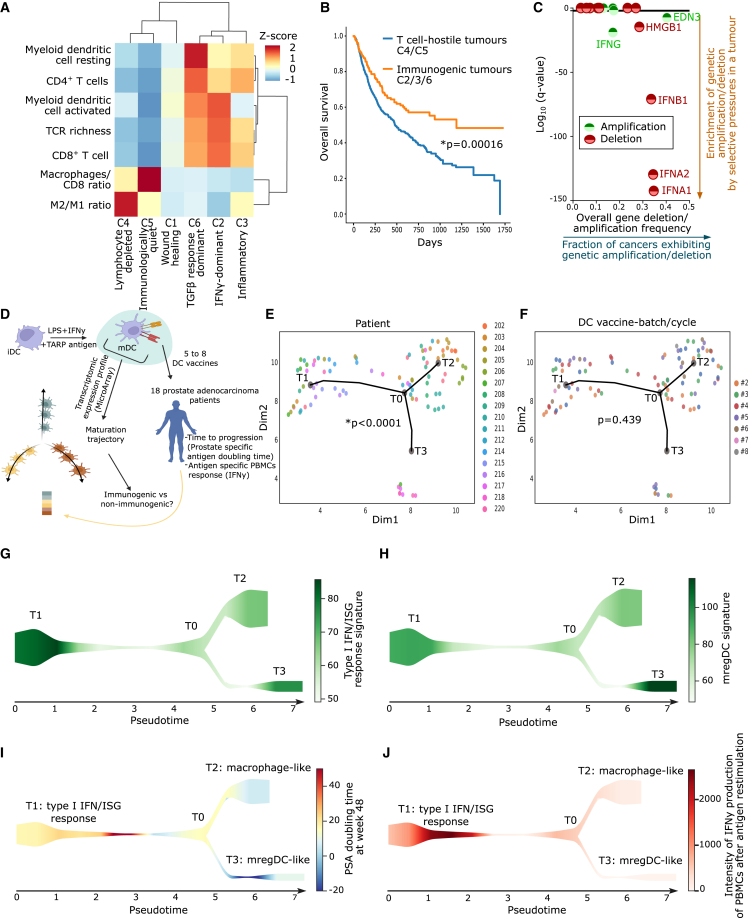
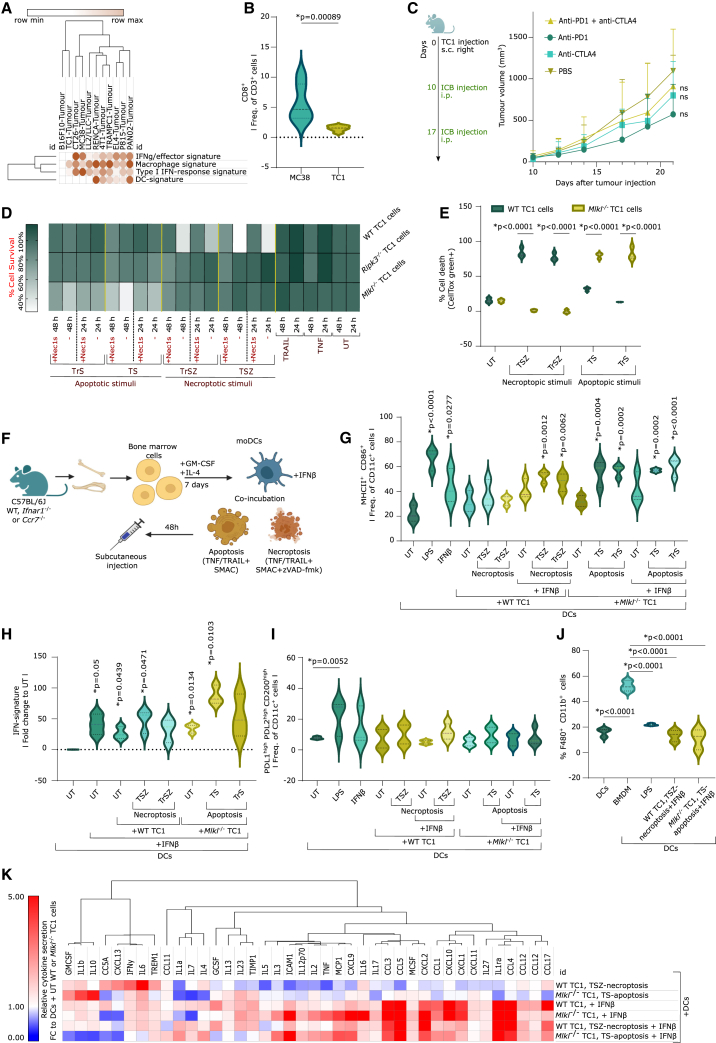
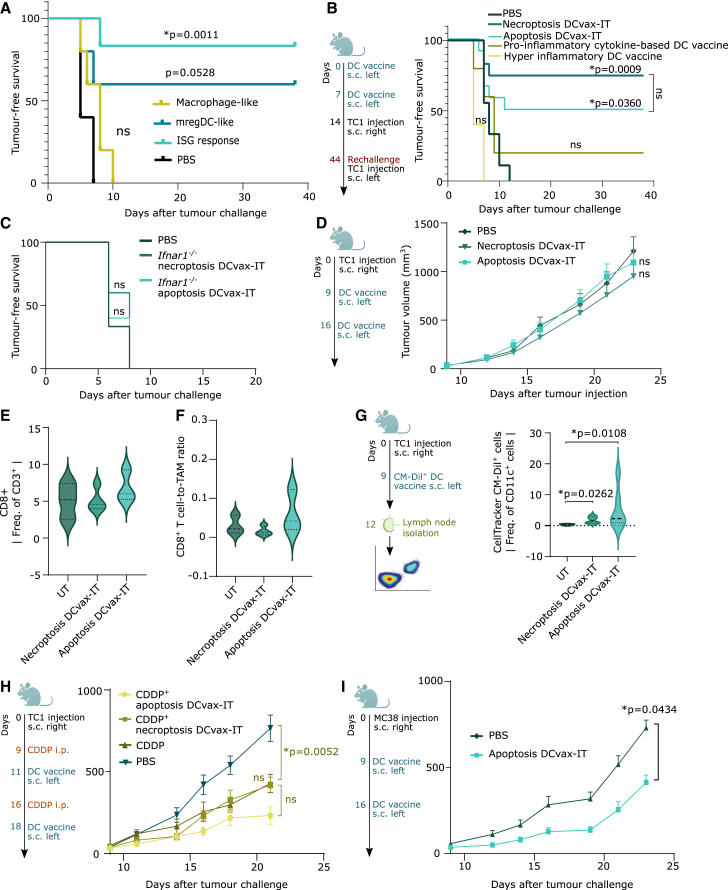
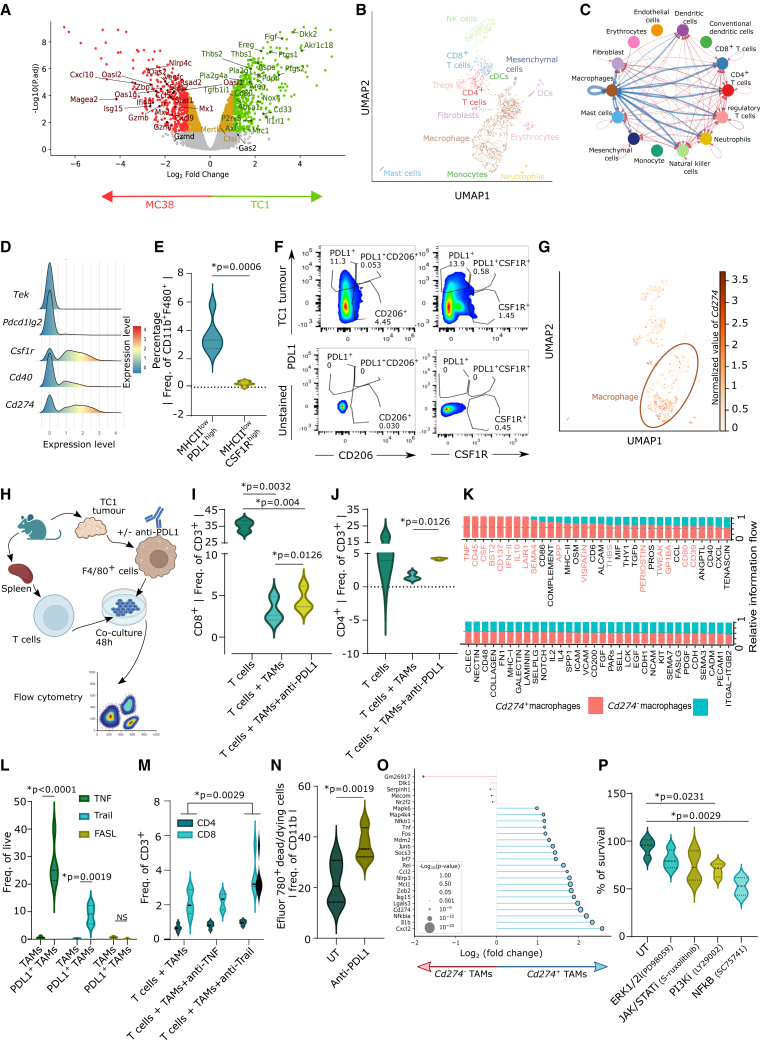
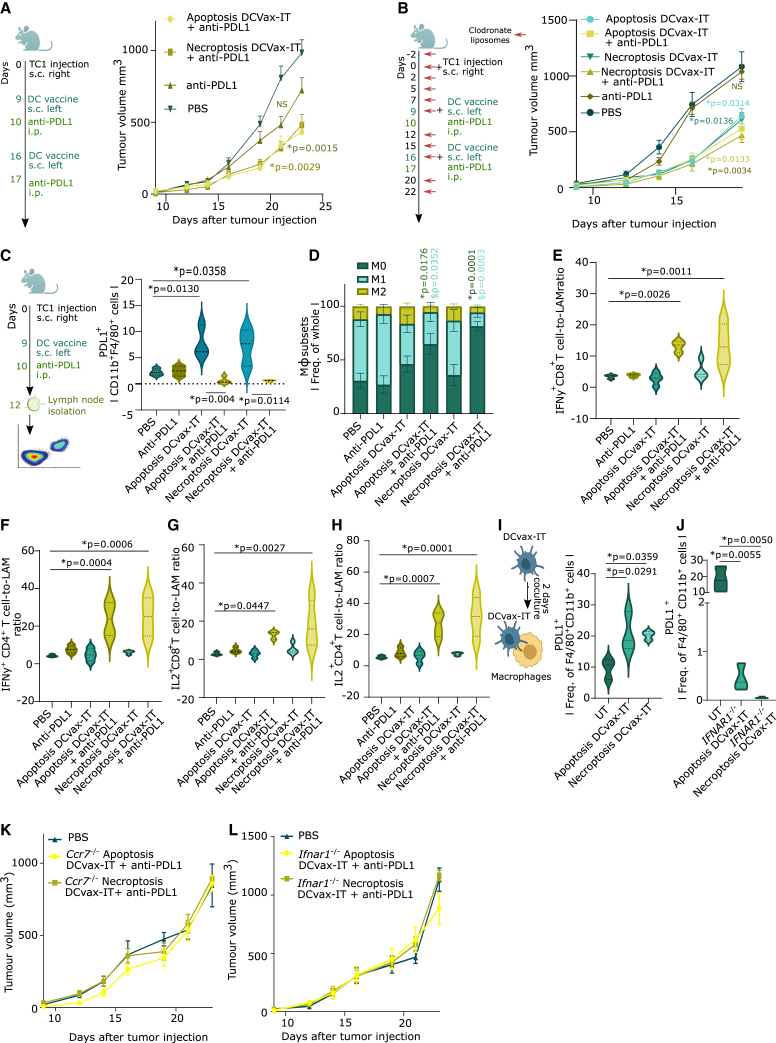
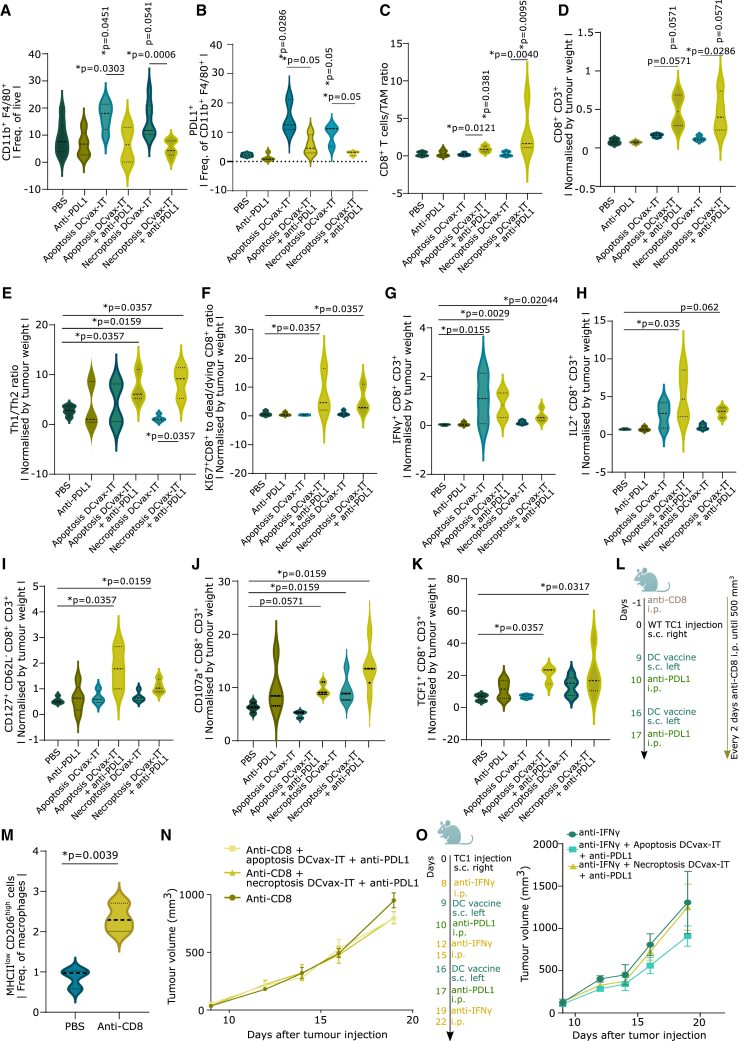
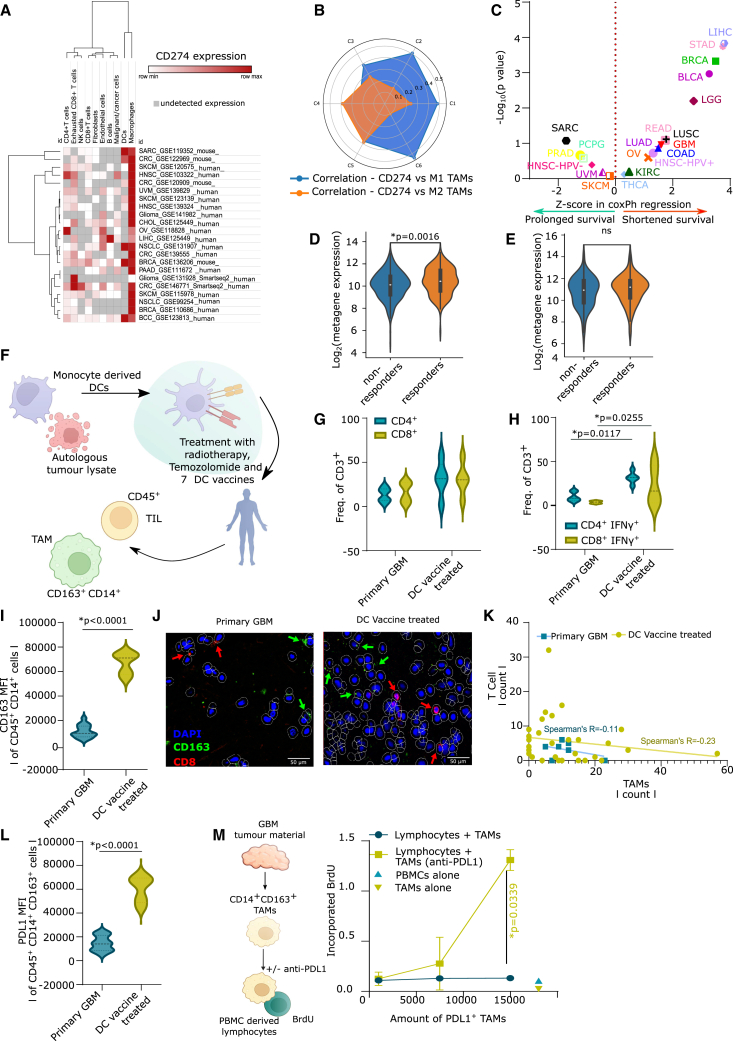
Current immunotherapies provide limited benefits against T cell-depleted tumors, calling for therapeutic innovation. Using multi-omics integration of cancer patient data, we predict a type I interferon (IFN) responseHIGH state of dendritic cell (DC) vaccines, with efficacious clinical impact. However, preclinical DC vaccines recapitulating this state by combining immunogenic cancer cell death with induction of type I IFN responses fail to regress mouse tumors lacking T cell infiltrates. Here, in lymph nodes (LNs), instead of activating CD4+/CD8+ T cells, DCs stimulate immunosuppressive programmed death-ligand 1-positive (PD-L1+) LN-associated macrophages (LAMs). Moreover, DC vaccines also stimulate PD-L1+ tumor-associated macrophages (TAMs). This creates two anatomically distinct niches of PD-L1+ macrophages that suppress CD8+ T cells. Accordingly, a combination of PD-L1 blockade with DC vaccines achieves significant tumor regression by depleting PD-L1+ macrophages, suppressing myeloid inflammation, and de-inhibiting effector/stem-like memory T cells. Importantly, clinical DC vaccines also potentiate T cell-suppressive PD-L1+ TAMs in glioblastoma patients. We propose that a multimodal immunotherapy and vaccination regimen is mandatory to overcome T cell-depleted tumors.

Keywords: DAMPs; ICB; NF-κB; PD-1; TAAs; apoptosis; damage-associated molecular patterns; immune-checkpoint blockers; mature regulatory DCs; mregDC; necroptosis; nuclear factor κB; programmed cell death-1; single-cell omics; tumor-associated antigens.


Conflict of interest statement

Declaration of interests A.D.G. received honoraria/funding from Boehringer Ingelheim, Miltenyi Biotec, Novigenix, SOTIO, and IsoPlexis.

Figures

None
Graphical abstract
Figure 1
Figure 1
T cell-depleted tumors and maturation trajectories of human DC vaccines (A) CIBERSORT deconvolution across TCGA cancer types. Population abundances were row normalized (C1, n = 1,313; C2, n = 1,210, C3, n = 688; C4, n = 222, C5, n = 2; C6, n = 111). (B) Overall survival of cancer patients’ transcriptome profiled before ICBs treatment (anti-PD-1/CTLA4/PD-L1 ICBs, or combinations thereof) sub-grouped in T cell-depleted C4/C5 tumors (n = 667) and immunogenic C2/C3/C6 tumors (n = 474). Statistics: log rank test. (C) GISTIC 2.0 analysis with indicated 12 genes. Statistical significance: false discovery rate (FDR) < 0.05 (random permutations to background score distribution, BH adjusted). Bladder cancer, n = 136; breast cancer, n = 880; colorectal adenocarcinomas, n = 585; glioblastoma multiforme, n = 580; head and neck cancer, n = 310; kidney cancer, n = 497; acute myeloid leukemia, n = 200; lung adenocarcinoma, n = 357; lung squamous cell carcinoma, n = 344; ovarian cancer, n = 563; endometrial cancer, n = 496. (D–J) Single-cell trajectory reconstruction exploration and mapping (STREAM) DC vaccine trajectory of 93 DC vaccines from 18 prostate adenocarcinoma patients vaccinated with five to eight vaccines. (D) Overview of STREAM DC vaccine trajectory. (E and F) Pseudo-time inferred from DC vaccines’ transcriptome based on variable genes. Principal graph initiated with epg_alpha = 0.01, epg_mu = 0.2, epg_lambda = 0.03, and epg_n_nodes = 5. Dots depict individual DC vaccines and dot color represents (E) patient number or (F) DC vaccine batch/cycle (chi-squared test of independence of variables). (G and H) Signature scores overlaid on the graph as streamplots. Type I IFN/ISG-response signature (G) or mature regulatory DC signature (H) were used as color intensity. (I and J) Patient outcomes were overlaid on the graph as streamplots. PSA doubling time at week 48 (I) and intensity of IFNγ production of peripheral blood mononuclear cell after antigen restimulation (J) were used as color intensity. Here, “n” represents different patients (biological replicates). See also Figure S1.
Figure 2
Figure 2
Optimization of DCvax-IT for T cell-depleted tumors (A) Metagene expression for indicated signatures in different subcutaneous tumors (from GEO: GSE85509). (B) Flow cytometry analysis of CD45+ fraction from subcutaneous MC38/TC1 tumors on day 23 after injection (percentage of CD8+ of CD3+ cells, n = 6; two-tailed Student’s t test). (C) Tumor volume of TC1-tumor-bearing mice treated with anti-PD-1/CTLA4 on day 9/16 after injection (n = 6; area under curve; one-way ANOVA, Kruskal-Wallis test). (D) Survival of WT, Ripk3−/−, and Mlkl−/− TC1 cells 24/48 h after treatment (three or four repeats). (E) Cell death of WT and Mlkl−/− TC1 cells 48 h after treatment. p values depict comparison WT vs. Mlkl−/− TC1 cells (n = 3; two-way ANOVA, Sidak’s multiple comparisons test). (F) Schematic overview of the vaccine formulation process. (G and H) Functional analysis of DCs untreated or stimulated with LPS, IFNβ, or with untreated or dying TC1s (with/without IFNβ). (G) Flow cytometry of DC maturation (MHCII+ CD86+ frequency of CD11c+). p values depict comparison vs. UT DCs (n = 3; one-way ANOVA, Dunnett’s multiple comparisons test). (H) IFN-signature expression (qPCR). p values depict comparison vs. UT DCs (n = 3; one sample t test). (I) Flow cytometry of frequency of PD-L1+PD-L2+CD200+ of CD11c+ cells (moDCs alone/cocultured with untreated/dying WT/Mlkl−/− TC1 cells). p values depict comparison vs. UT moDCs (n = 4, LPS/IFNβ n = 3; one-way ANOVA, Fischer least significant difference [LSD]). (J) Flow cytometry of frequency of CD11b+F4/80+ in moDCs (alone/cocultured with untreated/dying WT/Mlkl−/− TC1 cells) or bone-marrow-derived macrophages (BMDMs). p values depict comparison vs. BMDMs (n = 3; one-way ANOVA, Dunnett’s multiple comparisons test). (K) Cytokine secretion via cytokine array. From all values, the background was subtracted. Normalization was done using moDCs + untreated cancer cells (n = 3). Here, “n” represents biological replicates and error bars represent SEM. See also Figures S2 and S3.
Figure 3
Figure 3
DCvax-IT fails against T cell-depleted tumors in a curative setup (A–C) Tumor-free survival of mice vaccinated with two prophylactic DC vaccines (day 0/7), followed by subcutaneous TC1 challenge. p values depict comparison vs. PBS-treated mice. (A) Comparison of indicated DC vaccines to PBS-treated mice (PBS, n = 5; all vaccines; n = 5, log rank, Mantel-Cox test). (B) Comparison of indicated DC vaccines to PBS-treated mice (PBS, n = 9; necroptotic/apoptotic DCvax-IT, n = 6; pro-inflammatory cytokine/hyper-inflammatory DC vaccines, n = 5, log rank [Mantel-Cox] test). (C) Comparison of indicated DC vaccines to PBS-treated mice (PBS, n = 6; apoptosis/necroptosis DCvax-IT, n = 5, log rank [Mantel-Cox] test). (D) TC1-tumor-bearing mice treated with DCvax-IT (day 9/16 after injection). Comparison to PBS-treated mice (n = 12, area under curve; Kruskal-Wallis test). (E and F) Flow cytometry analysis of CD45+ fraction from untreated/DCvax-IT-treated TC1 tumors (day 23 after tumor injection). Frequency of (E) CD8+ T cells or (F) CD8+ T cells to TAM ratio. Comparison to PBS-treated mice (UT, n = 3; necroptosis DCvax-IT, n = 4; apoptosis DCvax-IT, n = 3, one-way ANOVA, Dunnett’s multiple comparisons test). (G) Frequency of Celltracker CM-Dil+CD11c+ cells in LNs of vaccinated mice. p values depict comparison vs. PBS-treated mice (UT, n = 4, necroptosis/apoptosis DCvax-IT, n = 6, one-way ANOVA, Kruskal-Wallis test). (H) TC1-tumor-bearing mice treated with cisplatin (day 9/16) alone or in combination with DCvax-IT (day 11/18) and after TC1-injection. p values depict comparison vs. cisplatin-treated mice (n = 8; area under curve, one-way ANOVA, Dunnett’s multiple comparisons test). (I) MC38-tumor-bearing mice treated with DCvax-IT (day 9/16) after MC38-injection. p values vs. PBS-treated mice (PBS, n = 8; apoptosis DCvax-IT, n = 10, area under curve, Mann-Whitney test). Here, “n” represents biological replicates and error bars represent SEM. See also Figure S3.
Figure 4
Figure 4
TC1 tumors enrich CD8+ T cell-suppressive PD-L1+ macrophages (A) Volcano plot of gene expression between MC38 and TC1 tumors (GEO: GSE85509). (B) Uniform manifold approximation and projection (UMAP) of untreated TC-1 tumor scRNA-seq data (GSM7103827). (C) Inferred cell-cell communication by CellChat from dataset in (B) (bandwidth indicates intensity of cell-to-cell communication). (D) Macrophages as density over expression of indicate gene levels from dataset in (B). (E) CD45+ cell fraction from TC1 tumors (day 23 after injection). Frequency of TAMs (n = 6; two-tailed paired t test). (F) Flow cytometry analysis of PD-L1+, CSF1R+, CD206+ (gating on unstained samples) on TAM from TC1 tumors isolated on day 23 post injection. (G) UMAP of TC1-tumor scRNA-seq data indicating normalized Cd274 expression (log1p-transformed reads per 10,000). (H–J) Flow cytometry of T cell recovery after cocultures with TAMs from TC1 tumors (day 23 post injection), pre-incubated with/without anti-PD-L1 for 48 h, together with paired spleen-derived T cells. (H) TAM/T cell coculture experimental setup. (I and J) Frequency of (I) CD8+ T cells and (J) CD4+ T cells (n = 3; two-tailed paired t test). (K) Relative information flow (CellChat) of Cd274+ and Cd274 macrophages (1,006 cells) from dataset in (B). (L) TNF, TRAIL, FASLG expression of indicated TAMs from TC1 tumors (isolated on day 23 post injection) (n = 5; two-way ANOVA; Sidak’s multiple comparisons test). (M) Flow cytometry analysis of live T cell recovery, as per experimental setup in (H) and (J) but pre-incubated with/without anti-TNF/anti-TRAIL for 48 h, together with paired spleen-derived T cells (n = 5; two-way ANOVA). (N) Flow cytometry analysis of Efluor 780+ dead/dying cell in untreated/anti-PD-L1-treated TC1-derived TAMs (isolated on day 23 post injection) (n = 4; two-tailed paired t test). (O) DGE of Cd274+ macrophages (blue) vs. Cd274 macrophages (red) from dataset in (B). The x axis: log2 fold change of PD-L1+ to PD-L1. Size of circles: −log10-transformed p values. (P) Percentage TAM survival from TC1 tumors (day 23 post injection) treated with different inhibitors (n = 4; one-way ANOVA; Dunnett’s multiple comparisons test). Here, “n” represents biological replicates. See also Figure S4.
Figure 5
Figure 5
DCvax-IT-mobilized PD-L1+ macrophages in LNs are blunted by DCvax-IT and anti-PD-L1 ICB (A) TC1-tumor-bearing mice treated with DCvax-IT (day 9/6) and/or anti-PD-L1 (day 10/17). p values depict comparison vs. PBS-treated mice (PBS, n = 12; apoptosis/necroptosis DCvax-IT + anti-PD-L1, n = 12; area under curve, one-way ANOVA Kruskal-Wallis test). (B) TC1-tumor-bearing mice treated with DCvax-IT (day 9/16) and/or anti-PD-L1 (day 10/17) in combination with clodronate liposomes (CLs). p values depict comparison vs. CL-treated mice (CL/apoptosis DCvax-IT/necroptosis DCvax-IT, n = 5; anti-PD-L1/apoptosis DCvax-IT + anti-PD-L1/necroptosis DCvax-IT + anti-PD-L1, n = 6; area under curve, one-way ANOVA, Dunnett’s multiple comparisons test). (C–H) Lymph node analysis of TC1-tumor-bearing mice, 3 days post treatment with DCvax-IT (with/without anti-PD-L1). (C) Frequency of PD-L1+ of CD11b+F4/80+ cells. p values depict comparison vs. PBS-treated mice unless otherwise specified (n = 3–4; unpaired t test). (D) Frequency of M1 (MHC-IIHIGHCD206LOW), M2 (MHC-IILOWCD206HIGH), or M0 (MHC-IILOWCD206LOW) macrophages. ∗p values depict comparison vs. M0 from PBS-treated mice. $p values depict comparison vs. M1 from PBS-treated mice (n = 6; two-tailed Student’s t test). (E) IFNγ+CD8+ T cells-to-TAMs ratio. p values depict comparison vs. PBS-treated mice (PBS/apoptosis DCvax-IT + anti-PD-L1, n = 3; anti-PD-L1/apoptosis DCvax-IT/necroptosis DCvax-IT + anti-PD-L1, n = 4, one-way ANOVA, Fischer’s LSD test). (F) IFNγ+CD4+ T cells-to-TAMs ratio. p values depict comparison vs. PBS-treated mice (PBS, n = 3; anti-PD-L1/apoptosis DCvax-IT/apoptosis DCvax-IT + anti-PD-L1/necroptosis DCvax-IT + anti-PD-L1, n = 4, one-way ANOVA, Fischer’s LSD test). (G) IL2+CD8+ T cells-to-TAMs ratio. p values depict comparison vs. PBS-treated mice (biological replicates; PBS/apoptosis DCvax-IT + anti-PD-L1, n = 3; anti-PD-L1/apoptosis DCvax-IT/necroptosis DCvax-IT + anti-PD-L1, n = 4, one-way ANOVA, Fischer’s LSD test). (H) IL2+CD4+ T cells-to-TAMs ratio. p values depict comparison to PBS-treated mice (PBS, n = 3; anti-PD-L1/apoptosis DCvax-IT/apoptosis DCvax-IT + anti-PD-L1/necroptosis DCvax-IT + anti-PD-L1, n = 4, one-way ANOVA, Fischer’s LSD test). (I and J) Frequency of PD-L1+ cells of CD11b+ F4/80+ cells after coculturing BMDMs with (I) WT or (J) Ifnar1−/− DCvax-IT for 48 h. p values depict comparison vs. untreated DCs (n = 3; one-way ANOVA, Dunnett’s multiple comparisons test). (K and L) TC1-tumor-bearing mice treated with (K) Ccr7−/− (L) or Ifnar1−/− DCvax-IT (day 9/16) and with anti-PD-L1 (day 10/17). p values depict comparison vs. PBS-treated mice (n = 6; area under curve; one-way ANOVA, Kruskal-Wallis test). Here, “n” represents biological replicates and error bars represent SEM. See Figures S4 and S5.
Figure 6
Figure 6
DCvax-IT-mobilized PD-L1+ macrophages in tumors are blunted by DCvax-IT and anti-PD-L1 ICB (A–C) Tumor infiltrating leukocyte (TIL) analysis of CD45+ fraction from TC1 tumors (isolated on day 23 post injection) treated with DCvax-IT (day 9/16) and/or anti-PD-L1 (day 10/17). (A) Percentage of TAMs (CD11b+F4/80+), (B) percentage of PD-L1+ TAMs, (C) CD8+-to-TAM ratio. (A–C) p values depict comparison vs. PBS-treated mice unless otherwise specified (n = 3–9; Mann-Whitney test). (D–K) TIL analysis of CD45+ fraction from TC1 tumor (day 23 post injection) treated with DCvax-IT (day 9/16) with/without anti-PD-L1 (day 10/17). Normalized by tumor-weight. (D) CD8+ T cells-to-TAM ratio. (E) Th1-to-Th2 ratio. (F) KI67+CD8+-to-dead CD8+ ratio. (G) IFNγ+CD8+ T cells. (H) IL2+CD8+ T cells. (I) CD127+CD62CD8+ T cells. (J) CD107a+CD8+ T cells. (K) TCF+CD8+ cells. (D, E, F, and I–K) p values depict comparison vs. PBS-treated mice unless otherwise specified (n = 3–5; Mann-Whitney test). (G and H) p values depict comparison vs. PBS-treated mice unless otherwise specified (n = 3–4; one-way ANOVA, Kruskal-Wallis test). (L–N) TC1-tumor-bearing mice treated with DCvax-IT (day 9/11), with anti-PD-L1 (day 10/11) and with anti-CD8 1 day pre-injection and every other day until 500 mm3. p values depict comparison vs. PBS-treated mice unless otherwise specified. (M) %MHCIIlowCD206high of CD11b+F4/80+ in CD45+ fraction from TC1 tumor (day 23 post injection) (n = 3; two-tailed Student’s test). (N) Tumor volume curve (n = 7; area under curve; one-way ANOVA, Kruskal-Wallis test). (O) TC1-tumor-bearing mice treated with DCvax-IT (day 9/16) and/or anti-PD-L1 ICB (day 10/17) in combination with anti-IFNγ antibody (day 8, 12, 15, 19, 22). p values depict comparison vs. PBS-treated mice (n = 4, area under curve, one-way ANOVA). Here, “n” represents biological replicates and error bars represent SEM. See also Figure S6.
Figure 7
Figure 7
PD-L1+ macrophages are mobilized by DC vaccines in GBM patients (A) Expression of CD274/cd274 (PD-L1) across indicated datasets (n = 287 patients). (B) Correlation between CD274 vs. M1/M2 macrophage fraction in TCGA cancer types (C1, n = 1,313; C2, n = 1,210, C3, n = 688; C4, n = 222, C5, n = 2; C6, n = 111). (C) Z scores of CoxPH regression of CD274HIGH macrophagesHIGH subgroups, correcting for age, gender, tumor-stage (bladder cancer/BLCA, n = 408; breast cancer/BRCA, n = 1,100; colon adenocarcinoma/COAD, n = 458; GBM, n = 153; head and neck cancer human papillomavirus/HNSC-HPV, n = 422; head and neck cancer human papillomavirus+/HNSC-HPV+, n = 98; kidney chromophobe/KICH, n = 66; kidney renal clear cell carcinoma/KIRC, n = 533; kidney renal papillary cell carcinoma/KIRP, n = 290; low-grade glioma/LGG, n = 516; liver cancer/LIHC, n = 371; lung adenocarcinoma/LUAD, n = 515; lung squamous cell carcinoma/LUSC, n = 501; ovarian cancer/OV, n = 303; pancreatic adenocarcinoma/PAAD, n = 179; pheochromocytoma/PCPG, n = 181; prostate adenocarcinoma/PRAD, n = 498; rectum adenocarcinoma/READ, n = 166; sarcoma/SARC, n = 260; melanoma/SKCM, n = 471; stomach adenocarcinoma/STAD, n = 415; thyroid carcinoma/THCA, n = 509; uveal melanoma/UVM, n = 80, Mantel-Cox test). (D and E) log2(metagene expression) of CD274, CD163, CD14, and CD68. (D) Responders vs. non-responders to anti-PD-L1 (atezolizumab/durvalumab) (responders, n = 185 and non-responders, n = 269, where ureter/renal pelvis cancer n = 4, urothelial cancer n = 345, bladder cancer n = 31, esophageal cancer n = 72, renal cell carcinoma n = 2; Mann-Whitney U test). (E) Responders vs. non-responders to anti-PD-1 (nivolumab/pembrolizumab) (responders, n = 183 and non-responders, n = 323, where lung cancer n = 19, GBM n = 19, ureter/renal pelvis cancer n = 7, gastric cancer n = 45, colorectal cancer n = 5, melanoma n = 415, bladder cancer n = 59, hepatocellular carcinoma n = 22, breast cancer n = 14, renal cell carcinoma n = 31, head and neck cancer n = 110; Mann-Whitney U test). (F–J) Analysis of CD45+ fraction of primary and DC vaccinated GBM patients (NCT03395587). Tumor material from day of resection at first diagnosis (primary) or at recurrence after vaccination. (F) Overview of NCT03395587. (G) Frequency of CD4+/CD8+ of CD3+ cells. (H) Frequency of IFNγ+ of CD4+/CD8+CD3+ T cells. (G and H) Primary, n = 6; progress vaccine, n = 5, two-way ANOVA, Bonferroni’s multiple comparison. (I) Mean fluorescent intensity of CD163 on CD14+ cells. Primary, n = 15; recurrent DC vaccine, n = 5; two-tailed Student’s t test. (J and K) Immunohistochemistry of tumor slide from unvaccinated and DC vaccinated GBM patients (NCT03395587). (J) Representative images. (K) Correlation between TAM and T cell counts (n = 37 tumor regions from eight unvaccinated/vaccinated, Spearman’s correlation). (L) Mean fluorescent intensity of PD-L1 on CD14+ cells. Primary, n = 15; recurrent DC vaccine, n = 5; two-tailed Student’s t test. (M) Bromodeoxyuridine incorporation in cocultures of PBMC-derived lymphocytes (CD14 depleted PBMC) and TAMs obtained from primary GBM samples with/without anti-PD-L1 blocking (n = 3; area-under-curve-driven two-tailed paired t test). Here, “n” represents different patients (biological replicates) and error bars represent SEM. See also Figure S7.

Similar articles

Cited by

References

    1. Sharma P., Allison J.P. Dissecting the mechanisms of immune checkpoint therapy. Nat. Rev. Immunol. 2020;20:75–76. - PubMed
    1. Blank C.U., Haining W.N., Held W., Hogan P.G., Kallies A., Lugli E., Lynn R.C., Philip M., Rao A., Restifo N.P., et al. Defining “T cell exhaustion”. Nat. Rev. Immunol. 2019;19:665–674. - PMC - PubMed
    1. Thommen D.S., Schumacher T.N. T cell dysfunction in cancer. Cancer Cell. 2018;33:547–562. - PMC - PubMed
    1. Naulaerts S., Datsi A., Borras D.M., Antoranz Martinez A., Messiaen J., Vanmeerbeek I., Sprooten J., Laureano R.S., Govaerts J., Panovska D., et al. Multiomics and spatial mapping characterizes human CD8+ T cell states in cancer. Sci. Transl. Med. 2023;15 - PubMed
    1. Borras D.M., Verbandt S., Ausserhofer M., Sturm G., Lim J., Laureano R.S., Vanmeerbeek I., Sprooten J., Hong Y., Wall R., et al. Single cell dynamics of tumour specificity vs. bystander activity in CD8+T cells define the diverse immune landscapes in colorectal cancer. Cell Discov. 2023;9 - PMC - PubMed

Publication types