. 2024 Feb;626(8001):979-983.
doi: 10.1038/s41586-024-07040-9. Epub 2024 Jan 17.

Sulfur dioxide in the mid-infrared transmission spectrum of WASP-39b

Diana Powell  1   2 Adina D Feinstein  3   4 Elspeth K H Lee  5 Michael Zhang  3 Shang-Min Tsai  6 Jake Taylor  7   8   9 James Kirk  10 Taylor Bell  11   12 Joanna K Barstow  13 Peter Gao  14 Jacob L Bean  3 Jasmina Blecic  15   16 Katy L Chubb  17 Ian J M Crossfield  18 Sean Jordan  19 Daniel Kitzmann  4 Sarah E Moran  20 Giuseppe Morello  21   22   23 Julianne I Moses  24 Luis Welbanks  25 Jeehyun Yang  26 Xi Zhang  27 Eva-Maria Ahrer  28   29 Aaron Bello-Arufe  30 Jonathan Brande  18 S L Casewell  31 Nicolas Crouzet  32 Patricio E Cubillos  33   34 Brice-Olivier Demory  5   35 Achrène Dyrek  36 Laura Flagg  37   38 Renyu Hu  30   39 Julie Inglis  39 Kathryn D Jones  5 Laura Kreidberg  40 Mercedes López-Morales  41 Pierre-Olivier Lagage  36 Erik A Meier Valdés  5 Yamila Miguel  32   42 Vivien Parmentier  43 Anjali A A Piette  14 Benjamin V Rackham  44   45 Michael Radica  8   9 Seth Redfield  46   47 Kevin B Stevenson  48 Hannah R Wakeford  49 Keshav Aggarwal  50 Munazza K Alam  14 Natalie M Batalha  51 Natasha E Batalha  52 Björn Benneke  8   9 Zach K Berta-Thompson  53 Ryan P Brady  54 Claudio Caceres  55   56   57 Aarynn L Carter  51 Jean-Michel Désert  58 Joseph Harrington  59 Nicolas Iro  60 Michael R Line  25 Joshua D Lothringer  61 Ryan J MacDonald  62 Luigi Mancini  33   40   63 Karan Molaverdikhani  64   65 Sagnick Mukherjee  51 Matthew C Nixon  66 Apurva V Oza  30 Enric Palle  22 Zafar Rustamkulov  67 David K Sing  67   68 Maria E Steinrueck  40 Olivia Venot  69 Peter J Wheatley  28   29 Sergei N Yurchenko  54
Affiliations

Sulfur dioxide in the mid-infrared transmission spectrum of WASP-39b

Diana Powell et al. Nature. 2024 Feb.

Abstract

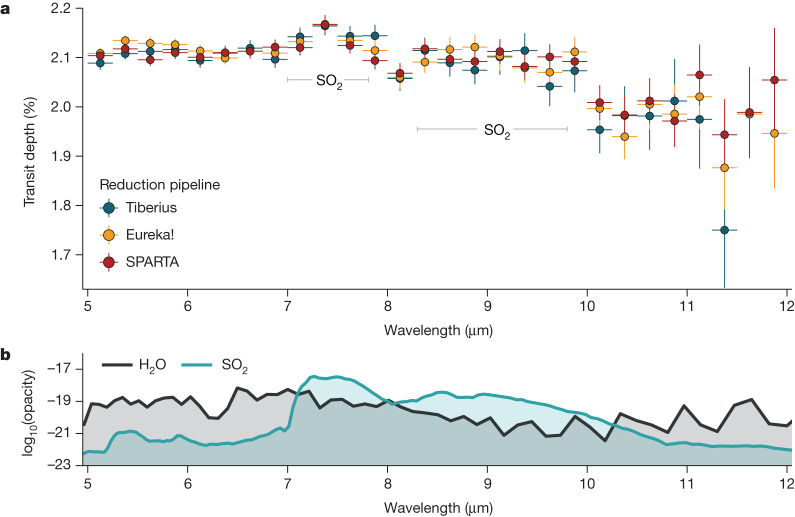
The recent inference of sulfur dioxide (SO2) in the atmosphere of the hot (approximately 1,100 K), Saturn-mass exoplanet WASP-39b from near-infrared JWST observations1-3 suggests that photochemistry is a key process in high-temperature exoplanet atmospheres4. This is because of the low (<1 ppb) abundance of SO2 under thermochemical equilibrium compared with that produced from the photochemistry of H2O and H2S (1-10 ppm)4-9. However, the SO2 inference was made from a single, small molecular feature in the transmission spectrum of WASP-39b at 4.05 μm and, therefore, the detection of other SO2 absorption bands at different wavelengths is needed to better constrain the SO2 abundance. Here we report the detection of SO2 spectral features at 7.7 and 8.5 μm in the 5-12-μm transmission spectrum of WASP-39b measured by the JWST Mid-Infrared Instrument (MIRI) Low Resolution Spectrometer (LRS)10. Our observations suggest an abundance of SO2 of 0.5-25 ppm (1σ range), consistent with previous findings4. As well as SO2, we find broad water-vapour absorption features, as well as an unexplained decrease in the transit depth at wavelengths longer than 10 μm. Fitting the spectrum with a grid of atmospheric forward models, we derive an atmospheric heavy-element content (metallicity) for WASP-39b of approximately 7.1-8.0 times solar and demonstrate that photochemistry shapes the spectra of WASP-39b across a broad wavelength range.


Conflict of interest statement

The authors declare no competing interests.

Figures

Fig. 1
Fig. 1. A sample of spectrophotometric light curves and residuals for the transit of WASP-39b observed with MIRI/LRS.
a, An exoplanet transit model multiplied by a systematics model (solid black line) was fitted to each light curve. b, The residuals to the best-fit models are shown for each light curve. We report the 1σ scatter in each light curve as the standard deviation of the out-of-transit residuals, with the ratio to the predicted photon noise in parentheses. The reduction is from Eureka!.
Fig. 2
Fig. 2. MIRI/LRS transmission spectra of WASP-39b derived using three independent reduction pipelines.
a, The spectrum is dominated by broad absorption features from SO2 at 7.7 and 8.5 μm and H2O across the entire wavelength coverage of MIRI/LRS. We define our uncertainties as 1σ. b, We present the log of opacities of dominant species in the spectrum in units of cm2 mol−1. The opacities were adopted from PLATON using ExoMol line lists, and assume atmospheric properties pressure, P = 1 mbar, and temperature, T = 1,000 K.
Fig. 3
Fig. 3. Free retrievals of the MIRI/LRS transmission spectrum of WASP-39b.
a, The spectrum from the Eureka! reduction (with 1σ uncertainties) is compared with the best-fit retrieved spectra and associated 1σ shaded regions from six free-retrieval codes. b, The corresponding posterior probability distributions of the volume mixing ratio (VMR) and associated 1σ uncertainties (points) for the SO2 abundance. The quoted log(SO2) ranges from the lowest to the highest 1σ bounds of all six posteriors. We chose the Eureka! reduction owing to its similar reduction steps to previous WASP-39b observations,,, and the fact that it provides the full-wavelength coverage of the observations. Results from the other two reductions for SO2 give broadly consistent results and are discussed further in Methods.
Fig. 4
Fig. 4. Comparison of four independent photochemical models with the observed MIRI/LRS transmission spectra of WASP-39b.
a, Comparison of morning and evening limb-averaged theoretical transmission spectra to the observations assuming a best-fit atmospheric metallicity of 7.5 times solar. b, Limb-averaged SO2 volume mixing ratio between 10 and 0.01 mbar as a function of metallicity for the four photochemical models. The shaded region represents the 1σ SO2 constraint from the free retrievals on the Eureka! reduction (Fig. 3). c, Dependence of VULCAN modelled transmission spectrum on atmospheric metallicity, as compared with the Eureka! reduction. The Tiberius reduction prefers a metallicity of 7.5 times solar, whereas the SPARTA reduction prefers 10 times solar (see Extended Data). The VULCAN models suggest that there is only a minor (<0.05%) difference expected for the SO2 feature at 7.7 μm when assuming a higher atmospheric metallicity, whereas the SO2 feature at 8.5 μm is more sensitive to subtle changes. The SO2 feature at 8.5 μm is fit well by the 7.5–10 times solar metallicity models.
Extended Data Fig. 1
Extended Data Fig. 1. Comparison of the different background modelling and subtraction per each pipeline.
a, A median out-of-transit image of the MIRI/LRS detector from the jwst pipeline’s Stage 2 processing. b, Background models from Eureka! (1), Tiberius (2) and SPARTA (3). c, Background-subtracted Stage 2 outputs from each pipeline. The smoothly varying background is expected for MIRI/LRS. There are no discrete features or sharp changes in the background at y pixels < 244, corresponding to λ = 10 μm, which has been seen in other observations. All images are given in Data Numbers per second (DN s−1). The Tiberius reduction did not extract spectra as far red as Eureka! and SPARTA, which is the cause of the horizontal bar in panels b2 and c2.
Extended Data Fig. 2
Extended Data Fig. 2. MIRI/LRS white and spectrophotometric light curves from the three independent reduction pipelines used in this work.
a, We quote the out-of-transit ppm scatter in each light curve in the figure. We define the out-of-transit time as −0.135 < t (days) < −0.07 and 0.07 < t (days) < 0.14; these times were selected as they ignore the exponential ramp at the beginning of the observations and do not include any data in transit ingress/egress. b, The residuals and errors of the data compared with the best-fit transit model. Errors quoted are 1σ. c, The spectrophotometric light curves are normalized by the out-of-transit flux during the observations. All reductions show consistent out-of-transit scatter in all wavelength bins (Δλ = 0.25 μm). The white spaces in c1 are where values in the light curve are NaN.
Extended Data Fig. 3
Extended Data Fig. 3. The best-fitting cloudy PICASO grid models (gold lines) are shown with and without SO2 compared with the JWST MIRI/LRS data (black points) from the Eureka! reduction.
a, With SO2. b, Without SO2. Also shown are the best fits with H2O (dark teal), SO2 (red), CH4 (light teal) and clouds (navy blue) removed from the model, demonstrating which absorbers dominate the opacity of the best-fit model. When SO2 is not included in the model, excess CH4 compensates for its absorption in the Eureka! reduction, as shown in the lower panel.
Extended Data Fig. 4
Extended Data Fig. 4. Retrieved log of SO2 and H2O volume mixing ratio posteriors from all six retrieval codes and three data reductions.
Median values and 1σ uncertainties are given by the coloured points. VMR, volume mixing ratio.

References

    1. JWST Transiting Exoplanet Community Early Release Science Team. Identification of carbon dioxide in an exoplanet atmosphere. Nature614, 649–652 (2023). 10.1038/s41586-022-05269-w - DOI - PMC - PubMed
    1. Alderson, L. et al. Early Release Science of the exoplanet WASP-39b with JWST NIRSpec G395H. Nature614, 664–669 (2023). 10.1038/s41586-022-05591-3 - DOI - PMC - PubMed
    1. Rustamkulov, Z. et al. Early Release Science of the exoplanet WASP-39b with JWST NIRSpec PRISM. Nature614, 659–663 (2023). 10.1038/s41586-022-05677-y - DOI - PMC - PubMed
    1. Tsai, S.-M. et al. Photochemically produced SO2 in the atmosphere of WASP-39b. Nature617, 483–487 (2023). 10.1038/s41586-023-05902-2 - DOI - PMC - PubMed
    1. Zahnle, K., Marley, M. S., Freedman, R. S., Lodders, K. & Fortney, J. J. Atmospheric sulfur photochemistry on hot Jupiters. Astrophys. J.701, L20–L24 (2009).10.1088/0004-637X/701/1/L20 - DOI