. 2024 Feb 27;11(2):ENEURO.0154-22.2023.
doi: 10.1523/ENEURO.0154-22.2023. Print 2024 Feb.

Markerless Mouse Tracking for Social Experiments

Affiliations

Markerless Mouse Tracking for Social Experiments

Van Anh Le et al. eNeuro. .

Abstract

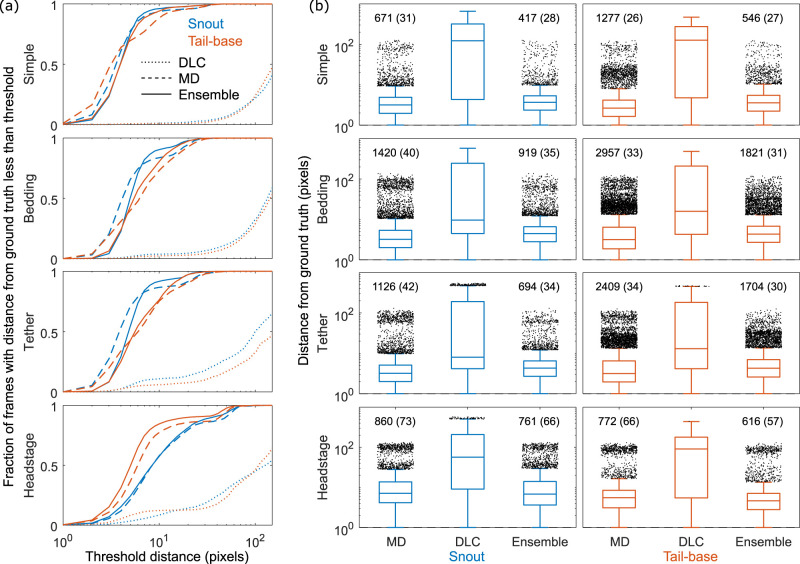
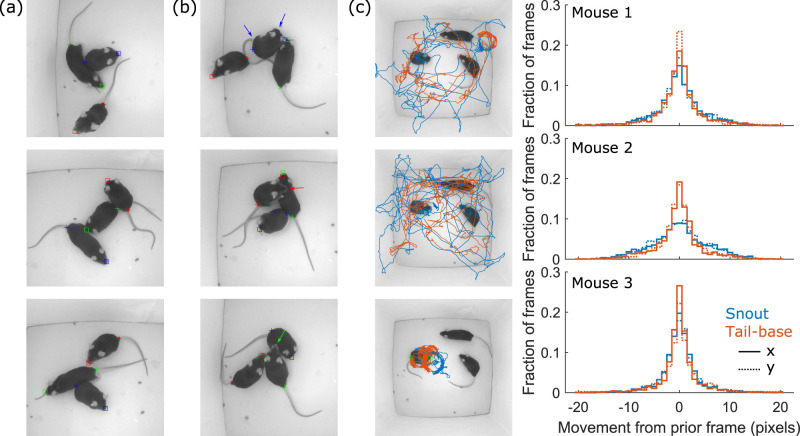
Automated behavior quantification in socially interacting animals requires accurate tracking. While many methods have been very successful and highly generalizable to different settings, issues of mistaken identities and lost information on key anatomical features are common, although they can be alleviated by increased human effort in training or post-processing. We propose a markerless video-based tool to simultaneously track two interacting mice of the same appearance in controlled settings for quantifying behaviors such as different types of sniffing, touching, and locomotion to improve tracking accuracy under these settings without increased human effort. It incorporates conventional handcrafted tracking and deep-learning-based techniques. The tool is trained on a small number of manually annotated images from a basic experimental setup and outputs body masks and coordinates of the snout and tail-base for each mouse. The method was tested on several commonly used experimental conditions including bedding in the cage and fiberoptic or headstage implants on the mice. Results obtained without any human corrections after the automated analysis showed a near elimination of identities switches and a ∼15% improvement in tracking accuracy over pure deep-learning-based pose estimation tracking approaches. Our approach can be optionally ensembled with such techniques for further improvement. Finally, we demonstrated an application of this approach in studies of social behavior of mice by quantifying and comparing interactions between pairs of mice in which some lack olfaction. Together, these results suggest that our approach could be valuable for studying group behaviors in rodents, such as social interactions.

Keywords: computer vision; deep learning; mouse tracking; social behavior.


Conflict of interest statement

The authors declare no competing financial interests.

Figures

Figure 1.
Figure 1.
Snapshots taken from the videos illustrating 12 experimental setups used in the mouse tracking (MT) dataset. Details for each of the settings are in Table 1.
Figure 2.
Figure 2.
The pipeline of the proposed algorithm for MT and feature detection after training is complete. Traditional segmentation (details in Extended Data Fig. 2-1) can be optionally used to reduce computational cost. User can select to bypass this and use Mask R-CNN exclusively. Our approach generates body masks and snout and tail-base coordinates. It can optionally be ensembled with deep-learning-based pose estimation techniques such as DLC or SLEAP for further improvement of snout and tail-base detection.
Figure 3.
Figure 3.
Training and evaluation of the Mask R-CNN. a, Example images with labels taken from the auto-training set. b, Example images with human annotations taken from the manual-training set. Extended Data Figure 3-1 compares human annotation required for all approaches. c, Mask, bounding box, and classification losses for fivefold cross-validation on the auto-training set in which the dataset was split into five sets, the model trained on four splits, and validated on the left-out split. d, Average precision metrics (AP, AP75, and AP50) of test data for three splits of training data vs. number of training images corresponding to 0, 20, 40, 60, and 80% of the manual-training set. e, Kernel density estimate of AP of the auto-trained model and dual-trained model groups on test data for the first split of the training set which account for 20–80% of the manual-training set. f, Visualization of the outputs of the auto-trained model and dual-trained model groups with 20, 40, 60, and 80% training fraction from the manual-training set (red) and human annotation (yellow). Each row shows performance on a different frame. Number pairs are predicted mask confidence and IoU.
Figure 4.
Figure 4.
Percentage of frames with segmentation errors over 12 videos in 4 categories in the MT dataset. The auto-trained model is built using the auto-training set that required no human effort and does not have mice in close proximity. The dual-trained model is a fine-tuned version of the auto-trained model incorporating manually segmented images of closely interacting mice from the manual-training set. Manual-trained model is trained only by the manual-training set.
Figure 5.
Figure 5.
Comparison of our approaches—MD and ensemble—with DLC and SLEAP. The upper panel shows average MOTA and the lower panel shows total instances of switched identities across all 12 videos in the 4 categories.
Figure 6.
Figure 6.
Performance across 12 videos in 4 categories. a, Fraction of frames with the mean distance between model predictions and human annotations below a varying threshold. b, Boxplots showing errors in MD, DLC, and ensemble models. Plots show median, 25th and 75th percentile, and outliers defined as >75th percentile +1.5 times the inter-quartile range. Text above outliers show number of outliers and average outlier within parentheses. Results for individual videos are shown in Extended Data Figures 6-1–6-3.
Figure 7.
Figure 7.
Examples of a, good and b, visibly inaccurate snout and tail-base detection in a group of three mice. c, Snout and tail-base trajectories for each animal along with a distribution of frame-to-frame movement in x and y coordinates.
Figure 8.
Figure 8.
Application of the markerless MT approach showing that loss of olfaction through ablation of the main olfactory epithelium impairs social recognition behaviors in mice. a, Mice were housed in same sex pairs; one mouse per pair was a control (intranasal saline-treated) or anosmic (intranasal ZnSO4-treated). b, Experimental paradigm for social recognition test: anosmic/control mice acted as “observers” (Obs) and were presented with either a familiar demonstrator (Dem) or an unfamiliar demonstrator. c, Left: behavioral ethograms of control (top) and anosmic (bottom) observers while interacting with a familiar or unfamiliar demonstrator. Each color indicates when the snout of the observer was directed toward the anogenital (blue), body (orange), or head/face (green) region of the demonstrator. Right: cumulative distributions of each of the social investigative behaviors for control (top) and anosmic (bottom) observers toward familiar (solid line) or unfamiliar (dotted line) demonstrators. d, Total number of social investigation events by control (top) and anosmic (bottom) observers directed toward the anogenital, body, or head/face region of familiar versus unfamiliar demonstrators. e, Average duration of each social investigation event. f, Interval between social investigation events. *p < 0.05; **p < 0.01; ***p < 0.001. Paired t-test comparing social investigation toward a familiar versus unfamiliar demonstrator. Analysis of demonstrator mice behavior in Extended Data Figure 8-1.
Figure 9.
Figure 9.
Application of the markerless MT approach showing that anosmic mice spend more time in contact (non-snout-directed contact) with unfamiliar versus familiar demonstrators. a, Left: behavioral ethograms of control (top) and anosmic (bottom) observers while interacting with a familiar or unfamiliar demonstrator. Each brown bar indicates when the mice were in contact (touching) that was not as a result of snout-directed investigation by the observer or demonstrator. Right: cumulative distributions of touching in pairs of control (top) or anosmic (bottom) observers with familiar (solid line) or unfamiliar (dotted line) demonstrators. Bar graph shows total time spent touching during the first minute of the 5-min period. b, Total number of touching events between control (left) or anosmic (right) observers, with familiar or unfamiliar demonstrators. c, The average duration of each touching event. d, The inter-event interval between touching events. *p < 0.05. Paired t-test comparing touching between observers and familiar versus unfamiliar demonstrators.
Figure 10.
Figure 10.
Application of the markerless MT approach showing distance traveled and velocities of pairs of mice (observer + demonstrator). a, An example of raw tracking data of observers (red) and demonstrators (blue), where observers were control (top) or anosmic (bottom) with familiar (left) or unfamiliar demonstrators (right). b, Total distance traveled by observers and their familiar or unfamiliar demonstrators where the observer was control (top) or anosmic (bottom). c, Total time spent stationary by observers and their familiar or unfamiliar demonstrators where the observer was control (top) or anosmic (bottom). d, Examples of velocities (1 s bins) of observers (red) and demonstrators (blue) with familiar or unfamiliar demonstrators where the observer was control (top) or anosmic (bottom). Inset graphs show Pearson correlation analyses of observer velocities versus demonstrator velocities. Data for all animals are shown in Extended Data Table 10-1. b and c, *p < 0.05, one-way ANOVA with Sidak’s multiple comparisons test.

Similar articles

Cited by

References

    1. Abdulla W (2017) Mask R-CNN for object detection and instance segmentation on Keras and TensorFlow. Github. Available at: https://github.com/matterport/Mask_RCNN.
    1. Bernardin K, Stiefelhagen R (2008) Evaluating multiple object tracking performance: the clear MOT metrics. EURASIP J Image Video Process 2008:1–10. 10.1155/2008/246309 - DOI
    1. Branson K, Robie AA, Bender J, Perona P, Dickinson MH (2009) High-throughput ethomics in large groups of Drosophila. Nat Methods 6:451–457. 10.1038/nmeth.1328 - DOI - PMC - PubMed
    1. Burgos-Artizzu XP, Dollár P, Lin D, Anderson DJ, Perona P (2012) Social behavior recognition in continuous video. In: IEEE conference on computer vision and pattern recognition, pp 1322–1329, Providence, RI, USA.
    1. Burn CC, Deacon RM, Mason GJ (2008) Marked for life? Effects of early cage-cleaning frequency, delivery batch, and identification tail-marking on rat anxiety profiles. Dev Psychobiol J Int Soc Dev Psychobiol 50:266–277. 10.1002/dev.v50:3 - DOI - PubMed

LinkOut - more resources