. 2024 Mar;11(12):e2307870.
doi: 10.1002/advs.202307870. Epub 2024 Jan 17.

Enhanced Photodynamic Therapy Synergizing with Inhibition of Tumor Neutrophil Ferroptosis Boosts Anti-PD-1 Therapy of Gastric Cancer

Affiliations

Enhanced Photodynamic Therapy Synergizing with Inhibition of Tumor Neutrophil Ferroptosis Boosts Anti-PD-1 Therapy of Gastric Cancer

Xudong Zhu et al. Adv Sci (Weinh). 2024 Mar.

Abstract

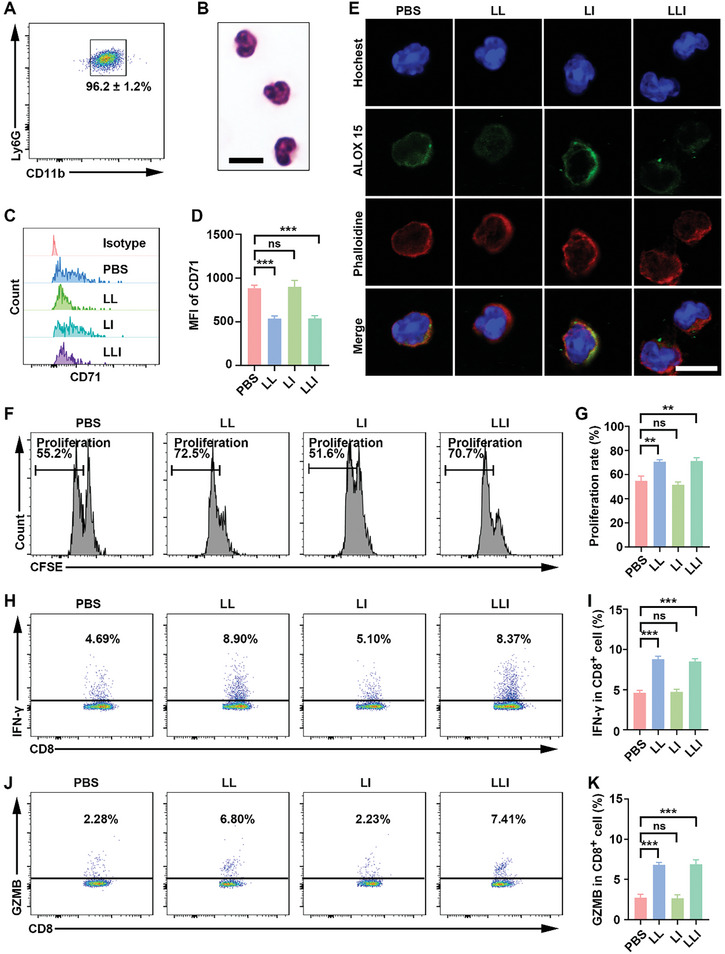
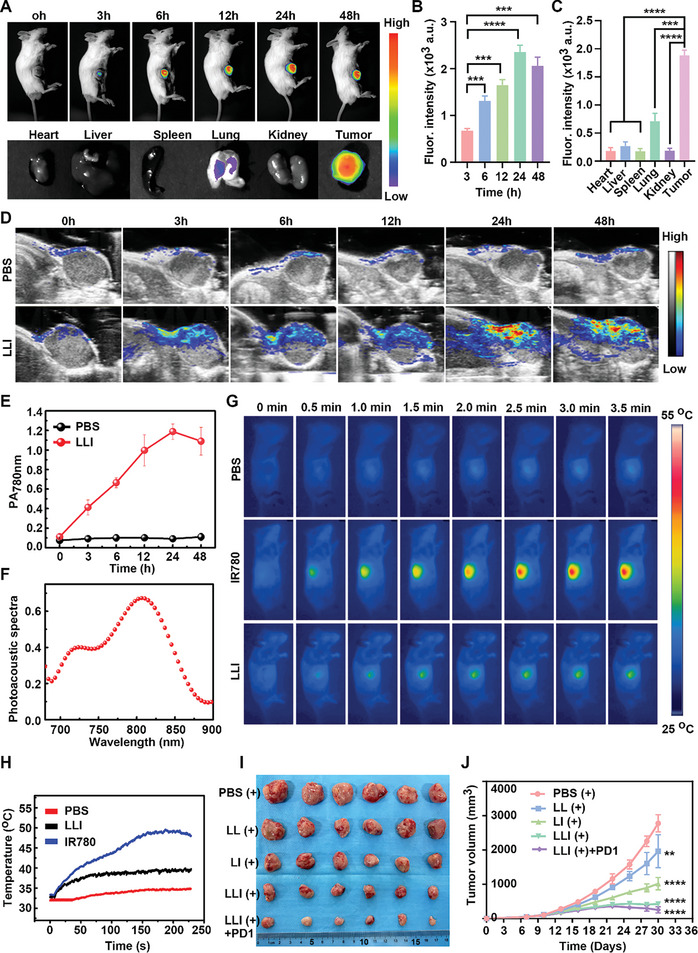
For tumor treatment, the ultimate goal in tumor therapy is to eliminate the primary tumor, manage potential metastases, and trigger an antitumor immune response, resulting in the complete clearance of all malignant cells. Tumor microenvironment (TME) refers to the local biological environment of solid tumors and has increasingly become an attractive target for cancer therapy. Neutrophils within TME of gastric cancer (GC) spontaneously undergo ferroptosis, and this process releases oxidized lipids that limit T cell activity. Enhanced photodynamic therapy (PDT) mediated by di-iodinated IR780 (Icy7) significantly increases the production of reactive oxygen species (ROS). Meanwhile, neutrophil ferroptosis can be triggered by increased ROS generation in the TME. In this study, a liposome encapsulating both ferroptosis inhibitor Liproxstatin-1 and modified photosensitizer Icy7, denoted LLI, significantly inhibits tumor growth of GC. LLI internalizes into MFC cells to generate ROS causing immunogenic cell death (ICD). Simultaneously, liposome-deliver Liproxstatin-1 effectively inhibits the ferroptosis of tumor neutrophils. LLI-based immunogenic PDT and neutrophil-targeting immunotherapy synergistically boost the anti-PD-1 treatment to elicit potent TME and systemic antitumor immune response with abscopal effects. In conclusion, LLI holds great potential for GC immunotherapy.

Keywords: ferroptosis; gastric cancer; immunotherapy; neutrophils; photodynamic therapy.


Conflict of interest statement

The authors declare no conflict of interest.

Figures

Scheme 1
Scheme 1
Schematic illustration of the preparation of multifunctional nanodrug utilizing liposome to co‐encapsulate ferroptosis inhibitor Liproxstatin‐1 and modified photosensitizer Icy7 (denoted LLI). LLI‐based immunogenic PDT and neutrophil‐targeting immunotherapy synergistically boosted the anti‐PD‐1 therapy to elicit potent TME and systemic antitumor immunity with abscopal effects.
Figure 1
Figure 1
Intra‐tumoral neutrophils were susceptible to ferroptosis and created an immunosuppressive tumor microenvironment. A) Representative FACS images showed the ferroptosis of neutrophils from the paired peripheral blood, normal tissue, and tumor tissue of patients with gastric cancer. B,C) CD71 was measured and analyzed, n = 10. D) Immunofluorescence analysis of neutrophils (hochest; blue), (CD71; green), and (phalloidine; red) in gastric cancer samples. Scale bar, 25 µm. E) Transmission electron microscope images of neutrophils in gastric cancer samples. Scale bars, 2 µm, and 500 nm. (F and G) Correlation analysis of the MFI of CD71 with CD8+ and CD4+ T cells, n = 10. (H and I) Correlation analysis of the MFI of CD71 with the M1 and M2 TAMs, n = 10. (J) Correlation analysis of the MFI of CD71 with the maturation of DC, n = 10. (Data were presented as the mean ± SD; **** p < 0.0001).
Figure 2
Figure 2
Characterization of nanodrugs. A) Chemical structures of IR780 and Icy7, and photographs of nanodrugs. B) Size distribution and transmission electron microscope image of LLI. C) Absorption spectra of LL, LI, LLI, and free Icy7 in PBS, and free Icy7 in MeOH. D) Fluorescence spectrum of LL, LI, LLI, and free Icy7 in PBS, and free Icy7 in MeOH. (E–G) Absorption spectra of 1,3‐diphenylisobenzofuran (DPBF), and degradation of DPBF absorption corresponds to the production of 1O2 induced by IR780 and Icy7 in MeOH under 808 nm light irradiation (0.5 W cm−2). (H,I) Thermal images of IR780 and Icy7 solution in PBS recorded by FLIR thermal mapping camera under 808 nm light irradiation.
Figure 3
Figure 3
Cytotoxicity of nanodrugs on MFC cells in vitro. A,B) Cytotoxicity of LL, LI, and LLI without or with light irradiation in vitro (808 nm, 0.5 W/cm2, 1 min) (n = 3). C) LLI was internalized into MFC cells (hochest; blue), (mitochondria; green), and (LLI; red). Scale bar, 50 µm. D) colocalization of LLI with mitochondria. Scale bar, 25 µm. (E and F) The apoptosis rate of MFC cells was determined by flow cytometry in different groups, n = 3. G) Mitochondria membrane potential of MFC cells in different groups (JC‐1 monomers; green), (JC‐1 aggregates; red), n = 3. Scale bar, 50 µm. H) Live/dead cell staining of MFC cells in different groups (liver cells; green), and (dead cells; red), n = 3. Scale bar, 100 µm. (Data were presented as the mean ± SD; **** p < 0.0001).
Figure 4
Figure 4
PDT‐mediated immunogenic cell death of MFC cells in vitro. A,B) ROS production in MFC cells after various treatments detected by flow cytometry, n = 3. (C) Fluorescence imaging of ROS production in MFC cells after various treatments (hochest; blue), and (DCF; green), n = 3. Scale bar, 100 µm. (D) Fluorescence imaging of CRT in MFC cells after various treatments (hochest; blue), and (CRT; green), n = 3. Scale bar, 25 µm. (E and F) CD71 expression of MFC cells detected by flow cytometry after various treatments, n = 3. (G and H) DCs maturation was determined by flow cytometry after being cocultured with nanodrugs‐pretreated MFC cells, n = 3. (Data were presented as the mean ± SD, * p < 0.05, *** p < 0.001, and ns, not significant).
Figure 5
Figure 5
Inhibition of neutrophil ferroptosis enhanced the function of CD8+ T cells. A) purity of mouse neutrophils sorted from MFC tumors by flow cytometry, n = 3. B) Wright staining of sorted neutrophils. C,D) CD71 expression of neutrophils detected by flow cytometry after various treatments, n = 3. E) Fluorescence imaging of ALOX 15 in neutrophils after various treatments (hochest; blue), and (ALOX 15; green) and (phalloidine; red). Scale bar, 25 µm. F,G) Proliferation of CD8+ T cells determined by flow cytometry after being cocultured with nanodrug‐pretreated neutrophils, n = 3. H,I) IFN‐γ expression of CD8+ T cells determined by flow cytometry after being cocultured with nanodrug‐pretreated neutrophils, n = 3. J,K) GZMB expression of CD8+ T cells determined by flow cytometry after being cocultured with nanodrug‐pretreated neutrophils, n = 3. (Data were presented as the mean ± SD, ** p < 0.01, *** p < 0.001, and ns, not significant).
Figure 6
Figure 6
Tumor targeting and synergistic anti‐tumor therapy of LLI. A–C) In vivo fluorescence imaging of MFC tumor‐bearing mice at different time points after LLI injection via tail vein and ex vivo fluorescence imaging of main organs and tumors at 48 h after injection. D) Representative photoacoustic (PA) images of tumor regions in living mice at different time points after intravenous injection of LLI (780 nm, 0.5 W cm−2). E) Real‐time PA intensity profiles of tumor areas in (D), n = 3. F) PA spectra of LLI. G) Thermal images of MFC tumor‐bearing mice at different time points after intravenous injection of different solutions following laser irradiation (808 nm, 0.5 W cm−2). H) Tumor temperature changes at different time points after intravenous injection of different solutions following laser irradiation (808 nm, 0.5 W cm−2). I) Macroscopic image of tumor tissues from mice receiving various treatments, n = 6. J) Tumor growth curve of mice receiving various nanodrugs treatment, n = 6. (Data were presented as the mean ± SD, ** p < 0.01, *** p < 0.001, and **** p < 0.0001).
Figure 7
Figure 7
Nano drugs enhanced anti‐tumor immune responses in MFC tumors. A,B) CD71 expression of neutrophils in tumor tissues determined by flow cytometry after different treatments (gated on CD11b+Ly6G+ cells), n = 6. C–E) The percentage of CD4+ and CD8+ T cells in tumor tissues was determined by flow cytometry after different treatments (gated on CD3+ T cells), n = 6. F) The percentage of M1 and M2 TAMs in tumor tissues was determined by flow cytometry after different treatments (gated on F4/80+ cells), n = 6. G) The percentage of mature DCs in tumor tissues determined by flow cytometry after different treatments (gated on CD11c+ cells), n = 6. H) Statistical analysis of the ratios of CD8+ to CD4+ T cells in different groups, n = 6. I–K) Statistical analysis of the percentage of M1 TAMs, M2 TAMs, and the ratios of M2 to M1 TAMs in different groups, n = 6. L) Statistical analysis of DC maturation (CD80+CD86+ cells) in different groups, n = 6. (Data were presented as the mean ± SD, * p < 0.05, ** p < 0.01, *** p < 0.001, and **** p < 0.0001).
Figure 8
Figure 8
The synergistic effect of nanodrug contributed to the anti‐PD‐1 antibody treatment. A) PD‐L1 expression on CD11b+ cells in tumor tissues determined by flow cytometry after different treatments (gated on CD11b+ cell), n = 6. B) PD‐L1 expression on CD11c+ cells in tumor tissues determined by flow cytometry after different treatments (gated on CD11c+ cell), n = 6. C) Production of IFN‐γ and GZMB in CD8+ T cells determined by flow cytometry after different treatments (gated on CD8+ T cell), n = 6. D) The percentage of effector memory T (TEMs) cells in spleens determined by flow cytometry after different treatments (gated on CD8+ T cell), n = 6. E,F) Statistical analysis of the percentage of PD‐L1 on CD11b+ cells and CD11c+ cells in tumor tissues after different treatments, n = 6. G,H) Statistical analysis of the percentage of IFN‐γ and GZMB in CD8+ T cells after different treatments, n = 6. I) Statistical analysis of the percentage of TEMs in spleens after different treatments, n = 6. (Data were presented as the mean ± SD, ** p < 0.01, **** p < 0.0001, and ns, not significant).

Similar articles

Cited by

References

    1. Sung H., Ferlay J., Siegel R. L., Laversanne M., Soerjomataram I., Jemal A., Bray F., CA Cancer J. Clin. 2021, 71, 209. - PubMed
    1. Ma X., Wang G., Fan H., Li Z., Chen W., Xiao J., Ni P., Liu K., Shen K., Wang Y., Xu Z., Yang L., Cell Death Discovery 2022, 8, 20. - PMC - PubMed
    1. Shitara K., Ajani J. A., Moehler M., Garrido M., Gallardo C., Shen L., Yamaguchi K., Wyrwicz L., Skoczylas T., Bragagnoli A. C., Liu T., Tehfe M., Elimova E., Bruges R., Zander T., De Azevedo S., Kowalyszyn R., Pazo‐Cid R., Schenker M., Cleary J. M., Yanez P., Feeney K., Karamouzis M. V., Poulart V., Lei M., Xiao H., Kondo K., Li M., Janjigian Y. Y., Nature 2022, 603, 942. - PMC - PubMed
    1. Janjigian Y. Y., Kawazoe A., Yañez P., Li N., Lonardi S., Kolesnik O., Barajas O., Bai Y., Shen L., Tang Y., Wyrwicz L. S., Xu J., Shitara K., Qin S., Van Cutsem E., Tabernero J., Li L., Shah S., Bhagia P., Chung H. C., Nature 2021, 600, 727. - PMC - PubMed
    1. Yuan L., Xu Z.‐Y., Ruan S.‐M., Mo S., Qin J.‐J., Cheng X.‐D., Mol. Cancer 2020, 19, 96. - PMC - PubMed