. 2024 Jan 17;15(1):584.
doi: 10.1038/s41467-023-44264-1.

High-content screening identifies a small molecule that restores AP-4-dependent protein trafficking in neuronal models of AP-4-associated hereditary spastic paraplegia

Affiliations

High-content screening identifies a small molecule that restores AP-4-dependent protein trafficking in neuronal models of AP-4-associated hereditary spastic paraplegia

Afshin Saffari et al. Nat Commun. .

Abstract

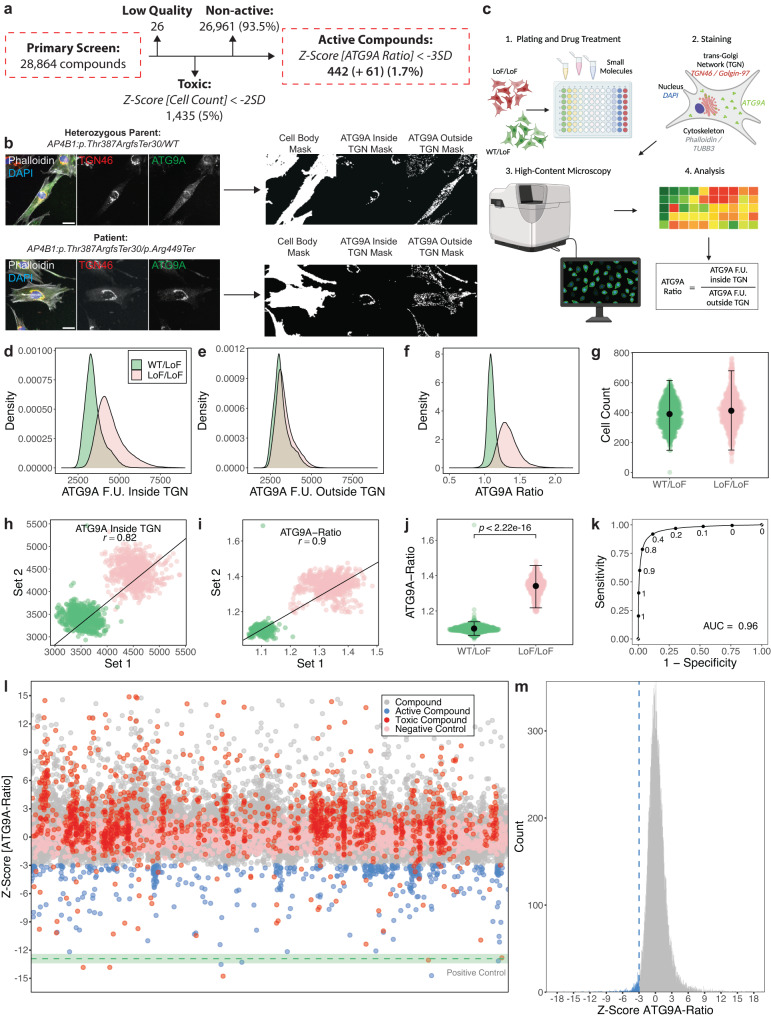
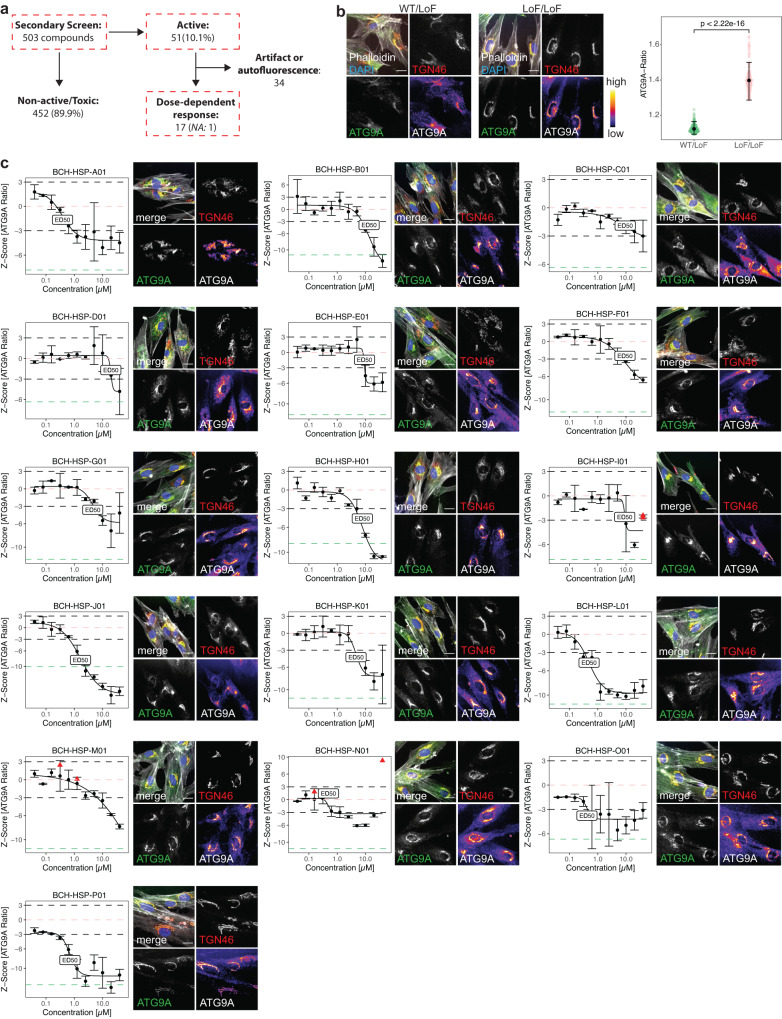
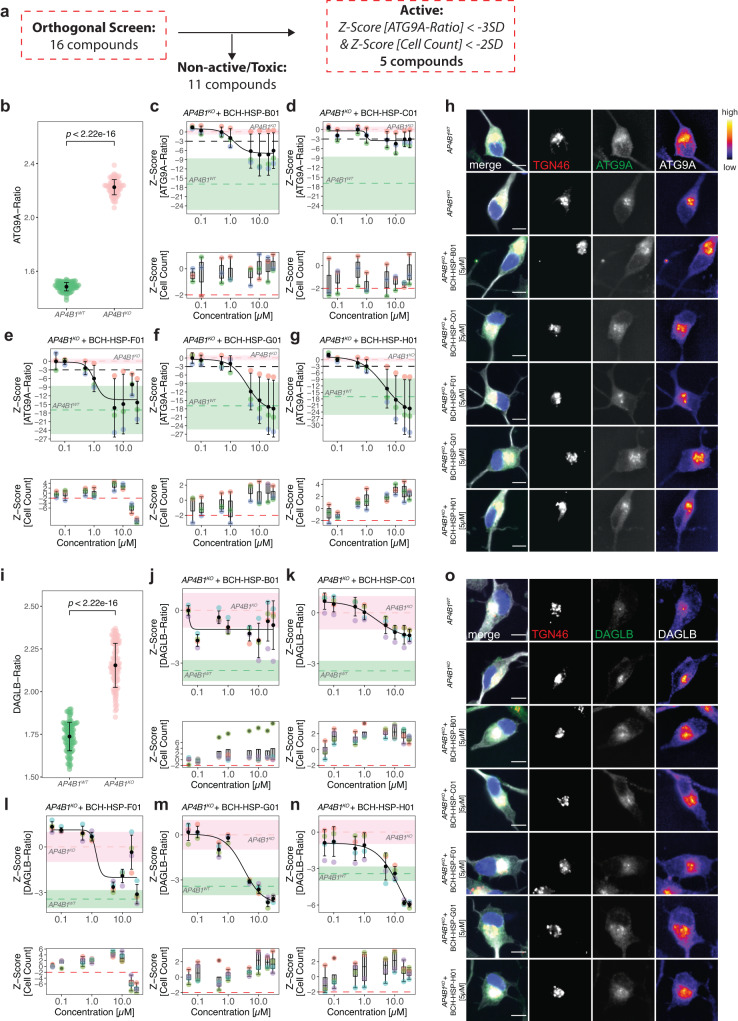
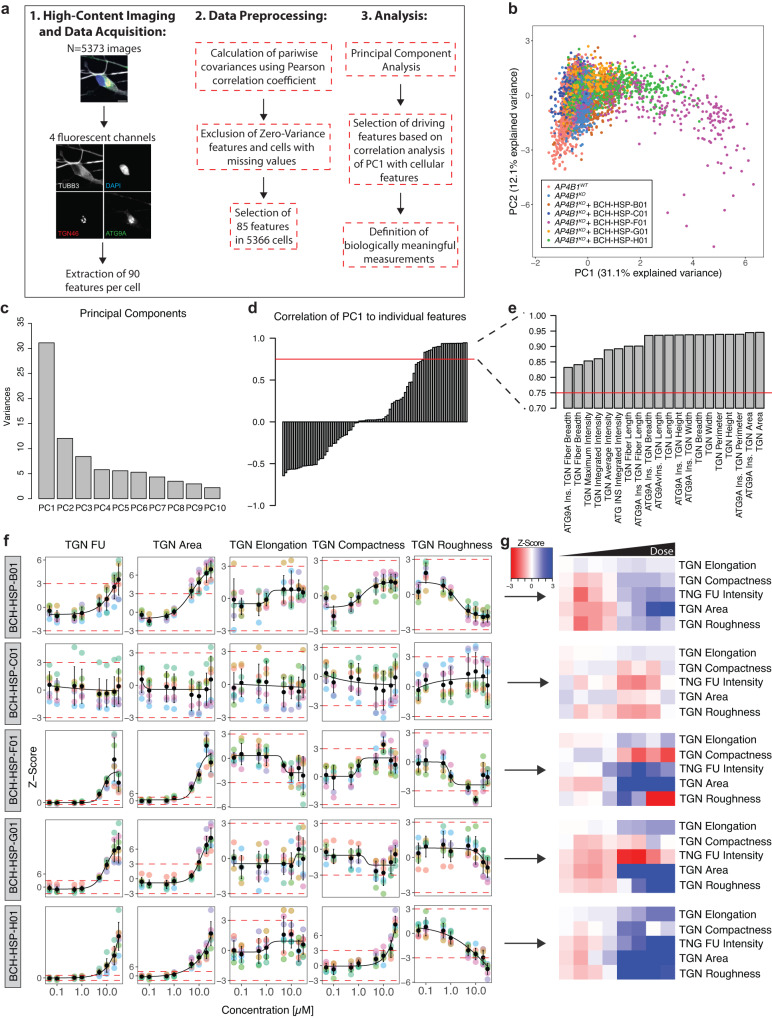
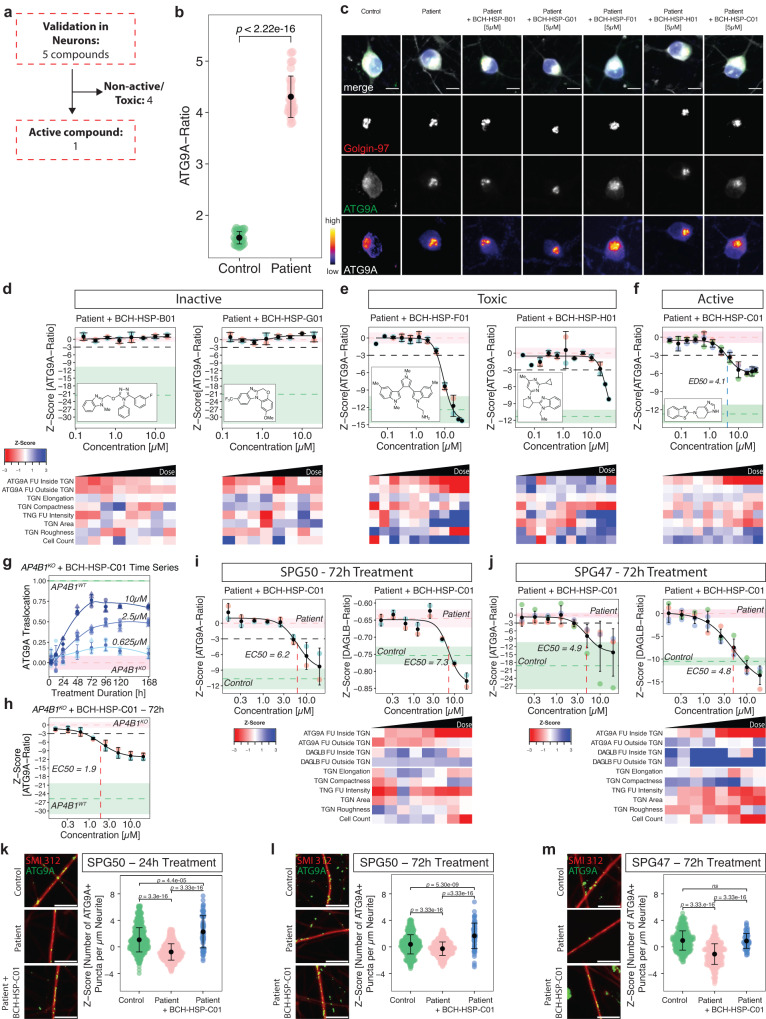
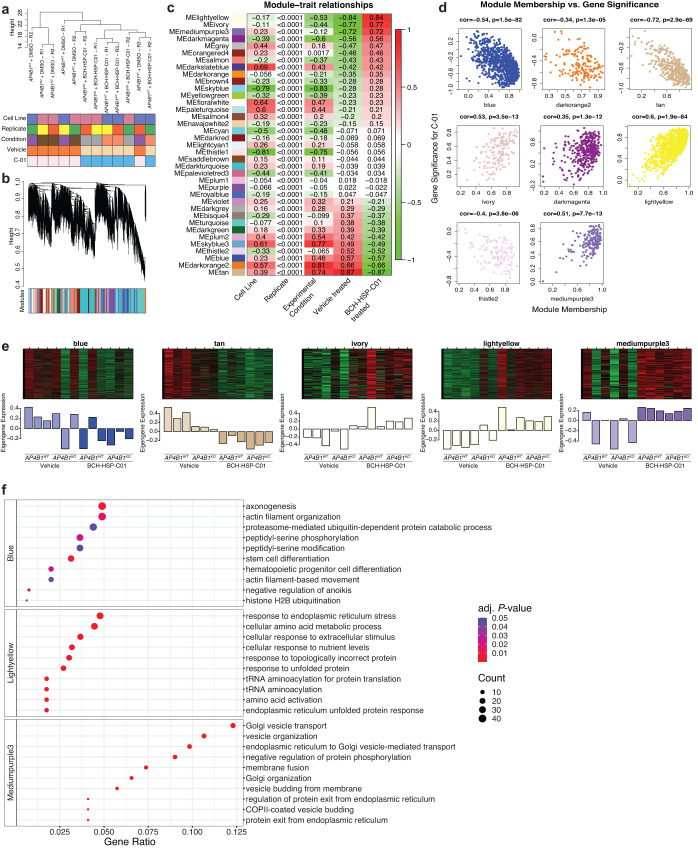
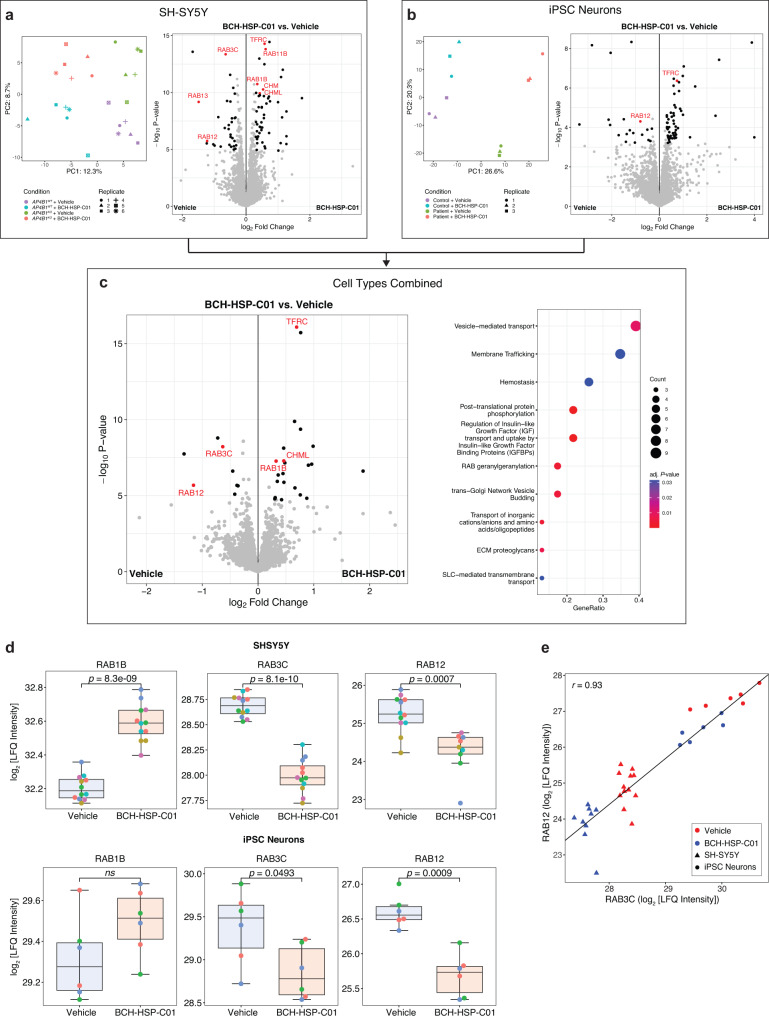
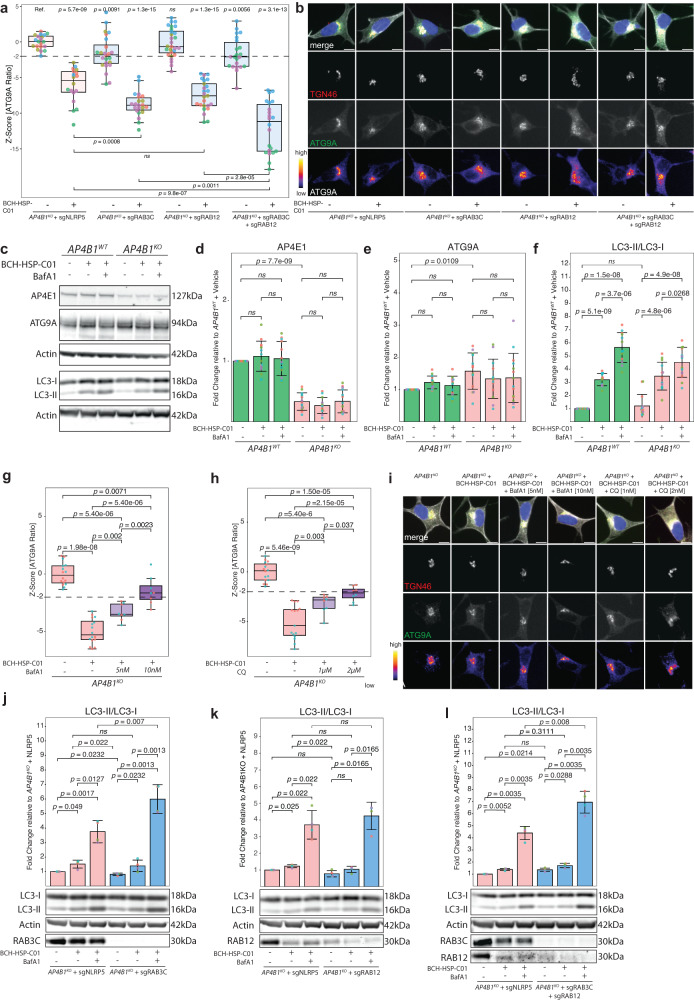
Unbiased phenotypic screens in patient-relevant disease models offer the potential to detect therapeutic targets for rare diseases. In this study, we developed a high-throughput screening assay to identify molecules that correct aberrant protein trafficking in adapter protein complex 4 (AP-4) deficiency, a rare but prototypical form of childhood-onset hereditary spastic paraplegia characterized by mislocalization of the autophagy protein ATG9A. Using high-content microscopy and an automated image analysis pipeline, we screened a diversity library of 28,864 small molecules and identified a lead compound, BCH-HSP-C01, that restored ATG9A pathology in multiple disease models, including patient-derived fibroblasts and induced pluripotent stem cell-derived neurons. We used multiparametric orthogonal strategies and integrated transcriptomic and proteomic approaches to delineate potential mechanisms of action of BCH-HSP-C01. Our results define molecular regulators of intracellular ATG9A trafficking and characterize a lead compound for the treatment of AP-4 deficiency, providing important proof-of-concept data for future studies.


Conflict of interest statement

This work was supported by a joint research agreement between Boston Children’s Hospital and Mitobridge Inc., now owned by Astellas Pharmaceuticals Inc. D.E.F. has served as a consultant to Health Advances LLC, has received speaker honoraria from the Movement Disorders Society and publishing royalties from Cambridge University Press. M.Sa. reports grant support from Novartis, Biogen, Astellas, Aeovian, Bridgebio, and Aucta unrelated to this project. He has served on Scientific Advisory Boards for Novartis, Roche, Regenxbio, SpringWorks Therapeutics, Jaguar Therapeutics, and Alkermes. The remaining authors declare no competing interests.

Figures

Fig. 1
Fig. 1. Establishment of a cell-based phenotypic small molecule screening platform using ATG9A translocation as a surrogate for AP-4 function and primary screening of 28,864 small molecule compounds.
a Overview of the primary screen of 28,864 small molecules in fibroblasts from a patient with bi-allelic LoF variants in AP4B1. b Illustration of the automated image analysis pipeline. Representative images of patient fibroblasts (negative control, LoF/LoF) and their sex-matched heterozygous parent (positive control, WT/LoF) are shown. Scale bar: 20 µm. c Overview of the high-throughput platform. Created with BioRender.com. df Distribution of ATG9A fluorescence intensities inside (d) and outside (e) the TGN, as well as ATG9A ratios (f) on a per cell basis (nWT/LoF = 99,927, nLoF/LoF = 119,522). g Cell counts as per well means of 1312 wells per condition from 82 independent plates. Means are shown as black dots; whiskers represent ±1.5 x IQR. h, i Replicate plots were generated by random sampling of the 82 plates from the primary screen in two groups. Similar positions on the assay plates were plotted against each other with respect to ATG9A fluorescence intensities inside the TGN (h) and ATG9A ratios (i). Replicate correlations were assessed by averaging the Pearson correlation coefficients (r) of 100 random sampling tests. j Discriminative power of the ATG9A ratio in separating positive and negative controls. Statistical testing was done using the Mann-Whitney U test. P-values are two-sided. Data points represent per well means of 1312 wells per condition from 82 independent plates. Means are shown as black dots; whiskers represent ±1.5 x IQR. k To test the robustness of separation of the ATG9A ratio between positive and negative controls, a dataset containing measurement for 99,927 WT/LoF and 119,522 LoF/LoF cells was partitioned into a training set (70% of data) and a test set (30%). The performance of a generalized linear model is shown in (k). The AUC is 0.96. l Impact of 28,864 compounds applied for 24 h at a concentration of 10 µM. Z-scores for the ATG9A ratio are shown. All data points represent per well means. The mean of the positive control is shown as a green dotted line. The green shaded areas represent ± 1 SD. m Distribution of Z-scores of all non-toxic 27,403 compounds. Active compounds are highlighted in blue.
Fig. 2
Fig. 2. Counter-screen in fibroblasts from AP-4-HSP patients confirms 16 compounds that lead to dose-dependent redistribution of ATG9A.
a Overview of the counter-screen of the 503 active compounds identified in the primary screen. To assess for dose-dependent effects, compounds were screened in AP-4-HSP patient-derived fibroblasts in 384-well microplates using 11-point titrations ranging from 40 nM to 40 µM. All concentrations were screened in duplicates. Active compounds were a priori defined as those reducing the ATG9A ratio by at least 3 SD compared to negative controls in more than one concentration. Toxicity was defined as a reduction of the cell count of at least 2 SD compared to negative controls. b Baseline differences in the ATG9A distribution in WT/LoF (n = 269) vs. LoF/LoF (n = 269) fibroblasts. Data points represent per well means of 269 wells per condition from 17 independent plates. Means are shown as black dots; whiskers represent ±1.5 x IQR. Statistical testing was done using the Mann-Whitney U test. P-values are two-sided. c Dose-response curves were fitted using a four-parameter logistic regression model, and EC50 concentrations were calculated. All concentrations were tested in biologic duplicates. Black dots and error bars represent mean ± 1 SD. Black dashed lines represent the a priori-defined thresholds of ± 3 SD compared to the negative control (LoF/LoF). Red triangles represent toxic concentrations based on the a priori-defined threshold of a reduction of cell counts of at least 2 SD compared to the negative control. The salmon-colored dashed line represents the mean of negative controls, while the green-colored dashed line depicts the mean of the positive controls (WT/LoF). Representative images of the EC50 are shown for each active compound. Representative images show a merge of the 4 channels: Phalloidin (gray), DAPI (blue), TGN46 (red) and ATG9A (green), as well as the TGN46 and ATG9A channels in greyscale. For a better illustration of differences in ATG9A signals, the fluorescence intensities of the ATG9A channel are additionally shown using a color lookup table. Scale bar: 20 µm. NA: not available.
Fig. 3
Fig. 3. Orthogonal assays in AP4B1KO SH-SY5Y cells confirm 5 active compounds.
a Overview of the orthogonal screen of 16 active compounds in differentiated AP4B1KO SH-SY5Y cells. b Baseline differences in ATG9A ratios of AP4B1WT vs. AP4B1KO SH-SY5Y cells were quantified from 160 AB4B1WT and 158 AB4B1KO wells from 5 assay plates. Means are shown as black dots; whiskers represent ±1.5 x IQR. Statistical testing was performed using the Mann-Whitney U test. P-values are two-sided. cg Dose-response curves for ATG9A ratios in AB4B1KO cells treated with different compounds. Data points represent per well means from 3 different assay plates. Black dots and error bars represent mean ± 1 SD. Dashed lines show mean Z-scores for positive (green) and negative (salmon) controls. Shaded areas represent ± 1 SD. h Representative images of the intracellular ATG9A distribution for individual compounds. The merged image shows beta-3 tubulin (gray), DAPI (blue), the TGN46 (red) and ATG9A (green). The TGN46 and ATG9A channels are further separately depicted in greyscale. Scale bar: 10 µm. i Baseline differences of DAGLB ratios in AP4B1WT vs. AP4B1KO cells were quantified from 192 AB4B1WT and 192 AB4B1KO wells from 4 assay plates. Means are shown as black dots; whiskers represent ±1.5 x IQR. Statistical testing was done using the Mann-Whitney U test. P-values are two-sided. jn Dose-response curves for DAGLB ratios in AB4B1KO cells treated with different compounds. All data points represent per well means from 4 different assay plates. Black dots and error bars represent mean ± 1 SD. Dashed lines show mean Z-scores for positive (green) and negative (salmon) controls. Shaded areas represent ± 1 SD. o Representative images of the intracellular DAGLB distribution for individual compounds. The merge shows beta-3 tubulin (gray), DAPI (blue), the TGN46 (red) and DAGLB (green). The TGN46 and DAGLB channels are further separately depicted in greyscale. Scale bar: 10 µm.
Fig. 4
Fig. 4. Multiparametric profiling of 5 active compounds in AP4B1KO SH-SY5Y cells.
a Multiparametric profiles of images of 5373 cells were acquired using 4 fluorescent channels. Scale bar: 10 µm. A total of 90 measurements per cell were generated for the cytoskeleton (beta-3 tubulin), the nucleus (DAPI), the TGN (TNG46) and ATG9A vesicles (ATG9A). The different steps of data preprocessing and phenotypic clustering using principal component analysis (PCA) are shown. b PCA shows different clusters of cells based on 85 phenotypic features. Experimental conditions are color-coded. The first two principal components (PC1 and PC2) explain 43.2% of the observed variance. c Bar plot summarizing the variance explained by the first 10 PCs. Most of the variance is explained by PC1 and, to a lesser degree, PC2. d Correlation analysis of PC1 with all 85 features using the Pearson correlation coefficient. The red dashed line represents a cutoff for correlations >0.75. e Zoom-in on selected features of interest showing a correlation with PC1 >0.75. f Measurements of TGN intensity and descriptors of TGN shape and network complexity for the individual hit compounds as line graphs. Data points represent per well means of 7 independent plates. Black dots and error bars represent mean ± 1 SD. g Information on TGN summarized using heatmap visualization.
Fig. 5
Fig. 5. BCH-HSP-C01 restores ATG9A and DAGLB trafficking in hiPSC-derived neurons from AP-4-HSP patients.
a Overview of 5 active compounds in hiPSC-derived cortical neurons from a patient with AP4M1-associated SPG50 compared to same-sex parent (heterozygous control). b Baseline differences of ATG9A ratios using per well means of 60 wells per condition from 5 plates. Means are shown as black dots; whiskers represent ±1.5 x IQR. Statistical testing was done using the Mann-Whitney U test. P-values are two-sided. c Representative images of hiPSC neurons treated with individual compounds at 5 µM for 24 h. Scale bar: 10 µm. df Dose-response curves for ATG9A ratios in hiPSC-derived neurons from a patient with SPG50 treated with individual compounds for 24 h, along with their morphological profiles depicted as heatmaps. All data points represent per well means of 2 (d, e), or 4 (f) independent differentiations. Black dots and error bars represent mean ± 1 SD. Dashed lines show mean Z-scores for positive (green) and negative (salmon) controls. Shaded areas represent ± 1 SD. g Time-series experiment of AP4B1KO SH-SY5Y cells treated with BCH-HSP-C01 with different concentrations and treatment durations. Data points represent per well means of two independent plates. Shapes indicate technical replicates. Dashed lines show mean Z-scores for positive (green) and negative (salmon) controls. Shaded areas represent ± 1 SD. h Dose-response curve for ATG9A ratios in AB4B1KO SH-SY5Y cells treated with BCH-HSP-C01 for 72 h. Data points represent per well means from two independent plates. Dashed lines show mean Z-scores for positive (green) and negative (salmon) controls. Shaded areas represent ± 1 SD. i, j Dose-response curves for ATG9A and DAGLB ratios in hiPSC-derived neurons from a patient with SPG50 (i) and SPG47 (j) after prolonged treatment with BCH-HSP-C01 for 72 h, along with morphologic profiles. Data points represent per well means of 2 independent differentiations. Dashed lines show mean Z-scores for positive (green) and negative (salmon) controls. Shaded areas represent ± 1 SD. km Quantification of ATG9A positive puncta per neurite length in hiPSC-derived neurons from a patient with SPG50 following 24 h of BCH-HSP-C01 treatment (k, nWT/LoF = 837, nLoF/LoF = 848, nLoF/LoF + BCH-HSP-C01 = 72), as well as hiPSC-derived neurons from patients with SPG50 (l, nWT/LoF = 843, nLoF/LoF = 843, nLoF/LoF + BCH-HSP-C01 = 70) and SPG47 (m, nWT/LoF = 424, nLoF/LoF = 428, nLoF/LoF + BCH-HSP-C01 = 70) treated for 72 h with BCH-HSP-C01. All data points represent means of single images from two independent differentiations. Statistical testing was done using the Mann-Whitney U test. P-values are two-sided and were adjusted for multiple testing using the Benjamini-Hochberg procedure. Representative images are shown for all experimental conditions. Scale bar: 10 µm.
Fig. 6
Fig. 6. Target deconvolution using bulk RNA sequencing and weighted gene co-expression network analysis in AP4B1KO SH-SY5Y cells treated with BCH-HSP-C01.
a Hierarchical clustering of 12 samples using average linkage showed two main clusters based on treatment with vehicle vs. BCH-HSP-C01, irrespective of cell line. b Cluster dendrogram of 18,506 expressed genes based on topological overlap. Clusters of co-expressed genes (“modules”) were isolated using hierarchical clustering and adaptive branch pruning. c Heatmap visualization of the correlation of gene expression profiles (“module eigengene”, ME) of each module with measured traits. Pearson correlation coefficients are shown for each cell of the heatmap. d Intramodular analysis of module membership (MM) and gene significance (GS) for highly correlated modules, allowing identification of genes that have high significance with treatment as well as high connectivity to their modules. Statistical testing was done using the t-test. P-values are two-sided. e ME expression profiles for the top 5 co-expressed modules. f Gene ontology enrichment analysis showed enriched pathways in 3/5 modules. Statistical testing was done using the hypergeometric test. P-values are one-sided. Pathways were considered differentially expressed with an FDR <0.05.
Fig. 7
Fig. 7. Target deconvolution using unbiased quantitative proteomics in AP4B1KO SH-SY5Y cells and AP-4-HSP patient-derived hiPSC neurons treated with BCH-HSP-C01.
ac Differential protein enrichment analysis. Statistical testing was done using protein-wise linear models and empirical Bayes statistics using the limma package in R (Ritchie et al.). Proteins were considered as differentially enriched with an FDR <0.05 and a log2 fold change >0.3. PCA plots show the top 500 variable proteins. Differentially enriched proteins are shown in volcano plots colored in black. Proteins with the most consistent enrichment profiles across all experimental conditions (see Supplementary Fig. 8) are colored and labeled in red. a SH-SY5Y cells: 8141 unique proteins were analyzed. b hiPSC-derived neurons: 7386 unique proteins were analyzed. c Integrated analysis of SH-SY5Y cells and hiPSC-derived neurons: 5357 unique proteins were analyzed. The dot plot summarizes dysregulated Reactome pathways of the pooled analysis. Pathways were considered differentially expressed with an FDR <0.05. d The RAB protein family members RAB1B, RAB3C and RAB12 showed the most consistent profiles in response to BCH-HSP-C01 treatment and were selected for further analysis. LFQ intensities in SH-SY5Y cells (AP4B1WT and AP4B1KO pooled; 12 independent experiments per condition; exception: RAB12 in BCB-HSP-C01 treated SH-SY5Y cells was not detectable in 3 samples, which is why quantification is based on 9 independent experiments), and hiPSC-derived neurons (controls and patients pooled, 6 independent experiments per condition) are shown. Box plots show medians (center), upper and lower quartiles (hinges) and 1.5 x IQR (whiskers). Statistical testing was done using pairwise t-tests. P-values are two-sided and were adjusted for multiple testing using the Benjamini-Hochberg procedure. e Correlation of LFQ intensities of RAB3C and RAB12 in AP4B1WT (n = 11 samples) and AP4B1KO (n = 10 samples) SH-SY5Y cells, as well as control (n = 6 samples) and patient (n = 6 samples) hiPSC-derived neurons are measured by the Pearson correlation coefficient (r).
Fig. 8
Fig. 8. RAB3C and RAB12 are involved in BCH-HSP-C01-mediated vesicle trafficking and enhancement of autophagic flux.
a AP4B1KO SH-SY5Y cells transfected for 72 h with RNPs targeting RAB3C, RAB12 or both compared to NLRP5 (non-essential control). Vehicle vs. BCH-HSP-C01 treatment at 5 µM was administered for 24 h. Data points represent per well means. Each experimental condition was tested in multiple replicates (nAP4B1KO + sgNLRP5: 20 wells from 5 independent plates; nAP4B1KO + sgNLRP5 + BCH-HSP-C01: 18 wells from 5 independent plates; nAP4B1KO + sgRAB3C: 24 wells from 5 independent plates; nAP4B1KO + sgRAB3C + BCH-HSP-C01: 22 wells from 5 independent plates; nAP4B1KO + sgRAB12: 28 wells from 5 independent plates; nAP4B1KO + sgRAB12 + BCH-HSP-C01: 25 wells from 5 independent plates; nAP4B1KO + sgRAB3C + sgRAB12: 22 wells from 3 independent plates; nAP4B1KO + sgRAB3C + sgRAB12 + BCH-HSP-C01: 22 wells from 3 independent plates). Statistical testing was done using the t-test. P-values are two-sided. b Representative images. Scale bar: 10 µm. c Representative western blots. Cells were treated with vehicle vs. BCH-HSP-C01 at 5 µM for 72 h. df Quantification of western blots. Experiments were performed in four biological replicates. Error bars represent ± 1 SD. Statistical testing was done using the t-test. P-values are two-sided and were adjusted for multiple testing using the Benjamini-Hochberg procedure. g, h AP4B1KO SH-SY5Y cells treated with BCH-HSP-C01 (5 µM) were incubated with ascending non-toxic doses of bafilomycin A1 (5 nM or 10 nM) or chloroquine (1 µM or 2 µM) for 24 h. Each condition was tested in 16 wells from 2 independent plates. (AP4B1KO). i Representative images. Scale bar: 10 µm. jl Representative western blots and quantification of whole cell lysates of AP4B1KO SH-SY5Y cells transfected for 72 h with RNPs against RAB3C, RAB12 or both, compared to NLRP5. Vehicle vs. BCH-HSP-C01 treatment was administered for 48 h. Error bars represent ± 1 SD. Statistical testing was done using the t-test. P-values are two-sided and were adjusted for multiple testing using the Benjamini-Hochberg procedure. Box plots in all experiments show medians (center), upper and lower quartiles (hinges) and 1.5 x IQR (whiskers). Dashed lines represent a reduction of the ATG9A ratio of −2 SD compared to negative controls.

Update of

References

    1. Tambuyzer E, et al. Therapies for rare diseases: therapeutic modalities, progress and challenges ahead. Nat. Rev. Drug Discov. 2020;19:93–111. doi: 10.1038/s41573-019-0049-9. - DOI - PubMed
    1. Moffat JG, Vincent F, Lee JA, Eder J, Prunotto M. Opportunities and challenges in phenotypic drug discovery: an industry perspective. Nat. Rev. Drug Discov. 2017;16:531–543. doi: 10.1038/nrd.2017.111. - DOI - PubMed
    1. Eder J, Sedrani R, Wiesmann C. The discovery of first-in-class drugs: origins and evolution. Nat. Rev. Drug Discov. 2014;13:577–587. doi: 10.1038/nrd4336. - DOI - PubMed
    1. Sun W, Zheng W, Simeonov A. Drug discovery and development for rare genetic disorders. Am. J. Med. Genet. A. 2017;173:2307–2322. doi: 10.1002/ajmg.a.38326. - DOI - PMC - PubMed
    1. Macarron R, et al. Impact of high-throughput screening in biomedical research. Nat. Rev. Drug Discov. 2011;10:188–195. doi: 10.1038/nrd3368. - DOI - PubMed