. 2024 Jan 17;15(1):58.
doi: 10.1038/s41419-024-06426-x.

The mitochondrial ATP-dependent potassium channel (mitoKATP) controls skeletal muscle structure and function

Affiliations

The mitochondrial ATP-dependent potassium channel (mitoKATP) controls skeletal muscle structure and function

Giulia Di Marco et al. Cell Death Dis. .

Abstract

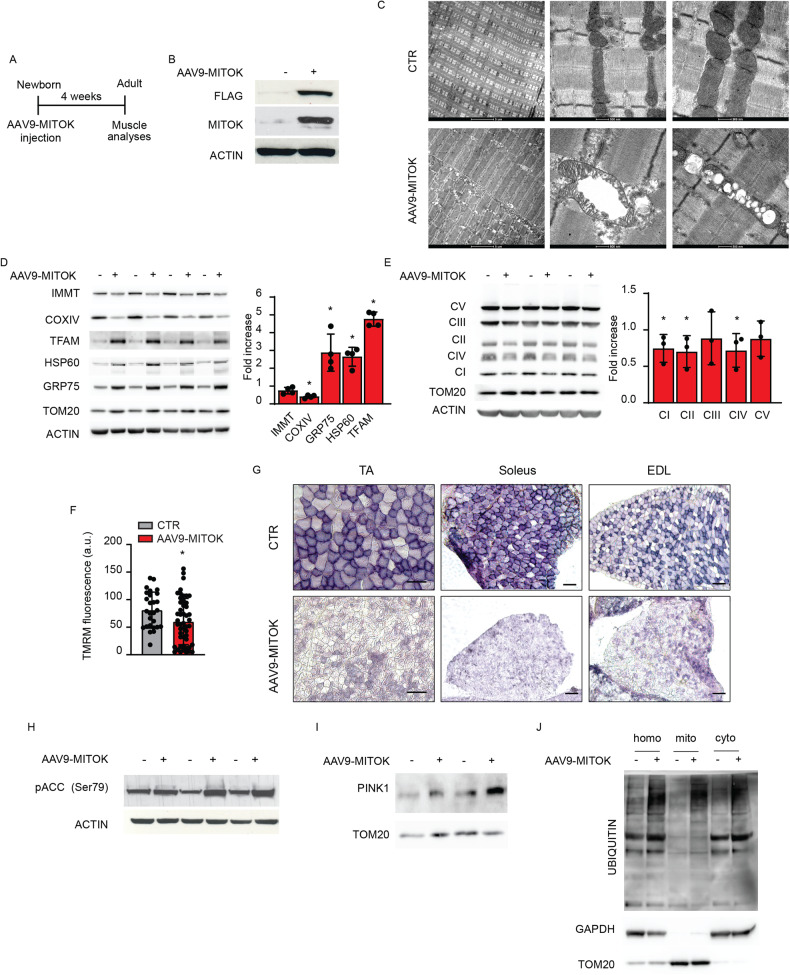
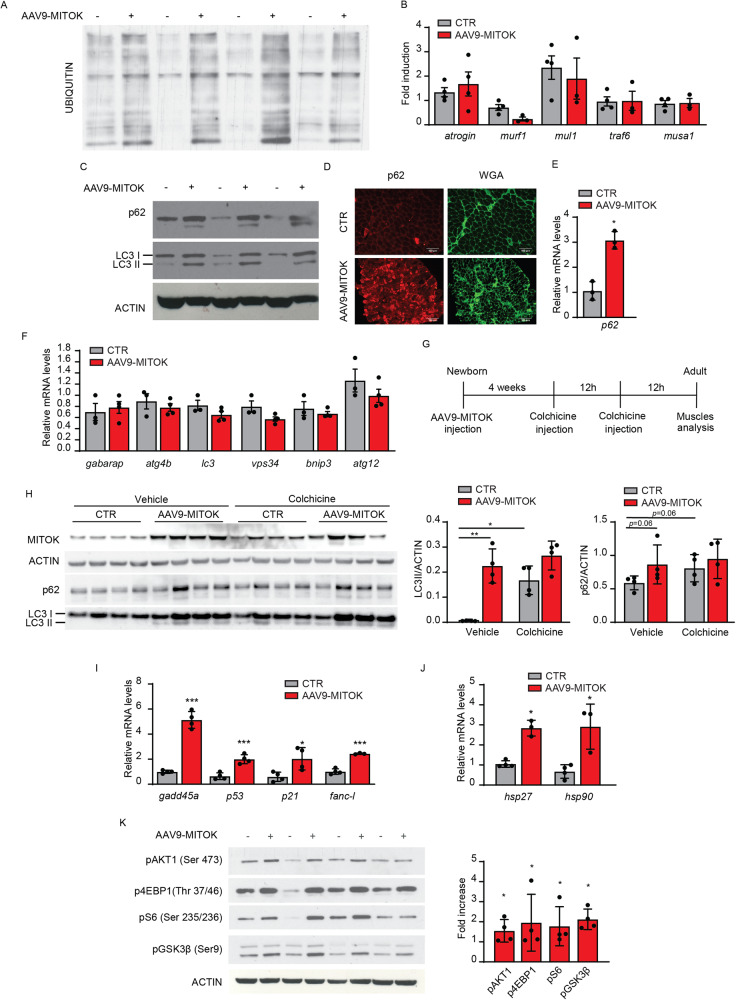
MitoKATP is a channel of the inner mitochondrial membrane that controls mitochondrial K+ influx according to ATP availability. Recently, the genes encoding the pore-forming (MITOK) and the regulatory ATP-sensitive (MITOSUR) subunits of mitoKATP were identified, allowing the genetic manipulation of the channel. Here, we analyzed the role of mitoKATP in determining skeletal muscle structure and activity. Mitok-/- muscles were characterized by mitochondrial cristae remodeling and defective oxidative metabolism, with consequent impairment of exercise performance and altered response to damaging muscle contractions. On the other hand, constitutive mitochondrial K+ influx by MITOK overexpression in the skeletal muscle triggered overt mitochondrial dysfunction and energy default, increased protein polyubiquitination, aberrant autophagy flux, and induction of a stress response program. MITOK overexpressing muscles were therefore severely atrophic. Thus, the proper modulation of mitoKATP activity is required for the maintenance of skeletal muscle homeostasis and function.


Conflict of interest statement

The authors declare no competing interests.

Figures

Fig. 1
Fig. 1. Mitok deletion in skeletal muscle alters mitochondria cristae shape, metabolite profile and respiration.
A Western blot analysis demonstrated efficient Mitok deletion in TA muscles. TOM20 was used as protein-loading control. B Mitok−/− muscle mitochondria had enlarged cristae width. On the left: representative TEM images. On the right: quantification. *p < 0.05, t test (two-tailed, unpaired) of 4 WT and 3 Mitok−/− muscles, respectively. Data are presented as mean ± SD. C Untargeted metabolomics analysis of WT and Mitok−/− muscles. Metabolites set enrichment analysis revealed decreased phosphatidylcoline, phosphatidylethanolamine, dihydrosphingomyelins, and sphyngomyelins pathways in Mitok−/− muscles. Welch’s two-sample t test of nine animals per condition. D FDB fibres were loaded with TMRM and Δψm was measured. t test (two-tailed, unpaired) of at least 25 fibres per condition. Data are presented as mean ± SD. E OCR measurements indicated reduced respiratory capacity in Mitok−/− FDB myofibres compared to controls. On the left: representative traces. On the right: quantification. To calculate basal and maximal respiration, non-mitochondrial O2 consumption was subtracted from absolute values. ATP-linked respiration was calculated as the difference between basal and oligomycin-insensitive O2 consumption. Data are normalized on mean Calcein fluorescence. *p < 0.05, t test (two-tailed, unpaired) of ten samples per condition. Data are presented as mean ± SD. F Untargeted metabolomics analysis of WT and Mitok−/− muscles. Metabolites set enrichment analysis revealed increased levels of glucose 6-phosphate, fructose 1,6-diphosphate, and DHAP in Mitok−/− muscles. Welch’s two-sample t test of nine WT and eight Mitok−/− animals. Data are presented as mean ± SD.
Fig. 2
Fig. 2. Mitok deletion triggers exercise intolerance and susceptibility to damaging muscle contractions.
A Mitok deletion did not affect muscle structure as demonstrated by hematoxylin and eosin staining. Scale bar 50 µm. B MitoK deletion did not affect fibre size either of glycolytic (EDL) or oxidative (soleus) muscles. t test (two-tailed, unpaired) of five animals per condition. Data are presented as mean ± SD. C Mean maximal running time in a single 10° uphill bout of run on a treadmill of WT and Mitok−/− mice indicated that Mitok deletion negatively affects exercise performance. *p < 0.05, t test (two-tailed, unpaired) of five animals per condition. Data are presented as mean ± SD. D Mean maximal running time in a single 10° downhill bout of run on a treadmill of WT and Mitok−/− mice indicated that Mitok deletion negatively affects exercise performance. *p < 0.05, t test (two-tailed, unpaired) of five animals per condition. Data are presented as mean ± SD. E Force production of plantar flexors in vivo after electrical stimulation of the nerve normalized for muscle weight. No change in either twitch (4 Hz) or tetanic (100–150 Hz) force in Mitok−/− animals was measured. Data are presented as mean ± SEM. F. Reduction of isometric force production during repeated eccentric contractions shows an increase in force reduction in Mitok−/− animals. Contractions were performed every 20 seconds to avoid force reduction due to fatigue. *p < 0.05, t test (two-tailed, unpaired) of five animals per condition. Data are presented as mean ± SEM.
Fig. 3
Fig. 3. Skeletal muscle MITOK overexpression triggers a severe impairment of mitochondrial morphology.
A Representative scheme of the experimental design. B Hindlimb muscles of newborn mice (4–6 days old) were injected with AAV9-MITOK or control virus. One month later muscles were isolated and processed. Western blot analysis demonstrated increased MITOK protein levels in AAV9-MITOK injected TA muscles. ACTIN was used as protein loading control. C TEM analysis performed on the longitudinal section of MITOK-overexpressing TA muscles and control muscles. Pictures shows the presence of swollen mitochondria deprived of internal cristae. D. Western blot analyses of AAV9-MITOK infected TA muscles showed alteration in mitochondrial protein levels. ACTIN and TOM20 were used as protein loading control. On the right: quantification by densitometry. Data are reported as fold increase of each protein, normalized for the relative ACTIN compared to control. *p < 0,05, **p < 0,01, t test (two-tailed, unpaired) of four muscles per condition. Data are presented as mean ± SD. E Western blot analyses of ETC components in TA muscle overexpressing MITOK and control muscles. ACTIN and TOM20 were used as protein-loading control. On the right: quantification by densitometry. Data are reported as fold increase of each protein, normalized for the relative ACTIN compared to control. *p < 0,05, t test (two-tailed, unpaired) of three animals per condition. Data are presented as mean ± SD. F FDB fibres were loaded with TMRM and Δψm was measured. *p < 0,05 t test (two-tailed, unpaired) of at least 25 fibres per condition. Data are presented as mean ± SD. G SDH staining performed on TA, soleus, EDL muscles showed reduced SDH-positive fibres in MITOK-overexpressing muscles. Scale bar 100 µm. H Western blot analyses demonstrated increased phosphorylation levels of ACC in MITOK-overexpressing muscles compared to control. ACTIN was used as protein-loading control. I Western blot analyses demonstrated PINK1 accumulation in MITOK-overexpressing muscles compared to control. TOM20 was used as protein-loading control. J Immunoblotting analyses showed increased ubiquitination levels in MITOK-overexpressing muscles compared to controls in the total homogenate and in the different subcellular fractions (mitochondria and cytosol). GAPDH and TOM20 were used as subcellular fractionation controls.
Fig. 4
Fig. 4. MITOK overexpression impinges on skeletal muscle catabolism and stress response programs.
A Immunoblotting analyses showed increased ubiquitination levels in MITOK-overexpressing muscles compared to controls. B. No difference in ubiquitin ligases gene expression was detected by qPCR analyses. Expression levels are normalized for actin. t test (two-tailed, unpaired) of four animals per condition. Data are presented as mean ± SD. C Western blot analyses demonstrated increased p62 and LC3II protein levels in MITOK-overexpressing muscles compared to control. ACTIN was used as protein-loading control. D Immunofluorescence analysis performed on transversal cryosections of soleus muscles overexpressing MITOK showed enhanced p62 signal. Scale bar 100 micron. E. MITOK overexpression induced the expression of p62. Expression levels are normalized for actin. *p < 0.05, t test (two-tailed, unpaired) of three animals per condition. Data are presented as mean ± SD. F No difference in autophagy-related genes was detected in MITOK-overexpressing muscles compared to controls by qPCR analysis. Expression levels are normalized for actin. t-test (two-tailed, unpaired) of at least 3 muscles per group. Data are presented as mean ± SD. G Hindlimb muscles of newborn mice were injected with AAV9-MITOK. One month later, mice were treated with colchicine twice with 12 h interval. 12 h after the second injection muscles were analyzed to measure the autophagy flux. H Protein levels of LC3-II and p62 were used to monitor autophagy flux, relative to actin protein levels used as loading control. On the right: quantification by densitometry of the ratio between LC3-II/ACTIN and p62/ACTIN. *p < 0,05; **p < 0,01; one-way ANOVA of four animals per condition. Data are presented as mean ± SD. I MITOK-overexpressing muscles showed increased expression of genes involved in the stress response. Expression levels are normalized for actin. *p < 0.05, ***p < 0.001, t test (two-tailed, unpaired) of four animals per condition. Data are presented as mean ± SD. J MITOK overexpression induced the expression of HSPs. Expression levels are normalized for actin. *p < 0.05, ***p < 0.001, t test (two-tailed, unpaired) of four animals per condition. Data are presented as mean ± SD. K Western blot analyses of AAV9-MITOK muscles demonstrated AKT pathway activation. On the right: quantification by densitometry. Data are reported as fold increase of each protein, normalized for the relative ACTIN compared to control.*p < 0,05; t test (two-tailed, unpaired) of four animals per condition Data are presented as mean ± SD.
Fig. 5
Fig. 5. Skeletal muscle MITOK overexpression affects muscle mass.
A Representative pictures show mass reduction in TA muscle 4 weeks after AAV9-MITOK infection compared to control. B TA, EDL and soleus muscles 4 weeks after AAV9-MITOK injection showed a decrease in muscle weight. ***p < 0.001, t test (two-tailed, unpaired) of eight animals per condition. Data are presented as mean ± SD. C EDL and soleus muscles fibre size was decreased in AAV9-MITOK injected animals. *p < 0,05; **p < 0,01; t test (two-tailed, unpaired) of three animals per condition. Data are presented as mean ± SD. D Hematoxylin and eosin staining showed atrophic fibres in MITOK overexpressing TA muscles 4 weeks after infection. Scale bar 100 µm. E No differences were detected by Sirius red staining performed on EDL muscles of AAV9-MITOK injected animals compared to controls. Scale bar 100 µm.
Fig. 6
Fig. 6. MITOK overexpression during adulthood triggers muscle atrophy.
A Representative scheme of the experimental design. B EDL muscles of 2-month-old mice were injected with AAV9-MITOK or control virus. Two weeks later muscles were isolated and processed for further analyses. Western blot analyses demonstrated increased MITOK protein levels in AAV9-MITOK injected EDL muscles. TOM20 was used as protein loading control. C H&E staining revealed no signs of degeneration in MITOK-overexpressing muscles. D SDH staining showed no differences in MITOK-overexpressing muscles compared to WT. E EDL fibre size was decreased in AAV9-MITOK injected animals. *p < 0,05; t test (two-tailed, unpaired) of three animals per condition. Data are presented as mean ± SD. F Western blot analyses of AAV9-MITOK infected muscles showed altered mitochondrial and autophagy protein levels. ACTIN was used as protein loading control. On the right: quantification by densitometry. Data are reported as fold increase of each protein, normalized for the relative ACTIN, compared to control. *p < 0,05, **p < 0,01, t test (two-tailed, unpaired) of three muscles per condition. Data are presented as mean ± SD. G Western blot analyses of AAV9-MITOK muscles demonstrated AKT pathway activation. On the right: quantification by densitometry. Data are reported as fold increase of each protein, normalized for the relative ACTIN, compared to control. *p < 0,05; t test (two-tailed, unpaired) of three animals per condition. Data are presented as mean ± SD.

References

    1. Checchetto V, Leanza L, De Stefani D, Rizzuto R, Gulbins E, Szabo I. Mitochondrial K+ channels and their implications for disease mechanisms. Pharm Ther. 2021;227:107874. doi: 10.1016/j.pharmthera.2021.107874. - DOI - PubMed
    1. Malinska D, Mirandola SR, Kunz WS. Mitochondrial potassium channels and reactive oxygen species. FEBS Lett. 2010;584:2043–8. doi: 10.1016/j.febslet.2010.01.013. - DOI - PubMed
    1. Kowaltowski AJ, Seetharaman S, Paucek P, Garlid KD. Bioenergetic consequences of opening the ATP-sensitive K(+) channel of heart mitochondria. Am J Physiol Heart Circ Physiol. 2001;280:H649–57. doi: 10.1152/ajpheart.2001.280.2.H649. - DOI - PubMed
    1. Minners J, Van Den Bos EJ, Yellon DM, Schwalb H, Opie LH, Sack MN. Dinitrophenol, cyclosporin A, and trimetazidine modulate preconditioning in the isolated rat heart: Support for a mitochondrial role in cardioprotection. Cardiovasc Res. 2000;47:68–73. doi: 10.1016/S0008-6363(00)00069-9. - DOI - PubMed
    1. Paggio A, Checchetto V, Campo A, Menabò R, Di Marco G, Di Lisa F, et al. Identification of an ATP-sensitive potassium channel in mitochondria. Nature. 2019;572:609–13. doi: 10.1038/s41586-019-1498-3. - DOI - PMC - PubMed

Publication types

MeSH terms

Substances

LinkOut - more resources