

A computational model of stem cells' internal mechanism to recapitulate spatial patterning and maintain the self-organized pattern in the homeostasis state
- PMID: 38233402
- PMCID: PMC10794714
- DOI: 10.1038/s41598-024-51386-z
A computational model of stem cells' internal mechanism to recapitulate spatial patterning and maintain the self-organized pattern in the homeostasis state
Abstract
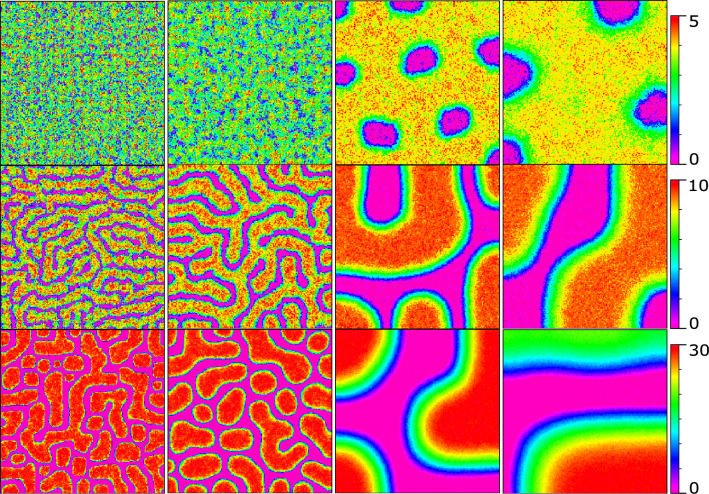
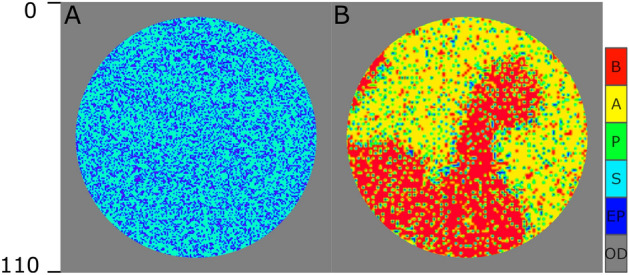
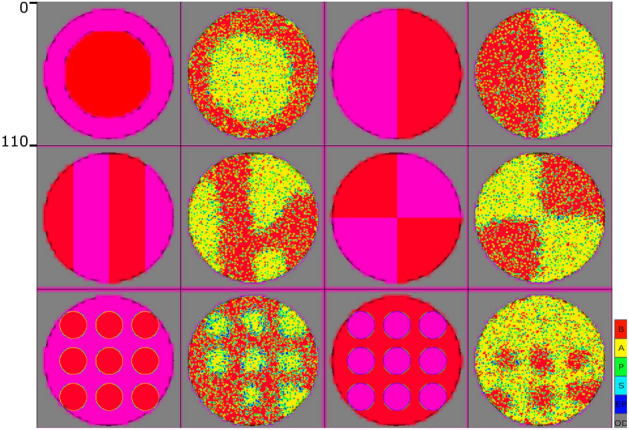
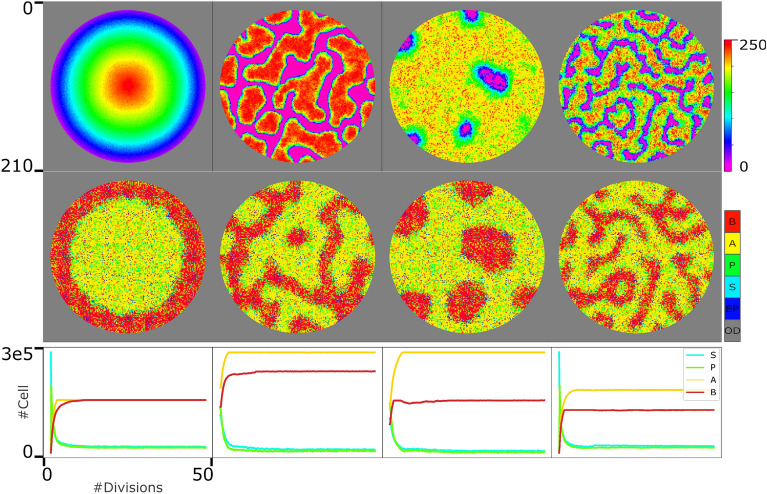
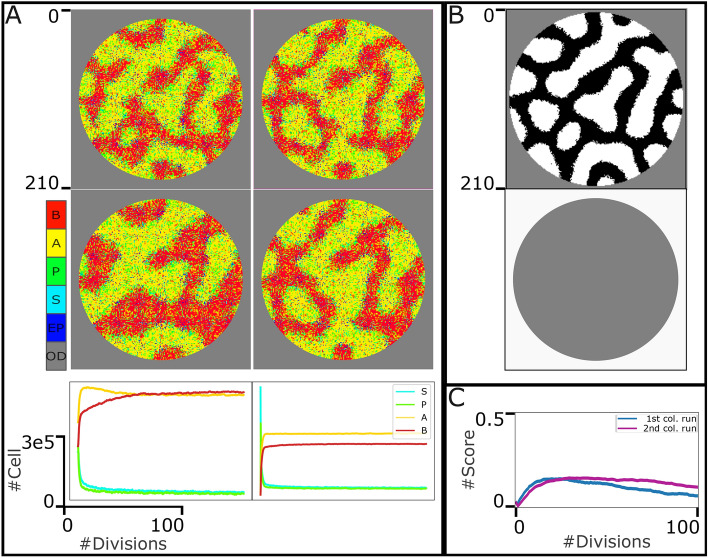
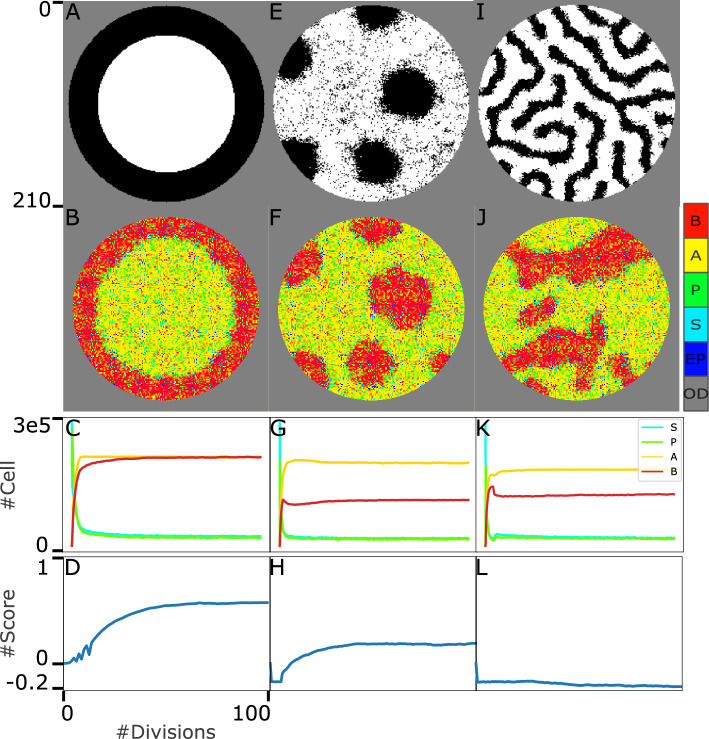
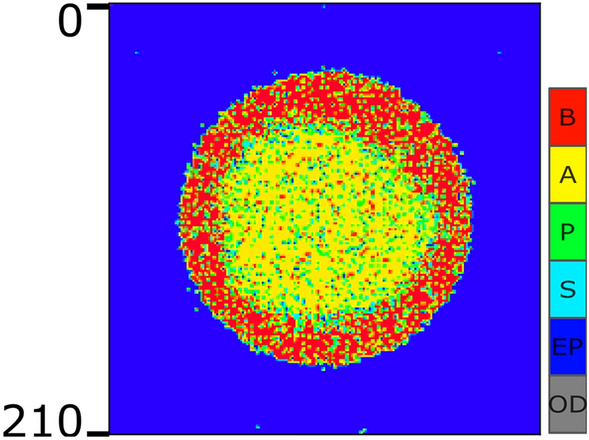
The complex functioning of multi-cellular tissue development relies on proper cell production rates to replace dead or differentiated specialized cells. Stem cells are critical for tissue development and maintenance, as they produce specialized cells to meet the tissues' demands. In this study, we propose a computational model to investigate the stem cell's mechanism, which generates the appropriate proportion of specialized cells, and distributes them to their correct position to form and maintain the organized structure in the population through intercellular reactions. Our computational model focuses on early development, where the populations overall behavior is determined by stem cells and signaling molecules. The model does not include complicated factors such as movement of specialized cells or outside signaling sources. The results indicate that in our model, the stem cells can organize the population into a desired spatial pattern, which demonstrates their ability to self-organize as long as the corresponding leading signal is present. We also investigate the impact of stochasticity, which provides desired non-genetic diversity; however, it can also break the proper boundaries of the desired spatial pattern. We further examine the role of the death rate in maintaining the system's steady state. Overall, our study sheds light on the strategies employed by stem cells to organize specialized cells and maintain proper functionality. Our findings provide insight into the complex mechanisms involved in tissue development and maintenance, which could lead to new approaches in regenerative medicine and tissue engineering.
© 2024. The Author(s).
Conflict of interest statement
The authors declare no competing interests.
Figures
Similar articles
-
A computational model of stem cells' decision-making mechanism to maintain tissue homeostasis and organization in the presence of stochasticity.Sci Rep. 2022 Jun 2;12(1):9167. doi: 10.1038/s41598-022-12717-0. Sci Rep. 2022. PMID: 35654903 Free PMC article.
-
A computational model of stem cell molecular mechanism to maintain tissue homeostasis.PLoS One. 2020 Jul 30;15(7):e0236519. doi: 10.1371/journal.pone.0236519. eCollection 2020. PLoS One. 2020. PMID: 32730297 Free PMC article.
-
Role of the Nucleus as a Sensor of Cell Environment Topography.Adv Healthc Mater. 2018 Apr;7(8):e1701154. doi: 10.1002/adhm.201701154. Epub 2017 Dec 28. Adv Healthc Mater. 2018. PMID: 29283219 Review.
-
Design principles for generating robust gene expression patterns in dynamic engineered tissues.Integr Biol (Camb). 2013 Mar;5(3):578-89. doi: 10.1039/c3ib20274g. Integr Biol (Camb). 2013. PMID: 23369944
-
Chemical and physical properties of regenerative medicine materials controlling stem cell fate.Ann Med. 2012 Nov;44(7):635-50. doi: 10.3109/07853890.2011.573805. Epub 2011 May 13. Ann Med. 2012. PMID: 21568670 Review.
Cited by
-
Correspondence between multiple signaling and developmental cellular patterns: a computational perspective.Front Cell Dev Biol. 2024 Jul 30;12:1310265. doi: 10.3389/fcell.2024.1310265. eCollection 2024. Front Cell Dev Biol. 2024. PMID: 39139453 Free PMC article.
-
Hair follicle stem cells promote epidermal regeneration under expanded condition.Front Physiol. 2024 Feb 22;15:1306011. doi: 10.3389/fphys.2024.1306011. eCollection 2024. Front Physiol. 2024. PMID: 38455843 Free PMC article. Review.
References
MeSH terms
LinkOut - more resources
Full Text Sources
Medical
