. 2024 Jan 17;15(1):62.
doi: 10.1038/s41419-023-06411-w.

METTL3 facilitates renal cell carcinoma progression by PLOD2 m6A-methylation under prolonged hypoxia

Affiliations

METTL3 facilitates renal cell carcinoma progression by PLOD2 m6A-methylation under prolonged hypoxia

Yimeng Chen et al. Cell Death Dis. .

Abstract

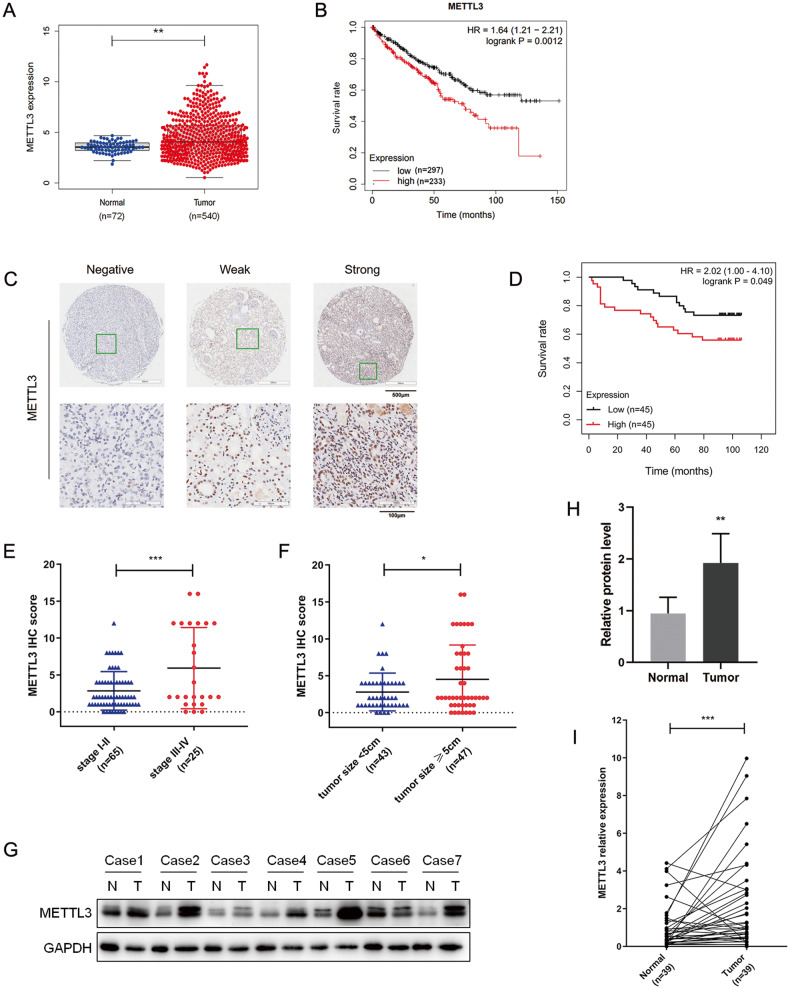
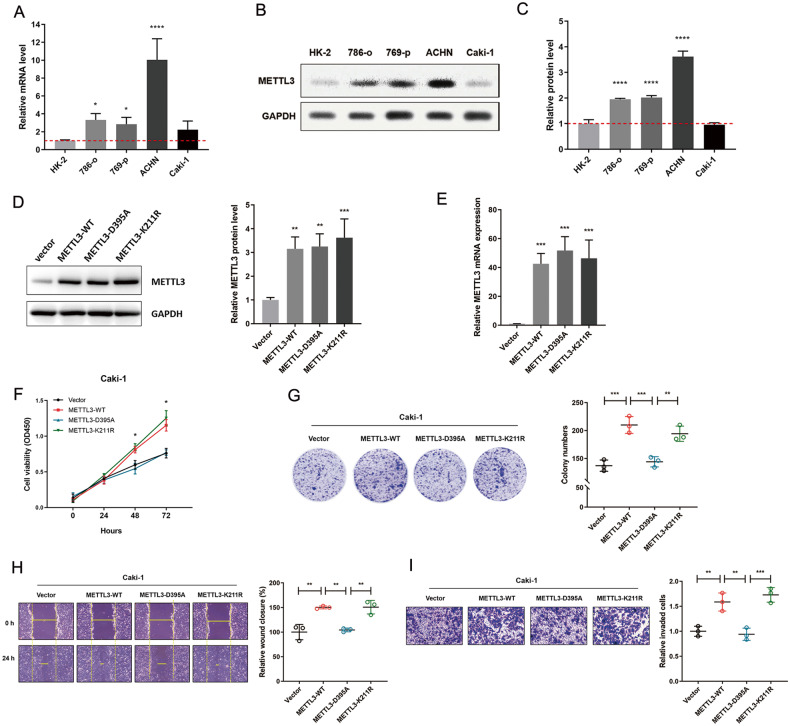
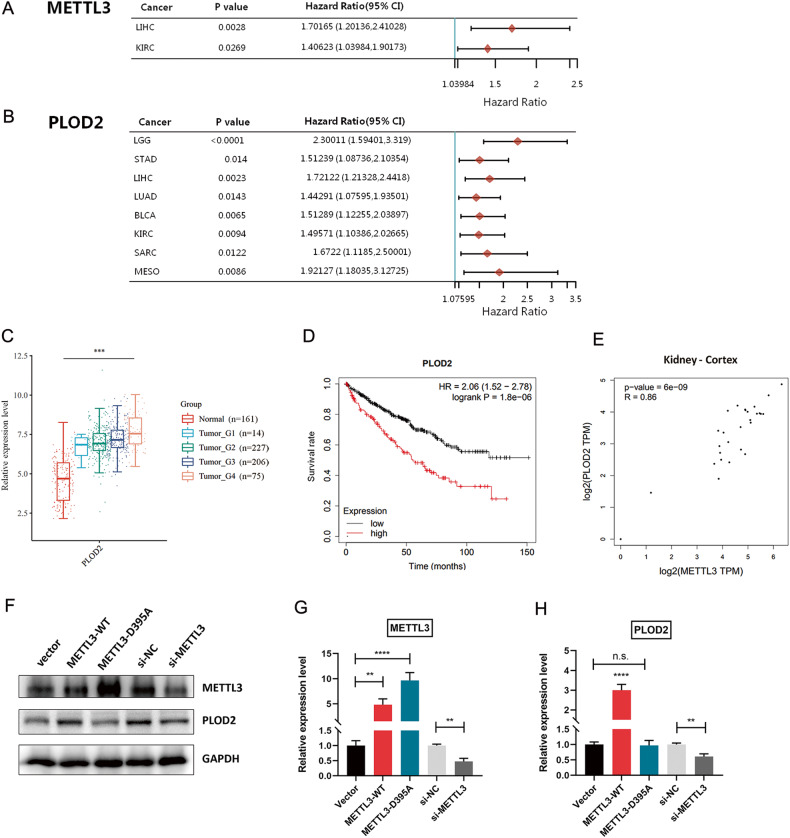
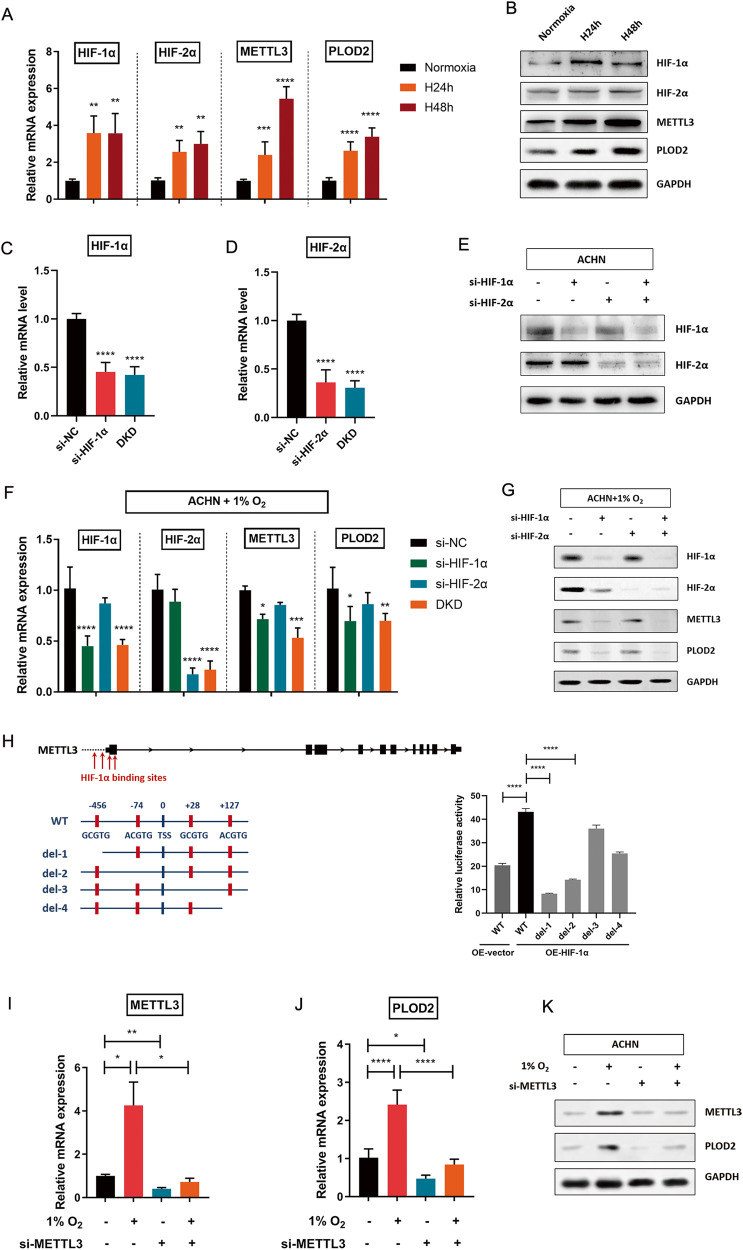
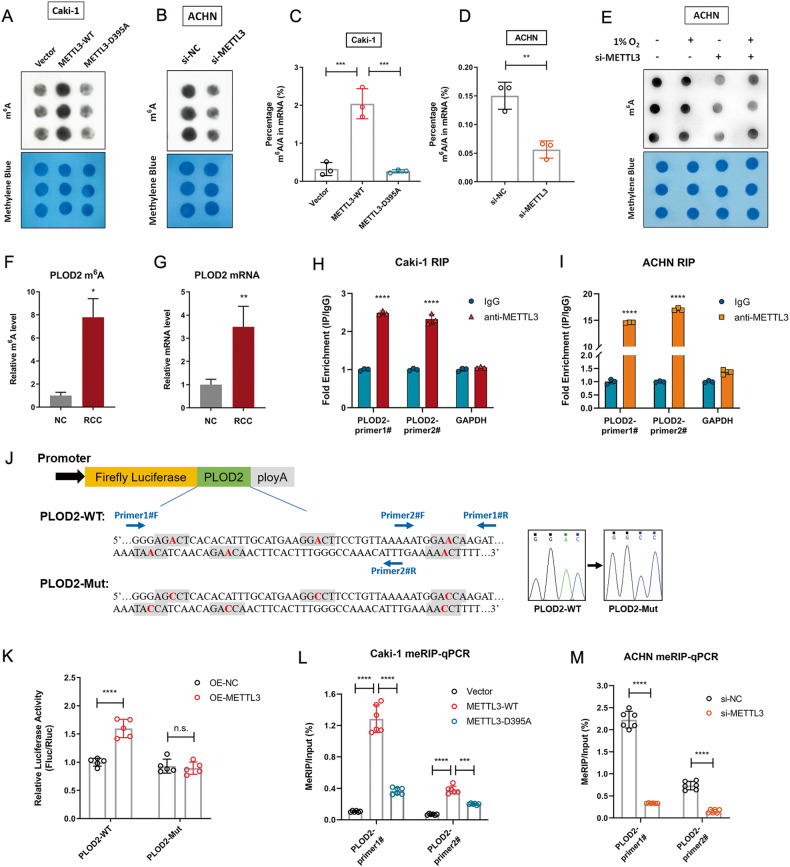
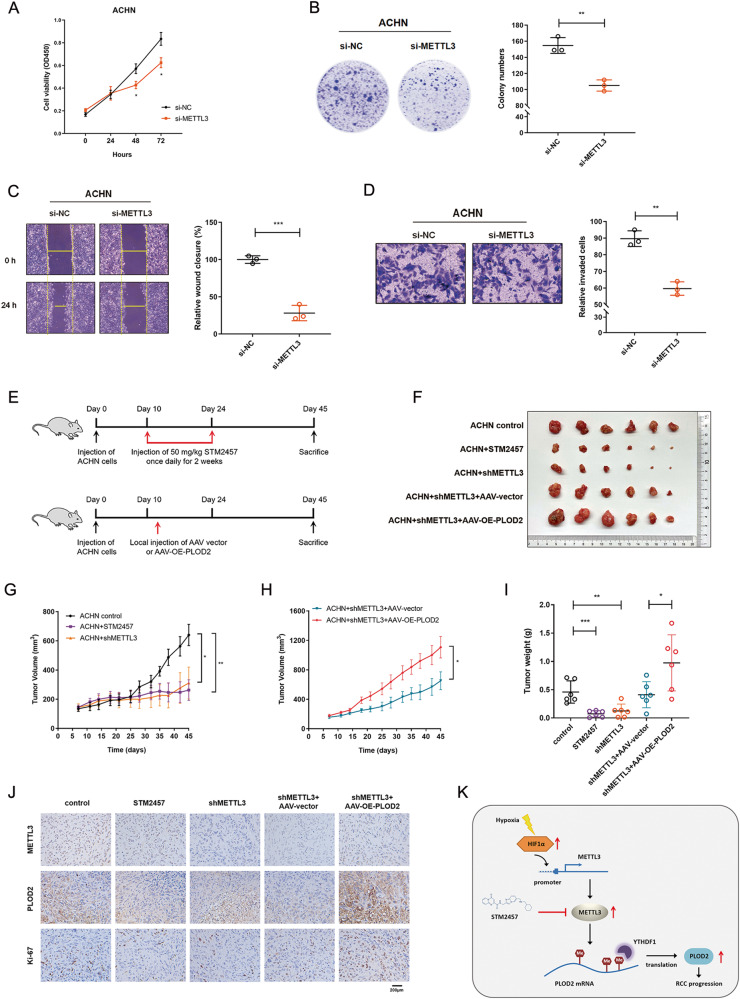
N6-methyladenosine (m6A) is the most prevalent reversible modification in eukaryotic mRNA, and it plays a critical role in tumor progression. The purpose of this study was to investigate the function and regulatory mechanisms of the methyltransferase METTL3 in renal cell carcinoma (RCC). METTL3 expression was upregulated and predicted a poor prognosis in patients with advanced RCC. METTL3 facilitated the proliferation, migration, and invasion of RCC cells, depending on its methylase activity. METTL3 positively regulated the expression of PLOD2, and both genes were triggered under prolonged hypoxia. Mechanistically, hypoxia-induced the binding of HIF-1α to the METTL3 promoter, which enhanced its transcriptional activity. METTL3-mediated m6A modifications of PLOD2 mRNA at 3'UTR region, promoting the translation of PLOD2 protein. Furthermore, silencing METTL3 impaired RCC progression in vitro. In vivo, administration of highly potent and selective METTL3 inhibitor STM2457 showed anti-tumor effects, whereas AAV9-mediated re-transduction of PLOD2 largely abolished the above phenomenon in a subcutaneous mouse model. These findings reveal that hypoxia and HIF-driven METTL3 transcription promote RCC progression by increasing PLOD2 expression in an m6A-dependent manner, suggesting that METTL3 may serve as a novel pharmaceutical intervention for RCC.


Conflict of interest statement

The authors declare that they have no competing interests. This study was approved by the Ethics Committee of The Third Affiliated Hospital of Soochow University, and written informed consent was obtained from all participants. All procedures performed in studies involving human participants were compliant with ethical standards.

Figures

Fig. 1
Fig. 1. Upregulated METTL3 predicts poor survival in RCC patients.
A METTL3 expression in the normal tissues (n = 72) and RCC samples (n = 540) in the TCGA cohort. **P = 0.0020. B Kaplan–Meier survival curve with log-rank test was applied for prognostic evaluation in a total of 530 RCC patients from the Kaplan–Meier Plotter dataset. C Representative images of IHC staining on a tissue microarray with negative, weak or strong METTL3 expression. D Kaplan–Meier survival curve was plotted in human RCC samples with high (n = 45) or low (n = 45) METTL3 IHC scores. E METTL3 IHC scores in RCC tissues with different disease stages (stage I–II vs. stage III–IV). ***P = 0.0005. F METTL3 IHC scores in RCC tissues with different tumor size (<5 cm vs. ≥5 cm). *P = 0.0347. Data were represented as mean ± S.D. GI Increased METTL3 expression in RCC tissues compared to their adjacent normal tissues was verified by Western blotting and RT-qPCR assay in our RCC cohort. N, normal; T, tumor. **P = 0.0011, ***P = 0.0009.
Fig. 2
Fig. 2. METTL3 promotes RCC progression dependent on its methylase activity.
A Relative mRNA levels of METTL3 in four RCC cell lines and normal renal epithelial cells (HK-2) were determined by RT-qPCR. *P = 0.0220 (left), 0.0470 (right), ****P < 0.0001. B, C Western blotting analysis of METTL3 protein levels in four RCC cell lines and normal renal epithelial cells (HK-2). ****P < 0.0001. D METTL3 protein levels in Caki-1 cells transfected with METTL3 over-expressing vectors. **P = 0.0032 (left), 0.0024 (right), ***P = 0.0009. E METTL3 mRNA expression in Caki-1 cells transfected with METTL3 over-expressing vectors. ***P = 0.0007, 0.0001, and 0.0004 (left to right). F Cell growth curve of Caki-1 cells transfected with METTL3 over-expressing vectors. METTL3-D395A vs. WT, METTL3-D395A vs. K211R, *P < 0.05. G Colony formation assay of Caki-1 cells transfected with METTL3 over-expressing vectors. ***P = 0.0004 (left), 0.0008 (right), **P = 0.0045. H Wound-healing assay of Caki-1 cells transfected with METTL3 over-expressing vectors. **P = 0.0019, 0.0033, and 0.0031 (left to right). I Cell invasion ability of Caki-1 cells transfected with METTL3 over-expressing vectors. **P = 0.0040 (left), 0.0022 (right), ***P = 0.0006. Data represent means ± S.D. of three independent experiments.
Fig. 3
Fig. 3. Pan-cancer analysis of METTL3 and PLOD2 gene.
A, B Forest plot displayed the effects of METTL3 (A) and PLOD2 (B) on overall survival in multiple kinds of cancers. LIHC, Liver hepatocellular carcinoma; KIRC, Kidney renal clear cell carcinoma; LGG, Brain lower grade glioma; STAD, Stomach adenocarcinoma; LUAD, Lung adenocarcinoma; BLCA, Bladder urothelial carcinoma; SARC, Sarcoma; MESO, Mesothelioma. C PLOD2 expression level in a TCGA RCC cohort with different tumor grade. ***P < 0.001. D Kaplan–Meier survival curve with log-rank test was applied for prognostic evaluation in a total of 530 RCC patients from the Kaplan–Meier Plotter dataset. E Pearson correlation analysis between METTL3 and PLOD2 expression in the cortex of kidney. FH Protein levels of METTL3 and PLOD2 in Caki-1 cells with METTL3-overexpression or depletion were determined by western blotting. **P = 0.0018, 0.0014, and 0.0025 (left to right), ****P < 0.0001. Data were represented as mean ± S.D. of three independent experiments.
Fig. 4
Fig. 4. HIFs and METTL3 are required for hypoxia-induced PLOD2 expression.
A, B Expression levels of HIF-1α, HIF-2α, METTL3, and PLOD2 were determined by RT-qPCR (A) and western blotting (B) after ACHN cells were exposed to normoxia (20% O2) or hypoxia (1% O2). **P = 0.0013, 0.0022, 0.0087, and 0.0026 (left to right), ***P = 0.0002, ****P < 0.0001. CE Examination of the knockdown efficiency when si-HIF-1α, si-HIF-1α, or double knockdown (DKD) were transfected into ACHN cells. ****P < 0.0001. FG Silencing of HIFs decreased METTL3 and PLOD2 expression at mRNA level (F) and protein level (G) in RCC cells under prolonged hypoxia. ****P < 0.0001, *P = 0.0454 and 0.0124 (left to right), ***P = 0.0004, **P = 0.0082. (H) Luciferase reporter assay was used to determine the potential HIF-1α binding sites in METTL3 promoter region. ****P < 0.0001. IK Expression levels of METTL3 and PLOD2 were examined in ACHN cells by RT-qPCR (I, J) and western blotting (K) when prolonged hypoxia was combined with METTL3 silencing. J *P = 0.0336 (left), 0.0274 (right), **P = 0.0010. K, *P = 0.0323, ****P < 0.0001. Data were represented as mean ± S.D. of three independent experiments.
Fig. 5
Fig. 5. METTL3 mediates m6A RNA methylation on PLOD2 mRNA.
A m6A dot-blot assay was used to detect the m6A levels in Caki-1 cells with or without METTL3 overexpression. Methylene blue staining was served as loading control. B m6A dot-blot assay was used to detect the m6A levels in ACHN cells with or without silencing METTL3. C The m6A contained in total RNA was measured by colorimetric quantification in Caki-1 cells with or without over-expressing METTL3. ***P = 0.0004 (left), 0.0003 (right). D The m6A contained in total RNA was measured by colorimetric quantification in ACHN cells with or without silencing METTL3. **P = 0.0044. E ACHN cells with or without METTL3 knockdown were exposed to 20% or 1% O2 for 48 h. Total RNA was extracted, and m6A levels were determined by a m6A dot-blot assay. F m6A enrichment of PLOD2 mRNA in RCC tissues and matched adjacent normal tissues was measured by meRIP-RT-qPCR. *P = 0.0143. G PLOD2 mRNA level in RCC tissues and adjacent normal tissues was detected by RT-qPCR. **P = 0.0019. H, I RIP analyses of Caki-1 cells (H) and ACHN cells (I) were performed with anti-METTL3 or IgG antibody followed by qPCR analyses with primers against PLOD2 mRNA. Data represent means ± S.D. of triplicate samples. ****P < 0.0001. J Schematic representation of luciferase reporter vectors. K Luciferase reporter vectors containing wild-type or mutated m6A sites in PLOD2-3’UTR were transfected into 293T cells with or without METTL3 over-expression. Relative luciferase activity (Fluc normalized to Rluc) was measured. ****P < 0.0001, n.s., no significance. L MeRIP-RT-qPCR analysis of m6A enrichment in the PLOD2 locus in Caki-1 cells with or without METTL3 overexpression. ****P < 0.0001, ***P = 0.0009. M MeRIP-RT-qPCR analysis of m6A enrichment in the PLOD2 locus in ACHN cells with or without silencing METTL3. ****P < 0.0001. Data were represented as mean ± S.D. of three independent experiments.
Fig. 6
Fig. 6. Targeting METTL3 abrogates RCC progression in vitro and in vivo.
A Cell growth curve of ACHN cells transfected with si-NC or si-METTL3. *P = 0.0441 (left), 0.0328 (right). B The proliferation ability after depletion METTL3 in ACHN cells was evaluated by colony formation assay (representative wells were presented). **P = 0.0020. C Wound-healing assay was applied for the cell migration in METTL3 knockdown ACHN cells compared with normal controls. ***P = 0.0004. D Cell invasion ability after depletion METTL3 in ACHN cells was measured via the transwell cell invasion assay. **P = 0.0011. E Schematic diagram illustrates the design of animal experiments. F Xenograft tumors derived from ACHN cells with METTL3 inhibitor, METTL3 knockdown, PLOD2 overexpression, or negative control were shown (n = 6). Mice were sacrificed 45 days post-injection. G, H Tumor growth curves in ACHN xenograft tumors with different treatments. Tumor volume was calculated twice a week. *P = 0.0169, **P = 0.0073 (G), *P = 0.0288 (H). I Tumor weight in ACHN xenograft tumors with different treatments. Data represent the means ± S.D. of 6 mice in each group. ***P = 0.0006, **P = 0.0021, *P = 0.0303. J Representative IHC staining of METTL3, PLOD2, and Ki-67 in xenograft tumors with different treatments. Scale bar, 200 μm. K A mechanism of RCC progression promoted by METTL3-mediated PLOD2 m6A-methylation under prolonged hypoxia. Data were represented as mean ± S.D.

Similar articles

Cited by

References

    1. Jian Y, Yang K, Sun X, Zhao J, Huang K, Aldanakh A, et al. Current advance of immune evasion mechanisms and emerging immunotherapies in renal cell carcinoma. Front Immunol. 2021;12:639636. doi: 10.3389/fimmu.2021.639636. - DOI - PMC - PubMed
    1. Sung H, Ferlay J, Siegel RL, Laversanne M, Soerjomataram I, Jemal A, et al. Global Cancer Statistics 2020: GLOBOCAN estimates of incidence and mortality worldwide for 36 cancers in 185 countries. CA Cancer J Clin. 2021;71:209–49. doi: 10.3322/caac.21660. - DOI - PubMed
    1. Dominissini D, Moshitch-Moshkovitz S, Schwartz S, Salmon-Divon M, Ungar L, Osenberg S, et al. Topology of the human and mouse m6A RNA methylomes revealed by m6A-seq. Nature. 2012;485:201–6. doi: 10.1038/nature11112. - DOI - PubMed
    1. Fu Y, Dominissini D, Rechavi G, He C. Gene expression regulation mediated through reversible m(6)A RNA methylation. Nat Rev Genet. 2014;15:293–306. doi: 10.1038/nrg3724. - DOI - PubMed
    1. Deng X, Su R, Weng H, Huang H, Li Z, Chen J. RNA N(6)-methyladenosine modification in cancers: current status and perspectives. Cell Res. 2018;28:507–17. doi: 10.1038/s41422-018-0034-6. - DOI - PMC - PubMed

Publication types