. 2024 Jan 17;15(1):59.
doi: 10.1038/s41419-024-06453-8.

BACH2-mediated CD28 and CD40LG axes contribute to pathogenesis and progression of T-cell lymphoblastic leukemia

Affiliations

BACH2-mediated CD28 and CD40LG axes contribute to pathogenesis and progression of T-cell lymphoblastic leukemia

Min Feng et al. Cell Death Dis. .

Abstract

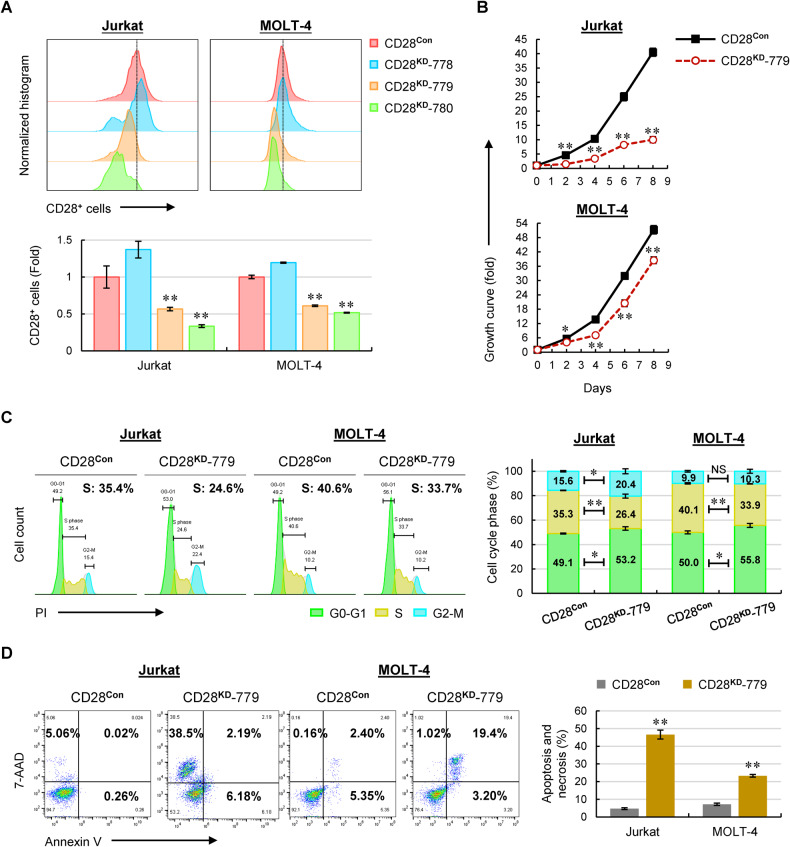
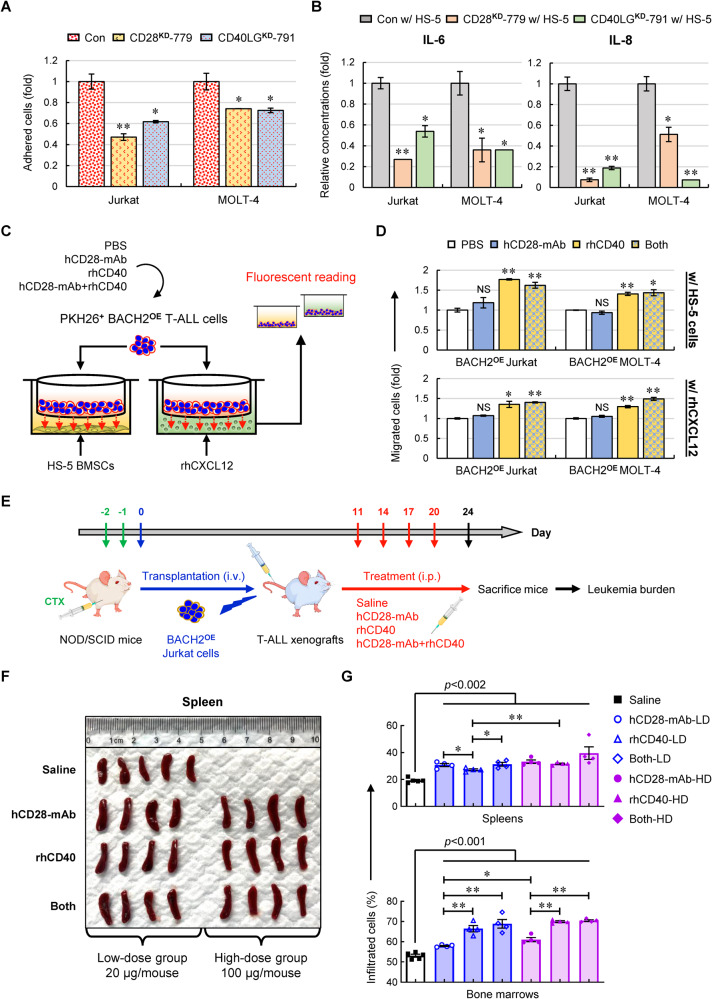
T-cell acute lymphoblastic leukemia (T-ALL) is an aggressive subtype of ALL characterized by its high heterogeneity and unfavorable clinical features. Despite improved insights in genetic and epigenetic landscapes of T-ALL, the molecular mechanisms that drive malignant T-cell development remain unclear. BTB and CNC homology 2 (BACH2) is a lymphoid-specific transcription repressor recognized as a tumor suppressor in B-cell malignancies, but little is known about its function and regulatory network in T-ALL. Here we found extremely low levels of BACH2 in T-ALL clinical samples and cell lines compared to normal T cells. Overexpression of BACH2 in T-ALL cells not only induced cell growth retardation but also inhibited cancer progression and infiltration in xenografts. Further RNA sequencing (RNA-seq) analysis revealed significant alterations in regulation of defense and immune responses in T-ALL cells upon BACH2 overexpression. Strikingly, CD28 and CD40LG, two essential stimulatory molecules on T cells, were for the first time identified as novel downstream targets repressed by BACH2 in T-ALL cells. Interestingly, both CD28 and CD40LG were indispensable for T-ALL survival, since largely or completely silencing CD28 and CD40LG led to rapid cell death, whereas partial knockdown of them resulted in cell-cycle arrest and enhanced apoptosis. More importantly, BACH2-mediated CD28 and CD40LG signals contributed to cell migration and dissemination of T-ALL cells to the bone marrow, thus adding a new layer to the BACH2-mediated tumor immunoregulation in T-cell malignancies.


Conflict of interest statement

The authors declare no competing interests.

Figures

Fig. 1
Fig. 1. Decreased BACH2 levels in T-ALL patients and tumor-suppressor-like role of BACH2 in T-ALL cells and xenografts.
A BACH2 expression values in T-ALL patient samples (n = 9) vs. normal thymic T cells (n = 4) from GSE63602 (left), as well as in T-ALL patient samples (n = 4) vs. normal peripheral CD3+ T cells (n = 4) from GSE26530 (right). B Relative BACH2 mRNA levels in three T-ALL patient samples (#1-#3) vs. normal peripheral CD3+ T cells and different T-cell subsets including DN, SP (CD4+ T and CD8+ T) and DP T cells. The fold change in expression relative to the BACH2 levels of CD3+ T cells is shown as the mean ± SD. Each of the T-cell subsets is compared to three T-ALL samples, respectively, with the p values indicated. C The overexpression efficiency of BACH2 (BACH2OE) in Jurkat (left) and MOLT-4 (right) T-ALL cells were validated by immunoblots with a nonsilencing shRNA plasmid (BACH2Con) as a negative control. β-actin was used as a loading control. Viable cells were counted in manipulated Jurkat and MOLT-4 cells (lower). D Representative cell-cycle distribution of manipulated Jurkat and MOLT-4 cells (left). The % population of cells in each phase is shown as the mean ± SD from three independent experiments (right). E Representative cell apoptosis in manipulated Jurkat and MOLT-4 cells staining with Annexin V/7-AAD (left). The % population of early and late apoptotic cells in each group is shown as the mean ± SD from three independent experiments (right). NS not significant; *p < 0.05; **p < 0.01 (vs. control group). F Manipulated Jurkat cells (2 × 10⁶ cells/mouse) were intravenously (i.v.) injected into NOD/SCID mice via tail vein (n = 8). Mice #1 to #4 were injected with BACH2Con cells, whereas mice #5 to #8 were injected with BACH2OE cells. Xenografts were sacrificed when they presented leukemic phenotypes. Spleens were isolated and photographed against a ruler in centimeters. G GFP+ cells from spleens (left) and bone marrows (right) in each group were analyzed using flow cytometry. Data are presented as the mean ± SEM.
Fig. 2
Fig. 2. RNA-seq analysis of manipulated T-ALL cells.
A Visualization of BACH2 transcriptional levels (red peaks) with IGV from two replicates in each group. GRCh38 genome was used as a human reference genome (upper). Volcano plot was generated with 137 Up-DEGs and 96 Down-DEGs in BACH2OE Jurkat cells vs. control cells (lower). The Log2(FC), adjusted p values were calculated using DESeq2 default settings, and significant genes were considered the ones with adjusted p values < 0.05. B Heatmap of the top 20 Up- and Down-DEGs from two replicates in each group. The level of gene expression is indicated by the color intensity, with red representing high expression and blue representing low expression. C Top 10 of GO terms enriched in BP category based on the enrichment analysis of the obtained DEGs. D DEGs that were enriched in the top 5 GO-BP terms. E Top 15 hub genes in BACH2-involving gene regulatory network using weighted gene co-expression network analysis. The black arrows pointed to the downstream target genes and the lines indicated the gene-gene interactions. Red, green, and blue represent the Up-DEGs (n = 5), Down-DEGs (n = 4), and nonsignificant genes (n = 6), respectively. F Top 12 hub nodes in BACH2-involving PPI network, with red representing the Up-DEGs (n = 8) and blue representing the Down-DEGs (n = 4).
Fig. 3
Fig. 3. Identification of the downstream transcriptional targets of BACH2 in T-ALL cells.
A Venn diagram showing the overlap of annotated peaks containing promoter region identified from CUT&Tag-seq for BACH2 and the DEGs from RNA-seq. B GO enrichment analysis of the overlapping genes (n = 129) including the top 5 terms in BP category and the top 5 terms in cellular component (CC) category. C Log2(FC) of the selected 22 DEGs from RNA-seq. Each value from the RNA-seq in BACH2OE Jurkat cells was relative to the control cells. Chr, chromosome. Relative mRNA levels of Down-DEGs (n = 9) D and Up-DEGs (n = 13) E in manipulated Jurkat and MOLT-4 cells. Each value was normalized to ACTB and is presented as the mean ± SD from three independent experiments. *p < 0.05; **p < 0.01 (vs. control group). Log2(FC) of each gene in BACH2OE cells relative to the control cells is indicated under the bar chart, with the upper row representing Jurkat and the lower row representing MOLT-4.
Fig. 4
Fig. 4. CD28 and CD40LG are novel downstream targets repressed by BACH2 in T-ALL cells.
A Visualization of BACH2 peaks at CD28 (left) and CD40LG (right) promoters with orange reads representing antibodies against control immunoglobulin G (IgG) and blue reads representing antibodies against human BACH2. Transcriptional levels of the CD28 and CD40LG genes from RNA-seq are indicated with red reads representing upregulation while green reads representing downregulation. GRCh38 genome was used as a human reference genome. Truncated promoter construct containing three putative BACH2-binding sites (MARE1-3) of the CD28 gene (B) or the CD40LG gene (C) is indicated (left). 293T cells were transfected with truncated promoter plasmids, BACH2 expression plasmids, or control plasmids (pcDNA3.1). An empty pGL3-basic plasmid was used as a negative control. The Renilla luciferase reporter pRL-SV40 was used as an internal control for normalization. Luciferase activity was measured 48 h after transfection. Data are presented as the relative luciferase activity compared with the cells transfected with control plasmids (right). Data are shown as the mean ± SD from three independent experiments. D Representative expression levels of CD28 in manipulated Jurkat and MOLT-4 cells using flow cytometry (upper). The relative intensity of CD28 positive (CD28+) cells were normalized to control cells and shown as the mean ± SD from three independent experiments (lower). E Representative expression levels of CD40LG in manipulated Jurkat and MOLT-4 cells using flow cytometry (upper). The % population of CD40LG positive (CD40LG+) cells were normalized to control cells and shown as the mean ± SD from three independent experiments (lower). *p < 0.05; **p < 0.01 (vs. control group).
Fig. 5
Fig. 5. Knockdown of CD28 in T-ALL cells inhibits cell growth by inducing cell-cycle arrest and remarkable apoptosis.
A Representative expression levels of CD28 in manipulated Jurkat and MOLT-4 cells using flow cytometry (upper). The relative intensity of CD28+ cells were normalized to control cells and shown as the mean ± SD from three independent experiments (lower). B Viable cells were counted in manipulated Jurkat and MOLT-4 cells. C Representative cell-cycle distribution of manipulated Jurkat and MOLT-4 cells (left). The % population of cells in each phase is shown as the mean ± SD from three independent experiments (right). D Representative cell apoptosis and necrosis in manipulated Jurkat and MOLT-4 cells staining with Annexin V/7-AAD (left). The % population of apoptotic and necrotic cells in each group is shown as the mean ± SD from three independent experiments (right). NS not significant; *p < 0.05; **p < 0.01 (vs. control group).
Fig. 6
Fig. 6. Knockdown of CD40LG in T-ALL cells inhibits cell growth by inducing cell-cycle arrest and apoptosis.
A Representative expression levels of CD40LG in manipulated Jurkat and MOLT-4 cells using flow cytometry. B Viable cells were counted in manipulated Jurkat and MOLT-4 cells. C Representative cell-cycle distribution of manipulated Jurkat and MOLT-4 cells (left). The % population of cells in each phase is shown as the mean ± SD from three independent experiments (right). D Representative cell apoptosis and necrosis in manipulated Jurkat and MOLT-4 cells staining with Annexin V/7-AAD (left). The % population of apoptotic and necrotic cells in each group is shown as the mean ± SD from three independent experiments (right). NS not significant; *p < 0.05; **p < 0.01 (vs. control group).
Fig. 7
Fig. 7. BACH2-mediated CD28 and CD40LG axes contribute to dissemination of T-ALL cells to the BM.
A Cells were stained with PKH26 prior to seeding onto the pre-established monolayer of HS-5 BMSCs. PKH26 dye intensity in manipulated Jurkat and MOLT-4 cells were normalized to control cells. Data are shown as the mean ± SD from three independent experiments. B ELISA analyses of IL-6 and IL-8 using conditioned media upon coculturing CD28KD or CD40LGKD T-ALL cells with HS-5 cells. The colorimetric values were normalized to the control group. C Experimental design for transwell migration assays. Cells were pre-stained with PKH26 followed by the treatment with PBS (control), hCD28-mAb (0.5 μg/mL), rhCD40 (0.5 μg/mL) or both (hCD28-mAb+rhCD40). PKH26 dye intensity of migrated cells in the lower chamber were measured. D PKH26 dye intensity of migrated cells was normalized to the control group and shown as the mean ± SD from three independent experiments. E Experimental design for testing the effects of activating CD28 and/or CD40LG signals on T-ALL xenografts. F Spleens were isolated and photographed against a ruler in centimeters. G GFP+ cells from spleens (upper) and bone marrows (lower) in each group were analyzed using flow cytometry. Data are presented as the mean ± SEM. NS not significant; *p < 0.05; **p < 0.01 (vs. control group).

Similar articles

Cited by

References

    1. Grunenberg A, Sala E, Kapp-Schwoerer S, Viardot A. Pharmacotherapeutic management of T-cell acute lymphoblastic leukemia in adults: an update of the literature. Expert Opin Pharmacother. 2022;23:561–71. doi: 10.1080/14656566.2022.2033725. - DOI - PubMed
    1. Weng AP, Ferrando AA, Lee W, Morris JPT, Silverman LB, Sanchez-Irizarry C, et al. Activating mutations of NOTCH1 in human T cell acute lymphoblastic leukemia. Science. 2004;306:269–71. doi: 10.1126/science.1102160. - DOI - PubMed
    1. Zhang Z, Yang K, Zhang H. Targeting leukemia-initiating cells and leukemic niches: the next therapy station for T-cell acute lymphoblastic leukemia? Cancers. 2022;14:5655. doi: 10.3390/cancers14225655. - DOI - PMC - PubMed
    1. Muto A, Tashiro S, Nakajima O, Hoshino H, Takahashi S, Sakoda E, et al. The transcriptional programme of antibody class switching involves the repressor Bach2. Nature. 2004;429:566–71. doi: 10.1038/nature02596. - DOI - PubMed
    1. Itoh-Nakadai A, Hikota R, Muto A, Kometani K, Watanabe-Matsui M, Sato Y, et al. The transcription repressors Bach2 and Bach1 promote B cell development by repressing the myeloid program. Nat Immunol. 2014;15:1171–80. doi: 10.1038/ni.3024. - DOI - PubMed

Publication types

MeSH terms

Substances