. 2024 Jan 17;15(1):490.
doi: 10.1038/s41467-023-44388-4.

Upregulated hepatic lipogenesis from dietary sugars in response to low palmitate feeding supplies brain palmitate

Affiliations

Upregulated hepatic lipogenesis from dietary sugars in response to low palmitate feeding supplies brain palmitate

Mackenzie E Smith et al. Nat Commun. .

Abstract

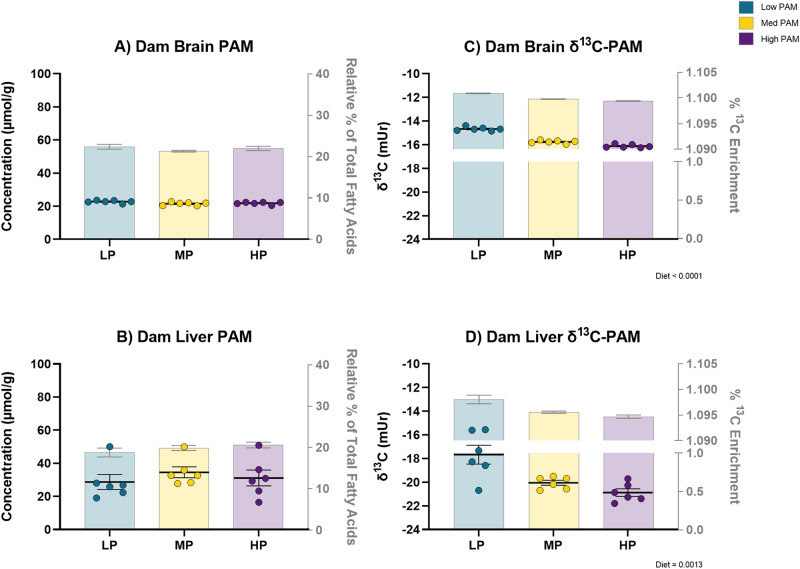
Palmitic acid (PAM) can be provided in the diet or synthesized via de novo lipogenesis (DNL), primarily, from glucose. Preclinical work on the origin of brain PAM during development is scarce and contrasts results in adults. In this work, we use naturally occurring carbon isotope ratios (13C/12C; δ13C) to uncover the origin of brain PAM at postnatal days 0, 10, 21 and 35, and RNA sequencing to identify the pathways involved in maintaining brain PAM, at day 35, in mice fed diets with low, medium, and high PAM from birth. Here we show that DNL from dietary sugars maintains the majority of brain PAM during development and is augmented in mice fed low PAM. Importantly, the upregulation of hepatic DNL genes, in response to low PAM at day 35, demonstrates the presence of a compensatory mechanism to maintain total brain PAM pools compared to the liver; suggesting the importance of brain PAM regulation.


Conflict of interest statement

R.P.B. is supported by grant funding through the Canadian Institutes of Health Research and the Natural Sciences and Engineering Research Council of Canada and holds a Canada Research Chair in Brain Lipid Metabolism. R.P.B. has received industrial grants, including those matched by the Canadian government, and/or travel support related to work on brain fatty acid uptake from Arctic Nutrition, Bunge Ltd., Capsoil Technologies, DSM, Fonterra, Mead Johnson, Natures Crops International, and Nestec Inc. Moreover, R.P.B. and C.T.C. are on the executive committee of the International Society for the Study of Fatty Acids and Lipids and held a meeting on behalf of fatty acids and cell signaling, both of which rely on corporate sponsorship. R.P.B. has given expert testimony in relation to supplements and the brain. There was no role of funders in the conceptualization, design, data collection, analysis, decision to publish or preparation of the manuscript. The remaining authors declare no competing interests.

Figures

Fig. 1
Fig. 1. Male pup brain palmitic acid levels are maintained compared to the liver primarily by lipogenesis from dietary sugars augmented in mice fed low palmitic acid.
While there was a significant effect of diet (relative percentage: p < 0.0001; concentration: p = 0.0351) on male pup liver palmitic acid (PAM) levels (B), there was only a significant main effect of time (relative percentage: p < 0.0001; concentration: p < 0.0001) on male pup brain PAM levels (A). Male pup brain and liver δ13C-PAM values were enriched overall, and there was a significant diet by time interaction on male pup brain δ13C-PAM (C) (p = 0.0008), and a main effect of diet (p < 0.0001) on male pup liver δ13C-PAM (D). Data are biological replicates presented as mean ± SEM analyzed by two-way analysis of variance (ANOVA) (AD) and Tukey’s multiple comparison test (C); ** < 0.002, *** < 0.0002, **** < 0.0001. Brain δ13C-PAM means sharing a bar are significantly different by diet at each timepoint by Tukey’s multiple comparison test; for all tissue δ13C-PAM multiple comparisons irrespective of diet and time refer to Supplementary Table 1. n = 8, 5, 8; 4, 5, 7; 7, 6, 7; 6, 5, 6 male pups per diet per timepoint (AD). Individual data points represent concentration data (for which figure statistics correspond to) while the bars show relative percentage data (A, B). Data points represent δ13C-PAM values (for which figure statistics correspond to) while the bars show %13C enrichment (13C/(13C+12C) (C, D). Source data are provided as a Source Data file. δ13C, 13C/12C; Med medium; PAM palmitic acid.
Fig. 2
Fig. 2. Dam tissue palmitic acid levels are maintained primarily by lipogenesis from dietary sugars augmented in dams fed low palmitic acid.
The levels of dam brain palmitic acid (PAM) (A) and liver PAM (B) were not significantly affected by diet. However, there was a significant effect of diet in both dam brain δ13C-PAM (C) (p < 0.0001) as well as dam liver δ13C-PAM (D) (p = 0.0013). Data are biological replicates presented as mean ± SEM analyzed by ordinary one-way analysis of variance (ANOVA) (A, C, D) or Kruskal–Wallis test (B); n = 6 dams per diet. Individual data points represent concentration data (for which figure statistics correspond to) while the bars show relative percentage data (A, B). Data points represent δ13C-PAM values (for which figure statistics correspond to) while the bars show %13C enrichment (13C/(13C+12C) (C, D). Source data are provided as a Source Data file. δ13C, 13C/12C; HP high palmitic acid, LP low palmitic acid, Med medium, MP medium palmitic acid, PAM palmitic acid.
Fig. 3
Fig. 3. Male day 35 mRNA expression is more variable in the liver than the brain.
Although principal component analysis (PCA) did not reveal distinct clusters by diet group in the male brain (B) or liver (C), there were distinct clusters by PCA between brain and liver tissue (A), in which the liver displayed more variance in expression than the brain. Data points are individual sequenced samples; n = 15 male mice per tissue (biological replicates) (A), n = 5 male mice per diet per tissue (biological replicates) (B, C). Med medium, PAM palmitic acid, PC1 principal component 1, PC2 principal component 2. Created with BioRender.com.
Fig. 4
Fig. 4. Differentially expressed genes identified in the male liver but not the brain at day 35.
Each red and blue point represents up- and down-regulated differentially expressed genes (DEGs), respectively, identified in day 35 male liver but not the brain between male mice fed the high PAM compared to low PAM diet (A) and the medium PAM compared to low PAM diet (B). Data points are individual DEGs. The Wald test was used to identify DEGs between samples in R Studio, with an adjusted p-value of 0.05, and log2 fold change was set to 0.58 for visualization purposes in volcano plot construction. For all DEGs with log2 fold change > 1.2 refer to Supplementary Table 2. n = 5 male mice per diet (biological replicates). DEG differentially expressed gene, HP high palmitic acid, LP low palmitic acid, MP medium palmitic acid. Created with BioRender.com.
Fig. 5
Fig. 5. Differential expression of pathways involved in lipid metabolism identified in the male liver, but not the brain between mice fed high palmitic acid compared to low palmitic acid at day 35.
Contrasting male mice fed the high palmitic acid (PAM) diet compared to the low PAM diet at day 35, genes central to lipid metabolism in pathways including import across the plasma membrane and cholesterol synthesis were upregulated (false discovery rate (FDR = 0.2)), while acyl-CoA and thioester synthesis were downregulated (FDR = 0.2) by gene set enrichment analysis. Red and blue points represent up- and down-regulated gene pathways, respectively. n = 5 male mice per diet (biological replicates). PAM palmitic acid. Created with BioRender.com.
Fig. 6
Fig. 6. Modules enriched for pathways and genes involved in lipid metabolism identified in the male liver but not the brain at day 35.
Of the 9 modules identified in the male day 35 liver by weighted gene co-expression network analysis (WGCNA), 3 modules were enriched for pathways and genes involved in lipid metabolism at day 35 (yellow, blue, green) (A). The top 10 enriched pathways in the yellow module were all related to lipid metabolism (B), and the top 30 genes in the yellow module contained genes central to de novo lipogenesis, fatty acid, and cholesterol synthesis, as well as fatty acid elongation and monounsaturated fatty acid synthesis (C). n = 5 male mice per diet (biological replicates). Soft threshold was set to 6 and a minimum module size of 20 was used. GO gene ontology. Created with BioRender.com.

Similar articles

Cited by

References

    1. Clandinin MT, et al. Intrauterine fatty acid accretion rates in human brain: implications for fatty acid requirements. Early Hum. Dev. 1980;4:121–129. doi: 10.1016/0378-3782(80)90015-8. - DOI - PubMed
    1. Clandinin MT, et al. Extrauterine fatty acid accretion in infant brain: implications for fatty acid requirements. Early Hum. Dev. 1980;4:131–138. doi: 10.1016/0378-3782(80)90016-X. - DOI - PubMed
    1. Lacombe, R. J. S. et al. Quantitative and carbon isotope ratio analysis of fatty acids isolated from human brain hemispheres. J. Neurochem. 10.1111/jnc.15702 (2022). - PubMed
    1. Martinez M. Abnormal profiles of polyunsaturated fatty acids in the brain, liver, kidney and retina of patients with peroxisomal disorders. Brain Res. 1992;583:171–182. doi: 10.1016/S0006-8993(10)80021-6. - DOI - PubMed
    1. Carta G, Murru E, Banni S, Manca C. Palmitic acid: physiological role, metabolism and nutritional implications. Front. Physiol. 2017;8:902. doi: 10.3389/fphys.2017.00902. - DOI - PMC - PubMed