. 2024 Jan 17;14(1):1483.
doi: 10.1038/s41598-024-51947-2.

LncRNA SOX9-AS1 triggers a transcriptional program involved in lipid metabolic reprogramming, cell migration and invasion in triple-negative breast cancer

Affiliations

LncRNA SOX9-AS1 triggers a transcriptional program involved in lipid metabolic reprogramming, cell migration and invasion in triple-negative breast cancer

Mireya Cisneros-Villanueva et al. Sci Rep. .

Abstract

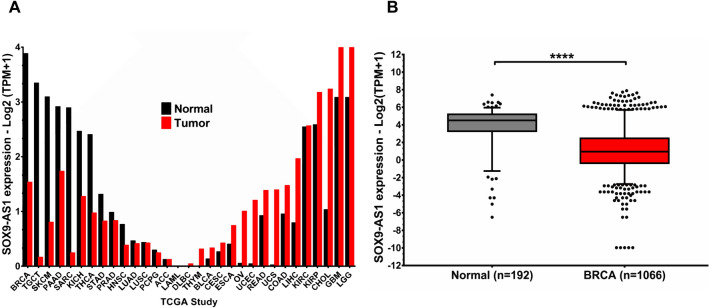
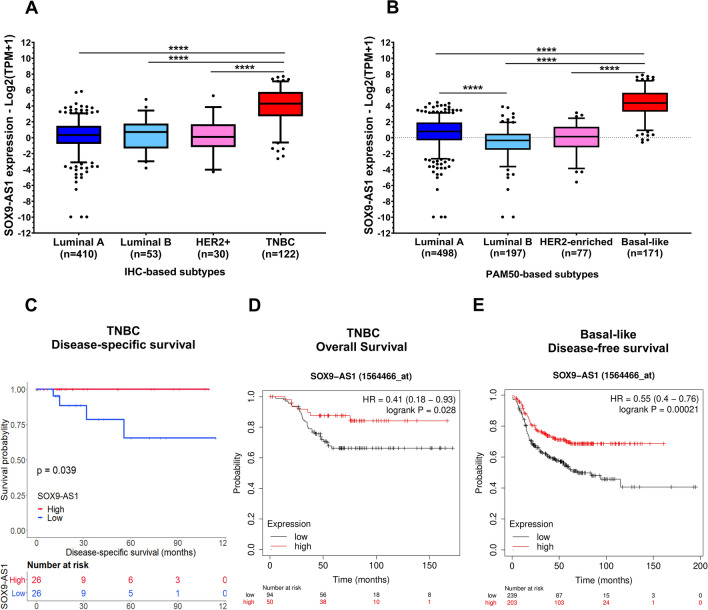
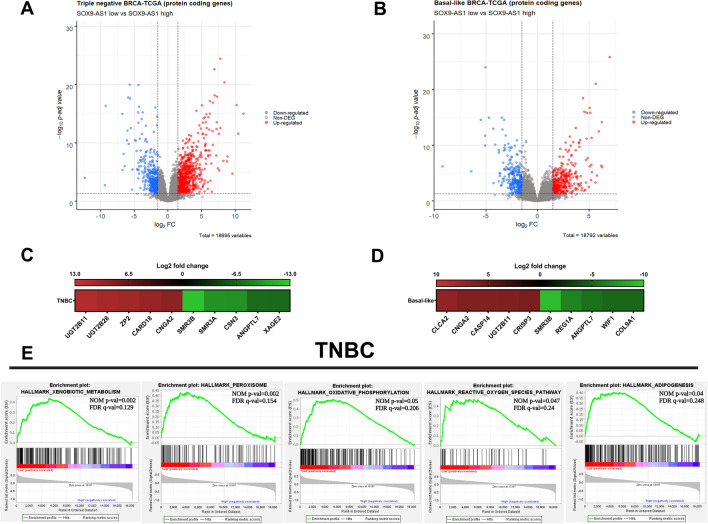
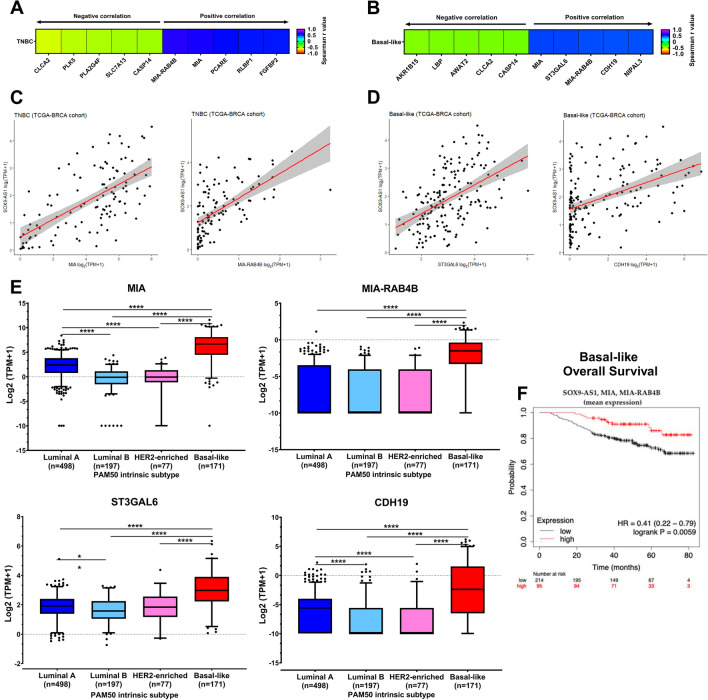
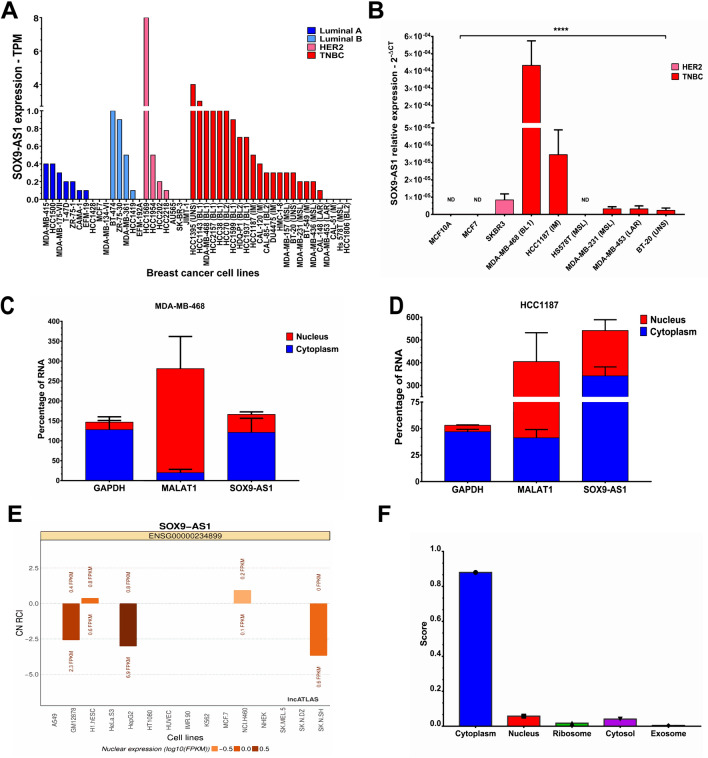
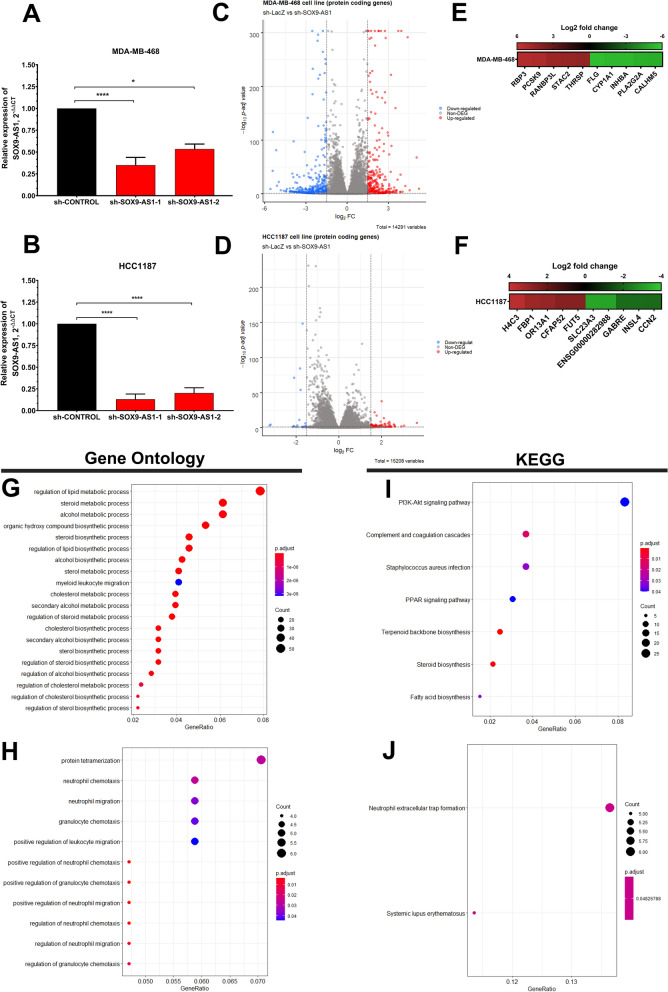
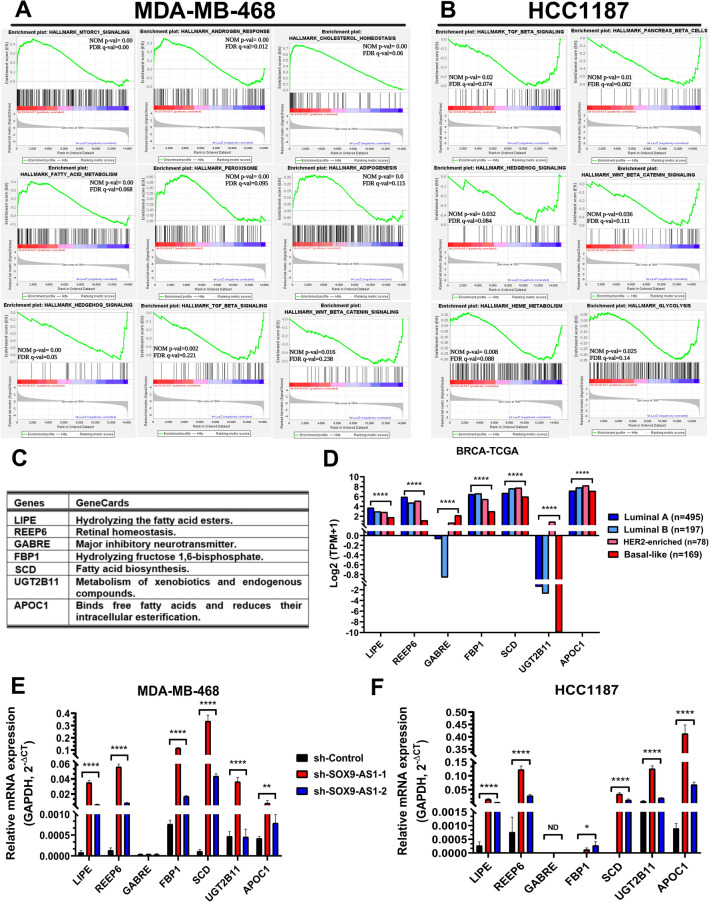
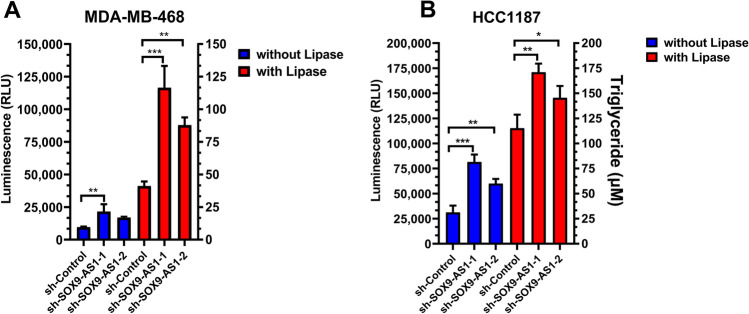
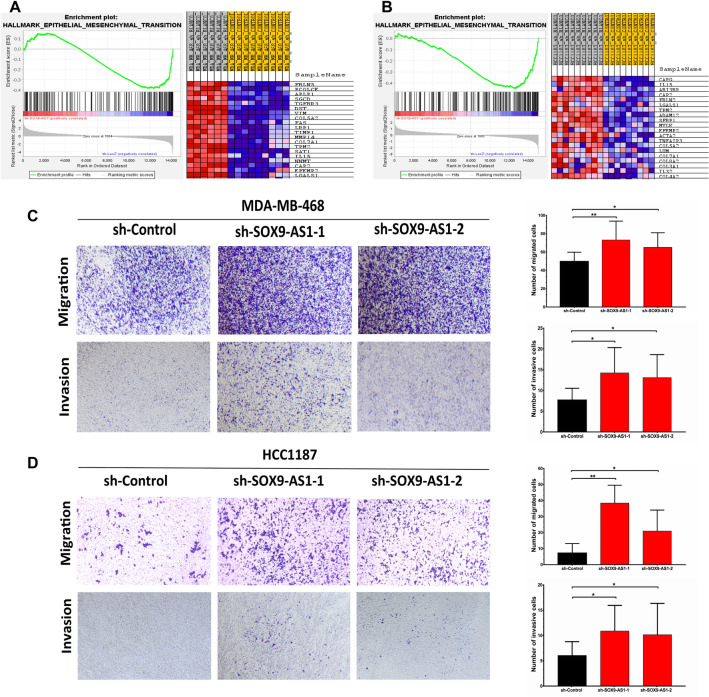
At the molecular level, triple-negative breast cancer (TNBC) is frequently categorized as PAM50 basal-like subtype, but despite the advances in molecular analyses, the clinical outcome for these subtypes is uncertain. Long non-coding RNAs (lncRNAs) are master regulators of genes involved in hallmarks of cancer, which makes them suitable biomarkers for breast cancer (BRCA) diagnosis and prognosis. Here, we evaluated the regulatory role of lncRNA SOX9-AS1 in these subtypes. Using the BRCA-TCGA cohort, we observed that SOX9-AS1 was significantly overexpressed in basal-like and TNBC in comparison with other BRCA subtypes. Survival analyzes showed that SOX9-AS1 overexpression was associated with a favorable prognosis in TNBC and basal-like patients. To study the functions of SOX9-AS1, we determined the expression levels in a panel of nine BRCA cell lines finding increased levels in MDA-MB-468 and HCC1187 TNBC. Using subcellular fractionation in these cell lines, we ascertained that SOX9-AS1 was located in the cytoplasmic compartment. In addition, we performed SOX9-AS1 gene silencing using two short-harping constructs, which were transfected in both cell models and performed a genome-wide RNA-seq analysis. Data showed that 351 lncRNAs and 740 mRNAs were differentially expressed in MDA-MB-468 while 56 lncRNAs and 100 mRNAs were modulated in HCC1187 cells (Log2FC < - 1.5 and > 1.5, p.adj value < 0.05). Pathway analysis revealed that the protein-encoding genes potentially regulate lipid metabolic reprogramming, and epithelial-mesenchymal transition (EMT). Expression of lipid metabolic-related genes LIPE, REEP6, GABRE, FBP1, SCD1, UGT2B11, APOC1 was confirmed by RT-qPCR. Functional analysis demonstrated that the knockdown of SOX9-AS1 increases the triglyceride synthesis, cell migration and invasion in both two TNBC cell lines. In conclusion, high SOX9-AS1 expression predicts an improved clinical course in patients, while the loss of SOX9-AS1 expression enhances the aggressiveness of TNBC cells.


Conflict of interest statement

The authors declare no competing interests.

Figures

Figure 1
Figure 1
SOX9-AS1 expression is deregulated in different human tumors. (A) SOX9-AS1 expression profile across all tumor samples and normal tissues (bar plot). The height of bar represents the median expression of tumor (red bars) and normal tissue (black bars) (data obtained from GEPIA2 platform). (B) SOX9-AS1 expression in normal breast tissue samples versus BRCA tissue determined by RNA-seq from the BRCA-TCGA cohort. Statistical differences between groups were compared using the Mann–Whitney test, ****p < 0.0001.
Figure 2
Figure 2
High SOX9-AS1 expression is associated with better prognosis in basal-like and TNBC. SOX9-AS1 expression between (A) receptor status (IHC), and (B) molecular subtypes classified by PAM50. The horizontal lines in the box plots represent the medians, the boxes represent the interquartile ranges, and the whiskers represent the 5th and 95th percentiles. RNA-seq data from the BRCA-TCGA cohort. Dunn's multiple comparisons and Kruskal–Wallis tests, ****p < 0.0001. (C) Kaplan–Meier curve of TNBC patients classified into high- and low-risk groups using the upper and lower quartiles of SOX9-AS1 expression for disease-specific survival (the analysis was conducted on 144 patients). Log-rank test between patients with low fold-change ( < -1.5) and high fold-change (> 1.5) and p value < 0.05. (D) Overall Survival in TNBC patients (the analysis was conducted on 144 patients), and (E) disease-free survival in basal-like patients, using Kaplan–Meier curves (the analysis was conducted on 442 patients), determined by Kaplan–Meier Plotter (breast). In red: patients with expression of SOX9-AS1 above the automatic cutoff calculation. In black, patients with expressions of SOX9-AS1 below automatic cutoff calculation.
Figure 3
Figure 3
GSEA analyses of DEGs in TNBC and basal-like samples of the BRCA-TCGA cohort. The Volcano plots represent the distribution of DEGs. Blue genes are downregulated, red genes are upregulated, and gray genes are not differentially expressed in (A) TNBC-TCGA, and (B) basal-like-TCGA samples. Up- and downregulated genes were defined as Log2FC < - 1.5 and > 1.5 with adjusted p value < 0.05. Heatmap of the DGEs contributing to top 5 in (C) TNBC and (D) basal-like samples. Green: low expression, red: high expression according to Log2 fold change (visualized on the color bar above the heatmap). (E) Using the Hallmark gene set, genes involved in xenobiotic metabolism, peroxisome pathway, oxidative phosphorylation, reactive oxygen species pathway, and adipogenesis were significantly enriched in TNBC samples with FDR q value < 0.25. The NOM p value and FDR q value are displayed.
Figure 4
Figure 4
Correlation of SOX9-AS1 expression with genes in TNBC and basal-like samples from BRCA-TCGA cohort. Heatmap showing the top 5 genes that show the greatest negative and positive correlation with the SOX9-AS1 expression in (A) TNBC and (B) basal-like samples. (C) Correlation plots of SOX9-AS1 expression with MIA, and MIA-RAB4B in TNBC. (D) Correlation plots of SOX9-AS1 expression with ST3GAL6, CDH19 in basal-like samples. Spearman's rank correlation critical value was used for the analysis. (E) Expression level of MIA, MIA-RAB4B, ST3GAL6, and CDH19 between molecular subtypes classified by PAM50 (determined by RNA-seq in the BRCA-TCGA cohort). Dunn's multiple comparisons and Kruskal–Wallis tests (****p < 0.0001). (F) Kaplan–Meier curve depicting the influence of SOX9-AS1, MIA and MIA-RAB4B mean expression on Overall Survival probability for basal-like patients (the analysis was conducted on 309 patients).
Figure 5
Figure 5
Expression and subcellular localization of SOX9-AS1 in TNBC and basal-like cell lines. (A) Broad Institute Cancer Cell Line expression data of SOX9-AS1 across 46 distinct BRCA cell lines examined by RNA-seq. (B) SOX9-AS1 expression between BRCA cell lines examined by RT-qPCR. Mean ± SD. One-way ANOVA comparison test, ****p < 0.0001. (C) Subcellular localization of SOX9-AS1 in MDA-MB-468, and (D) HCC1187 cells was determined by by RT-qPCR after nuclear/cytoplasmic fractionation using MALAT1 as control for nucleus and GAPDH as control for cytoplasm. Analyses were performed three times in triplicate in vitro. (E) Subcellular localization of SOX9-AS1 in various cell lines predicted using the lncATLAS database. (F) Subcellular localizations of SOX9-AS1 determined by lncLocator predictor which includes RNA localization data from experimental evidence. ND: not detected.
Figure 6
Figure 6
Knockdown of SOX9-AS1 and DEGs involved in metabolic and immunological processes and pathways in TNBC cells in vitro. Analysis of SOX9-AS1 levels by RT-qPCR assays in (A) MDA-MB-468, and (B) HCC1187 cells transfected with two SOX9-AS1-targeting shRNAs and control shRNA (sh-Control). Student T test. *p < 0.05, ****p < 0.0001. The Volcano plots represent the distribution of DEGs. Blue genes are downregulated, red genes are upregulated, and gray genes are not differentially expressed in (C) MDA-MB-468, and (D) HCC1187 cells. Up- and downregulated genes were defined as Log2 Fold Change ≤ − 1.5 and > 1.5 with adjusted p values < 0.05. Heatmap of the DGEs contributing to the top 5 in (E) MDA-MB-468 and (F) HCC1187 cells. Green: low expression, red: high expression according to Log2 fold change. Bubble map for the top 20 enriched GO classifications in (G) MDA-MB-468, and (H) HCC1187 cells. The most enriched KEGG pathways of DEGs in (I) MDA-MB-468, and (J) HCC1187 cell models. The size of the q-value is represented by the point’s color.
Figure 7
Figure 7
SOX9-AS1 potentially regulates a variety of signalling pathways and metabolic cellular processes in TNBC cells. GSEA for the hallmark gene sets after SOX9-AS1 silencing showed significant positive and negative enrichment (FDR q-value ≤ 0.25) in (A) MDA-MB-468, and (B) HCC1187. The NOM p-val and FDR q-value are displayed. (C) Seven genes involved in cellular metabolism were validated. (D) Distribution of candidate genes across PAM50-subtypes from BRCA-TCGA cohort. Data represent median expression value. Dunn's multiple comparisons and Kruskal–Wallis tests (****p < 0.0001). Validation of gene expression by RT-qPCR in (E) MDA-MB-468, and (F) HCC1187 cells transfected with two SOX9-AS1-targeting shRNA and sh-Control. Bar graph shows the quantified results with means ± SD of three biological replicates. Tukey’s test (*p < 0.05 and ****p < 0.0001 vs. sh-Control). ND: not detected.
Figure 8
Figure 8
SOX9-AS1-knockdown increases intracellular triglyceride levels in TNBC cells. Intracellular triglycerides were quantified as glycerol (in relative light units-RLU) following treatment with or without Lipase in (A) MDA-MB-468 and (B) HCC1187 cells transfected with sh-control, sh-SOX9-AS1-1 or sh-SOX9-AS1-2. Values represent mean ± SD for three biological replicates. One-way ANOVA analysis for each cell line. *p < 0.05, **p < 0.001, ***p < 000.1.
Figure 9
Figure 9
Knockdown of SOX9-AS1 increases cell migration and invasion in TNBC cells. The DEGs obtained by RNA-seq data from the SOX9-AS1-knockdown in (A) MDA-MB-468 and (B) HCC1187 cells was analyzed with GSEA enrichment plots for the HALLMARK_EPITHELIAL_MESENCHYMAL_TRANSITION gene set. (C) Representative images of transwell migration and invasion assays after SOX9-AS1-knockdown in MDA-MB-468 cells and (D) HCC1187 cells and corresponding control cells. Bar graph shows the quantification of the results with means ± standard deviation. *p < 0.05 and **p < 0.01 vs. sh-Control.

References

    1. Garrido-Castro AC, Lin NU, Polyak K. Insights into molecular classifications of triple-negative breast cancer: Improving patient selection for treatment. Cancer Discov. 2019;9:176–198. doi: 10.1158/2159-8290.CD-18-1177. - DOI - PMC - PubMed
    1. Perou CM, et al. Molecular portraits of human breast tumours. Nature. 2000;406:747–752. doi: 10.1038/35021093. - DOI - PubMed
    1. Sorlie T, et al. Gene expression patterns of breast carcinomas distinguish tumor subclasses with clinical implications. Proc. Natl. Acad. Sci. USA. 2001;98:10869–10874. doi: 10.1073/pnas.191367098. - DOI - PMC - PubMed
    1. Hu Z, et al. The molecular portraits of breast tumors are conserved across microarray platforms. BMC Genom. 2006;7:96. doi: 10.1186/1471-2164-7-96. - DOI - PMC - PubMed
    1. Sorlie T, et al. Distinct molecular mechanisms underlying clinically relevant subtypes of breast cancer: Gene expression analyses across three different platforms. BMC Genom. 2006;7:127. doi: 10.1186/1471-2164-7-127. - DOI - PMC - PubMed

MeSH terms