. 2024 Mar;5(3):481-499.
doi: 10.1038/s43018-023-00710-z. Epub 2024 Jan 17.

INPP5A phosphatase is a synthetic lethal target in GNAQ and GNA11-mutant melanomas

Affiliations

INPP5A phosphatase is a synthetic lethal target in GNAQ and GNA11-mutant melanomas

Ahmed M O Elbatsh et al. Nat Cancer. 2024 Mar.

Abstract

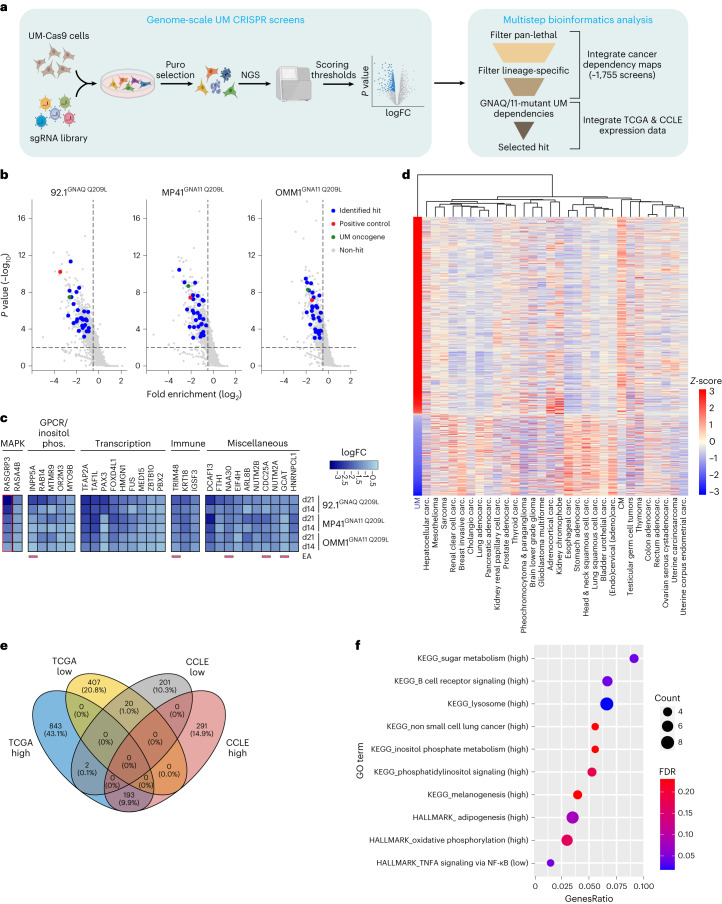
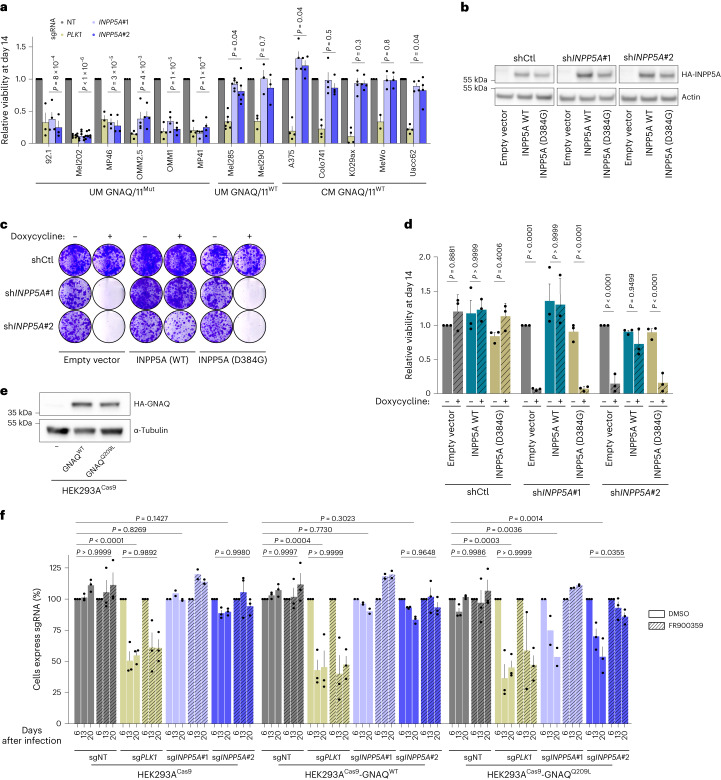
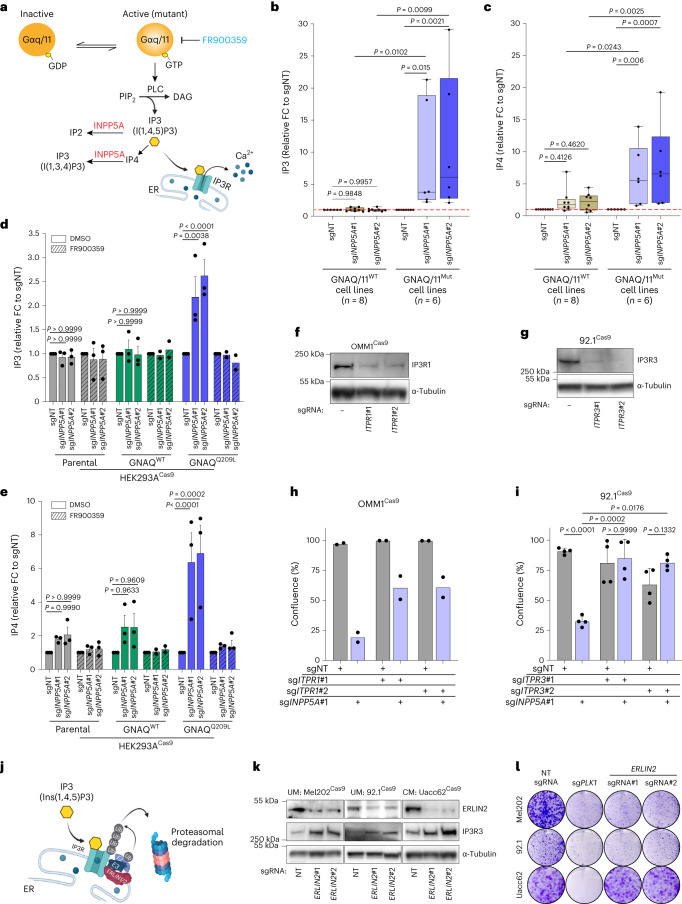
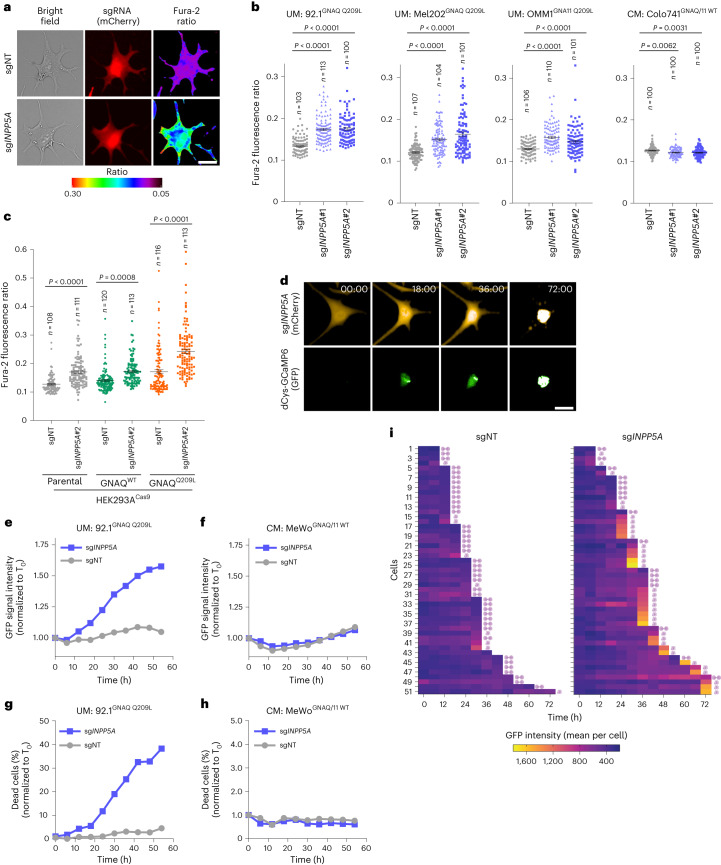
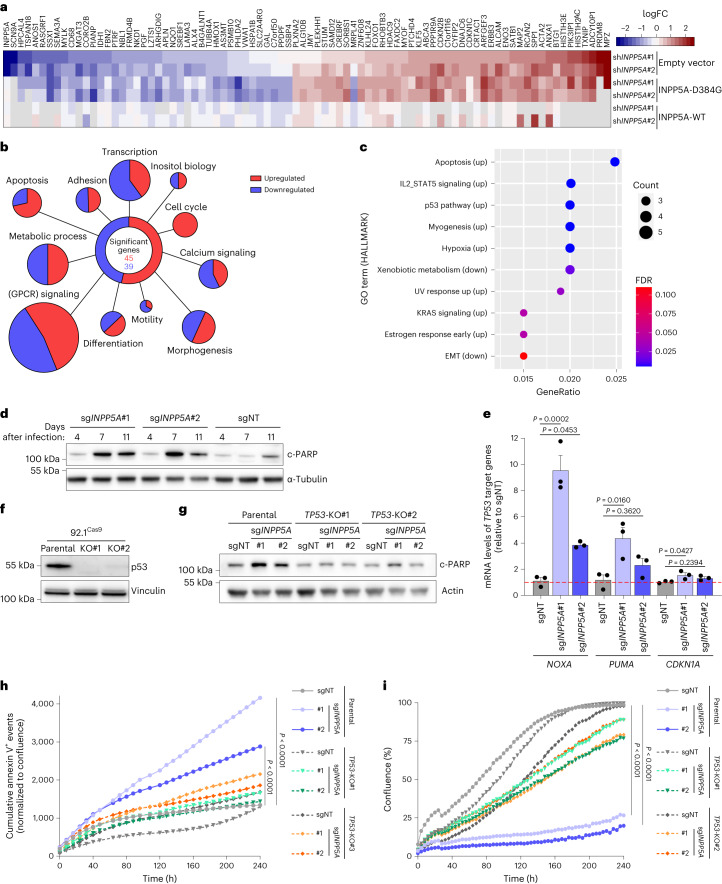
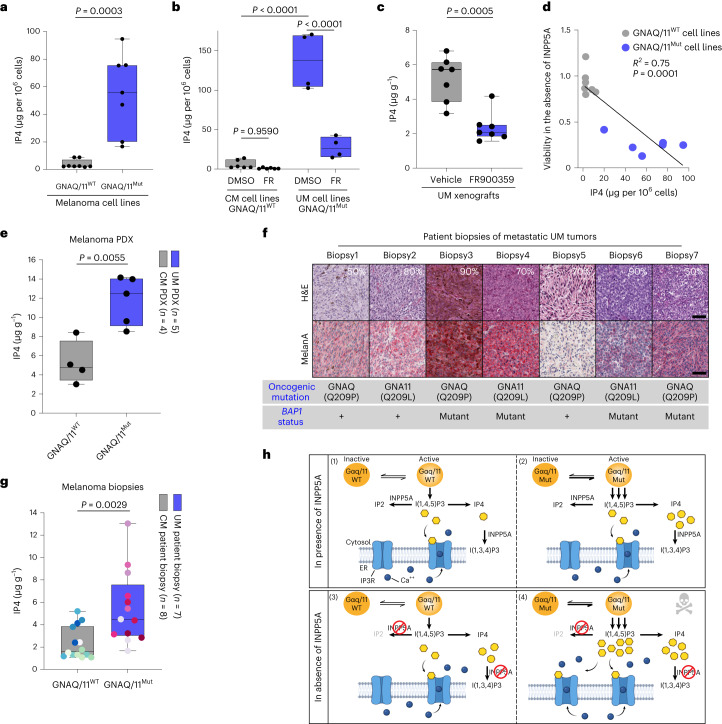
Activating mutations in GNAQ/GNA11 occur in over 90% of uveal melanomas (UMs), the most lethal melanoma subtype; however, targeting these oncogenes has proven challenging and inhibiting their downstream effectors show limited clinical efficacy. Here, we performed genome-scale CRISPR screens along with computational analyses of cancer dependency and gene expression datasets to identify the inositol-metabolizing phosphatase INPP5A as a selective dependency in GNAQ/11-mutant UM cells in vitro and in vivo. Mutant cells intrinsically produce high levels of the second messenger inositol 1,4,5 trisphosphate (IP3) that accumulate upon suppression of INPP5A, resulting in hyperactivation of IP3-receptor signaling, increased cytosolic calcium and p53-dependent apoptosis. Finally, we show that GNAQ/11-mutant UM cells and patients' tumors exhibit elevated levels of IP4, a biomarker of enhanced IP3 production; these high levels are abolished by GNAQ/11 inhibition and correlate with sensitivity to INPP5A depletion. Our findings uncover INPP5A as a synthetic lethal vulnerability and a potential therapeutic target for GNAQ/11-mutant-driven cancers.


Conflict of interest statement

All authors except M.J.J., J.M.M.G. and M.P.L. are/were employees of Novartis Pharma during their time of contribution to this study. The authors declare no competing interests.

Figures

Fig. 1
Fig. 1. Genome-scale CRISPR-Cas9 screens identify genetic dependencies in GNAQ/11-mutant UM cells.
a, Schematic of the integrative approach used to identify specific genetic dependencies in GNAQ/11-mutant UM cells. FC, fold change; NGS, next-generation sequencing. b, Gene-level fold enrichment of sgRNAs in UM cell lines (x axis) and one-sided P values at day 21 (y axis). Dashed lines indicate significance (P < 0.01) and fold enrichment ≤−0.5. Positive control (RASGRP3) is depicted in red and driver oncogenes (GNAQ or GNAQ11) are in green. Genes that passed all filtering steps (Extended Data Fig. 1c) on both days 14 and 21 (n = 29 genes) are shown in blue. c, Heat map depicting fold enrichment of identified genes in b. The positive control (RASGRP3) is highlighted in red. Genes are categorized based on biological function. Genes encoding proteins with enzymatic activity are underlined. Inositol phos., inositol phosphate biology; EA, enzymatic activity. d, Heat map depicting median per tumor group mRNA expression z-scores (y axis) in the indicated solid cancers (x axis) analyzed from TCGA dataset. Dendrogram shows the clustering of tumor types based on the gene expression profiles. Carc., carcinoma. e, Venn diagram showing the overlap of differentially expressed genes (high, highly expressed genes; low, lowly expressed genes) in UM compared to other solid cancers analyzed from TCGA and CCLE datasets. f, Dot plot displaying MSigDB KEGG and HALLMARK pathways enrichment analysis for highly expressed (high) and lowly expressed (low) genes in UM. Dot color depicts the false discovery rate (FDR) value and dot size indicates the number of genes overlapping with the pathway gene list. Source data
Fig. 2
Fig. 2. INPP5A is synthetic lethal with GNAQ/11 oncogenic mutations.
a, Relative viability of the depicted cell lines 14 d following sgRNA transduction. Two sgRNAs against INPP5A, sgINPP5A#1 and sgINPP5A#2; negative control, non-targeting (NT); and positive control, PLK1 sgRNAs were used (all cell lines n = 4, MP41, MeWo and Mel290 n = 3, Mel285 n = 6, and Mel202 n = 7 biologically independent samples were used). b, Immunoblot showing expression levels of empty expression vector, HA-INPP5A wild-type or HA-INPP5A-D384G (phosphatase-deficient) in 92.1 UM cells transduced with the indicated sgRNAs. c, Clonogenic growth of cell lines shown in b 14 d following the induction of shRNA expression by doxycycline (n = 3 independent experiments). shCtl, control shRNA. d, Relative viability of the depicted cell lines 14 d following the induction of shRNA expression by doxycycline, n = 3 independent experiments. e, Immunoblot showing expression levels of HA-GNAQ in HEK293A-Cas9 parental cells or cells expressing HA-GNAQWT or HA-GNAQQ209L cDNAs. f, Competition-based proliferation assay in HEK293A-Cas9 parental cells or cells expressing the indicated HA-GNAQ cDNAs treated with dimethylsulfoxide (DMSO) or GNAQ/11 inhibitor (FR900359 10 nM). Percentage of cells expressing sgRNAs (mCherry+ cells) at the indicated time points are shown, n = 3 biologically independent samples for all conditions except for sgINPP5A#1 n = 2. All data are presented as mean ± s.e.m.; P values were determined using an unpaired Student’s t-test with multiple comparisons (a) or two-way analysis of variance (ANOVA) with multiple comparisons (d,f). Western blots were repeated twice and representative experiments are shown. Source data
Fig. 3
Fig. 3. Enhanced IP3 signaling drives INPP5A dependency in GNAQ/11-mutant UM cells.
a, Schematic depiction of INPP5A-mediated metabolic flux of inositol phosphates upon GNAQ/11 activation. FR900359 is a GNAQ/11 inhibitor. b,c, Box plots of IP3 (b) and IP4 (c) levels quantified by mass spectrometry 72 h after INPP5A depletion. Mean values of all cell lines (n indicates number of cell lines per group) shown as relative FC, n = 3 (eight cell lines) or n = 2 (six cell lines) independent experiments. d,e, Quantitative analysis of IP3 (d) and IP4 (e) levels of HEK293A-Cas9 parental or HA-GNAQ-expressing cells 72 h after transduction with indicated sgRNAs. Data are shown as relative FC to control, n = 3 independent experiments. f, Immunoblot showing levels of IP3R1 following its depletion with two sgRNAs (sgITPR1#1 and sgITPR1#2) in OMM1-Cas9 cells. g, Immunoblot showing levels of IP3R3 following its depletion with two sgRNAs (sgITPR3#1 and sgITPR3#2) in 92.1-Cas9 cells. h, Growth of OMM1-Cas9 cells depicted as percentage confluence 18 d post-transduction with the indicated sgRNAs, n = 2 independent experiments. i, Growth of 92.1-Cas9 cells depicted as percentage confluence 14 d post-transduction with the indicated sgRNAs, n = 4 independent experiments. j, Schematic depiction of the proteasomal degradation of IP3 receptors. k, Immunoblot showing levels of ERLIN2 and IP3R3 after ERLIN2 depletion with two sgRNAs (sgERLIN2#1 and sgERLIN2#2) in the indicated cell lines. l, Clonogenic growth of depicted cell lines 18 d after transduction with the indicated sgRNAs. Positive control, PLK1, n = 3 for 92.1 and Uacc62 and n = 2 for Mel202. All data are presented as mean ± s.e.m.; P values were determined by one-way ANOVA with multiple comparisons (b,c,i) or two-way ANOVA with multiple comparisons (d,e). Box plots show 25th to 75th percentiles, the center line depicts the median and whiskers depict minimum and maximum values (b,c). Western blots were repeated twice and representative experiments are shown. Source data
Fig. 4
Fig. 4. INPP5A depletion preferentially results in elevated cytosolic calcium levels in GNAQ/11-mutant UM cells.
a, Representative images of the fluorescence signal ratio (F340/F380) of the ratiometric calcium indicator fura-2 in cells transduced with indicated sgRNA (mCherry+). Scale bar, 20 µm. b, Quantification of fura-2 fluorescence signal ratio (F340/F380) 72 h after transduction with the indicated sgRNAs in the depicted cell lines. Each point represents a cell (n indicates cell number quantified per group). A representative of n = 3 for 92.1 and OMM1 and n = 2 for Mel202 and Colo741 independent experiments is shown. c, Same as b for HEK293A-Cas9 parental or cells HA-GNAQ-expressing cells. A representative of n = 2 independent experiments is shown. d, Representative time-lapse images of 92.1-Cas9 cells expressing sgRNA (mCherry+) and calcium indicator dCys-GCaMP6 (GFP+). GFP is activated upon calcium binding to dCys-GCaMP6. Time is depicted in hours. Scale bar, 20 µm. e,f, Quantification of normalized GFP signal intensity of 92.1-Cas9 (e) and MeWo-Cas9 (f) cells transduced with the indicated sgRNAs. Cells were treated with the calcium ATPase inhibitor (thapsigargin 1.5 nM) at the start of imaging. A representative of n = 2 independent experiments is shown. g,h, Quantification of the percentage of dead cells of 92.1-Cas9 (g) and MeWo-Cas9 (h) cells transduced with the indicated sgRNAs and treated with the calcium ATPase inhibitor (thapsigargin 1.5 nM) at the start of imaging. A representative of n = 2 independent experiments is shown. i, Single-cell-tracking analysis of GFP intensity coupled to cell fate of 92.1-Cas9 cells transduced with sgNT (left) or sgINPP5A (right). All cells that either died or divided in randomly selected fields of view were quantified. Each row represents one single cell. A representative of n = 2 experiments is shown. All data are presented as mean ± s.e.m.; P values were determined by one-way ANOVA with multiple comparisons (b,c). Source data
Fig. 5
Fig. 5. INPP5A depletion induces p53-dependent apoptosis in GNAQ-mutant UM cells.
a, Heat map of RNA-seq transcriptome analysis showing differentially expressed genes (DEGs; n = 84 genes) in 92.1 cells expressing empty expression vector, wild-type or phosphatase-deficient (D384G) INPP5A cDNA. Genes with log2-fold change >1 or <−1 in shINPP5A-expressing cells and not with control shRNA are shown (P < 0.01, n = 3 biological repeats). b, Display showing DEGs in a categorized per biological function. c, Dot plot showing pathways enrichment analysis on HALLMARK gene sets performed on DEGs shown in a. Up, upregulated pathways; down, downregulated pathways. d, Immunoblot showing levels of c-PARP in 92.1 cells 4, 7 and 11 d after transducing the cells with the indicated sgRNAs. e, Quantitative real-time PCR (qRT–PCR) analysis of the p53 target genes NOXA, PUMA and CDKN1A in 92.1-Cas9 cells post-transduction with the indicated sgRNAs, n = 3 biologically independent samples. f, Immunoblot showing levels of p53 in parental and two independent TP53 knockout (KO#1 and KO#2) in 92.1-Cas9 cell lines. g, Immunoblot showing levels of c-PARP in 92.1-Cas9 parental or TP53 knockout cell lines transduced with the indicated sgRNAs. h, Cumulative annexin V+ events normalized to confluence percentage of the depicted cell lines after transduction with the indicated sgRNAs. A representative example of n = 3 independent experiments is shown. i, Growth curves shown as confluence percentage of the depicted cell lines after transduction with the indicated sgRNAs. A representative example of n = 3 independent experiments is shown. Data are presented as mean ± s.e.m.; P values were determined by one-way ANOVA with multiple comparisons (e,h,i). Western blots were repeated at least twice with similar results. Source data
Fig. 6
Fig. 6. INPP5A is required for UM tumor growth and metastasis development.
a,b, Box plots of tumor volumes of 92.1 (a) and Mel202 (b) xenografts at day 30 with or without doxycycline treatment shown as relative FC to day 0. Each circle depicts one mouse, for 92.1 xenografts, n = 6 mice per group except for the shCtl + Dox group n = 5 and for Mel202 xenografts n = 4 mice per group. shCtl, control shRNA. Dox, doxycycline. c, Immunohistochemistry staining of the proliferation marker Ki67 in 92.1 xenografts with or without Dox induction of the depicted shRNAs at day 10, n = 3 mice per group except for the shCtl + Dox group n = 2 mice. Scale bar, 100 µm. d, Schematic outline for the setup of the in vivo UM metastasis experiment. n indicates the number of mice examined per group. e, Bioluminescence imaging of NSG mice transplanted with 92.1-luciferase-labeled cells. Cells were transduced with the indicated shRNAs prior transplantation and mice were treated with Dox as indicated. Images were taken on days 21, 31, 41 and 51 post-transplantation. i.v., intravenous. f, Quantification of bioluminescence signal from the liver of the mice treated as indicated in d. Number of mice used per group is indicated in d. g, Kaplan–Meier survival curves of mice treated as indicated in d until reaching the humane end points (Methods). Data are presented as mean ± s.e.m.; P values were determined by two-tailed, unpaired Student’s t-test (a,b) or two-way ANOVA with multiple comparisons (f). Survival curves in g were assessed with log-rank (Mantel–Cox) test and two-sided Gehan–Breslow–Wilcoxon test. Box plots in a,b show the 25th to 75th percentiles, the center line depicts the median and whiskers depict minimum and maximum values. Source data
Fig. 7
Fig. 7. IP4 is a predictive biomarker of INPP5A dependence that is elevated in UM patients’ tumor samples.
a,b, Box plots showing IP4 levels displayed as µg per million cells in GNAQ/11WT cell lines, n = 8 and GNAQ/11Mut cell lines, n = 7 (a) or after treatment with DMSO or GNAQ/11 inhibitor (FR900359 10 nM) for 16 h in GNAQ/11WT cell lines, n = 6 and GNAQ/11Mut cell lines, n = 4 (b). c, Box plots showing IP4 levels displayed as µg g−1 of tumor tissue of 92.1 xenograft tumors. Mice were treated with vehicle or FR900359 (4 mg kg−1, i.v) for 24 h, n = 7 mice per group. d, Scatter-plot illustrating the correlation between cell viability upon INPP5A depletion and levels of IP4 in µg per million cells in GNAQ/11WT cell lines, n = 7 and GNAQ/11Mut cell lines, n = 6. e, Box plots of IP4 levels shown as µg g−1 of tumor tissue of PDX of GNAQ/11WT CM models, n = 4 and GNAQ/11Mut or CYSLTR2Mut UM models, n = 5. f, Representative images of hematoxylin and eosin (H&E) and Melan A immunohistochemistry of UM patients’ tumor samples, n = 7 biopsies. Percentage of tumor content, oncogenic mutation and BAP1 mutational status are shown. Scale bar, 50 μm. g, Box plots of IP4 levels shown as µg g−1 of tumor tissue of GNAQ/11WT CM patients’ samples, n = 8 and GNAQ/11Mut UM patients’ samples, n = 7. All biopsies are represented by two distinct histological sections (indicated as matching-color dots), except two biopsies per tumor type each is represented by one section. h, Schematic model describing the mechanism of INPP5A dependency in GNAQ/11Mut UM cells. Gαq/11, GNAQ/11 proteins; Ca++, calcium. All data are presented as mean ± s.e.m.; P values were determined by two-tailed, unpaired Student’s t-test (ac,e,g). Two-tailed Pearson’s correlation with 95% confidence interval (d). Box plots show the 25th to 75th percentiles, the center line depicts the median and whiskers depict minimum and maximum values (ac,e,g). Source data
Extended Data Fig. 1
Extended Data Fig. 1. Genome-scale CRISPR KO screens in 92.1, MP41 and OMM1 UM cell lines.
a, Graph depicting number of cell doublings of the indicated cell lines over the screens’ durations. Cells number counting started on day 4 after seeding for the expansion phase of the screen following the completion of puromycin selection. Cells were harvested and counted every 3 to 4 days. Dashed lines indicate harvesting time points for genomic DNA isolation on days 4, 14 and 21. Data presented as mean ± s.e.m.; n = 3 biologically independent samples. b, Scatter plots of log2-transformed gene-level fold enrichment of the indicated cell lines on days 4, 14 and 21 of the CRISPR-Cas9 screens. Correlation between the 3 screens on days 14 and 21 is shown. The high degree of correlation between the screens performed on different cell lines highlights the reproducibility of the screens. Red, light green and gray dots depict pan-lethal, nonlethal, and all other genes, respectively. Approximately 50 pan-lethal and 50 nonlethal genes were unbiasedly selected as described. Nonlethal and pan-lethal genes overlapped on day 4. On days 14 and 21, pan-lethal genes were strongly depleted from the bulk population while nonlethal genes remained largely unchanged compared to day 4 indicating the technical success of the screens. c, Scatter plots of median log2-transformed gene-level fold enrichment of CRISPR-Cas9 screens performed with project AVANA (x axis) and 92.1 screen (left), OMM1 screen (middle) and MP41 screen (right) performed in this study at days 14 (top panel) and 21 (bottom panel) (y axis). Different dot colors depict genes that were removed at each filtering step of the analysis pipeline used to select the final gene list. Dashed lines represent the scoring threshold of the Log2FC of UM screens (≤ −0.5). Blue dots represent final hits. d, Heat map depicting fold enrichment of genes that passed all filters shown in (c) only on day 21 but not on day 14 (n = 13). Genes are categorized based on their biological function. Genes encoding proteins with enzymatic activity are underlined. EA, enzymatic activity. e, Heat map depicting median per tumor group mRNA expression z-scores (y axis) in UM cell lines compared to all other cell lines of solid tumors analyzed from CCLE expression dataset (x axis). Cancer types represented by less than 5 cell lines were excluded to account for statistical power. Dendrogram shows the clustering of cell lines based on the expression profiles of all genes. f, Gene-level fold enrichment of sgRNAs of UM CRISPR-Cas9 screens (x axis) and one-sided P values at day 21 (y axis). Dashed lines indicate significance (P < 0.01) and LogFC (≤ −0.5). Blue dots represent INPP5A and red dots represent other inositol phosphatases encoded in the human genome (INPP1, INPP4A, INPP4B, INPP5B, INPP5D, INPP5E, INPP5F, INPP5J, INPP5K and INPPL1). Source data
Extended Data Fig. 2
Extended Data Fig. 2. INPP5A is essential for the survival of uveal melanoma cells.
a, Table summarizing relevant information of all cell lines used to conduct the experiments of this study. OMM2.3 and OMM2.5 cell lines are derived from liver metastatic UM tumors of the same patient. Only OMM2.5 was used in this study. b, Immunoblot showing levels of BAP1, pRASGRP3 and pERK in the indicated cell lines. BAP1 is a tumor suppressor that is known to be frequently mutated in metastatic UM tumors and its loss is associated with poor prognosis. l.e., low exposure, h.e., high exposure. c, Proliferation percentage of the indicated cell lines relative to DMSO treatment upon the inhibition of GNAQ/11 activity with FR900359 (FR) for 5 days (top). Growth inhibition 50 (GI50, nM) values for each cell line is shown (bottom). Inhibition of GNAQ/11 activity with FR suppressed the proliferation of 92.1 (GNAQ-Q209L), MP41 (GNA11-Q209L), MP46 (GNAQ-Q209L, BAP1 null), and OMM2.5 (GNAQ-Q209P, liver metastatic) cell lines, but did not affect the proliferation of the GNAQ/11WT cell lines, Mel285 or Mel290, n = 2 independent experiments. d, Growth curves of the depicted cell lines determined by Incucyte live-cell analysis after transduction with indicated sgRNAs. PLK1 knockout (positive control gene) impacted the proliferation of all cell lines indicating that the CRISPR-Cas9 system is functional in all cell lines, while INPP5A depletion only affected the growth of GNAQ/11Mut UM cell lines. n = 3 independent experiments for all cell lines, except A375, Mel285, Mel290 and OMM2.5 n = 2 and MP46 n = 1 with two technical replicates. NT, non-targeting. e, Quantitative real-time PCR (qRT–PCR) analysis for INPP5A mRNA levels of the depicted cell lines 72 h after transduction with the indicated sgRNAs. mRNA levels are shown as percentage of NT sgRNA. A representative of n = 3 biologically independent samples for all cell lines, except OMM2.5, Mel285 and Mel290 n = 4 biologically independent samples is shown. NT, non-targeting. All data are presented as mean ± s.e.m.; P values were determined by one-way analysis of variance (ANOVA) with multiple comparisons (d, e). Western blot was repeated four times with similar results. Source data
Extended Data Fig. 3
Extended Data Fig. 3. INPP5A is synthetic lethal with different GNAQ oncogenic mutations.
a,b, Quantitative real-time PCR (qRT–PCR) analysis for INPP5A mRNA levels of doxycycline-inducible-shRNA 92.1 (a) Mel202 (b) cells 72 h after doxycycline treatment shown as percentage of no doxycycline control, n = 3 biologically independent samples. Dox, doxycycline, shCtl, negative control shRNA. c,d, Clonogenic growth of doxycycline-inducible shRNA 92.1 (c) and Mel202 (d) cells 14 days following doxycycline treatment. A representative of n = 3 independent experiments is shown. Dox, doxycycline. e, Sequence alignment of a specific region of the catalytic phosphatase domain of the indicated human 5-phosphatase enzymes. The conserved aspartate residue (Asp384 in INPP5A) which is predicted to be essential for the catalytic activity of the 5-phosphatases is highlighted in bold. Missense mutations in this residue are found in INPP5F (OCRL) in Lowe Syndrome and Dent 2 Disease patients and are known to reduce the enzymatic activity of OCRL. f, Structures of a conserved region of the catalytic domains of INPP5B (PBD ID: 3MTC) and INPP5A (structural model) superimposed. The model shows the overlap between the two aspartate residues of INPP5A (Asp384) and INPP5B (Asp548) highlighted in (e). As indicated in INPP5B structure, Asp548 is directly involved in hydrolysis of the phosphate group and thus is critical for the catalytic activity of this class of phosphatase enzymes. The homologous residue in INPP5A, Asp384, is used as a phosphatase-deficient mutant in this study. g, Phosphatase activity assay performed with cell lysates of 92.1-doxycycline-inducible shRNA cells expressing the indicated INPP5A cDNAs 72 h after doxycycline treatment. Inositol 1,4,5 trisphosphate was added as a substrate, and free inorganic phosphate levels were measured and plotted as percentage of wild-type INPP5A, n = 2 biologically independent samples. h, Immunoblot showing levels of GNAQ, pERK and α-tubulin in HEK293A-Cas9 parental cells or cells expressing the indicated GNAQ cDNAs. GNAQ levels are the total of endogenous and exogenously expressed GNAQ. pERK indicates the signaling output of GNAQ activity. i, Competition-based proliferation assay in HEK293A-Cas9 cells expressing wild-type, Q209P or R183Q mutant HA-GNAQ. Cells were transduced with the depicted sgRNAs and the percentage of cells expressing sgRNAs (GFP+ or mCherry+ cells) at the indicated time points normalized to day 6 post-transduction are shown, n = 2 biologically independent samples. j, Comparison of INPP5A - GNAQ/11Mut UM synthetic lethal interaction to other known synthetic lethal pairs. Dependency score of left: INPP5A in UM, n = 7 UM and n = 932 other non-UM cell lines. Middle: WRN in microsatellite instable (MSI) cell lines, n = 51 MSI and n = 541 MSS microsatellite stable cell lines. Right: SHOC2 in NRAS Q61R mutant cell lines, n = 63 mutant cell lines and n = 878 wild-type cell lines. Width of colored regions represents density estimates. Dashed red lines represent mean dependency score. Data obtained from DepMap v2022Q1. INPP5A dependency data is a combination of data obtained from AVANA CRISPR screens and the 3 UM CRISPR-Cas9 screens performed in this study. All data are presented as mean ± s.e.m.; P values were determined by one-way analysis of variance (ANOVA) with multiple comparisons (a, b) or two-tailed, unpaired Student’s t-test (j). Western blot was repeated twice with similar results. Source data
Extended Data Fig. 4
Extended Data Fig. 4. Effect of INPP5A depletion on inositol phosphate levels in uveal and cutaneous melanoma cells.
a, Representative chromatogram showing retention times of inositol phosphates measured by ion-pair liquid chromatography-tandem mass spectrometry (IP-HPLC-MS/MS). From top to bottom, peaks represent inositol monophosphate (IP1, RT: 3.30), inositol bisphosphate (IP2, RT: 4:15), inositol trisphosphate (IP3, RT: 4:43) and inositol tetrakisphosphate (IP4, RT: 4:59). RT, retention time. b, Quantitative analysis of IP1 levels measured by mass spectrometry 72 h after INPP5A depletion depicted for each cell line individually. IP1 levels are shown as fold change relative to negative control (sgNT), n = 3 independent experiments for all cell lines except MP46, OMM2.5, Mel285, K029ax and Uacc62 n = 2. NT, non-targeting, Mut, mutant, WT, wild-type. c, Box plots of the mean values of IP1 levels of all cell lines in (b) shown as fold change to relative control (n = number of cell lines tested), n = 3 independent experiments for 8 cell lines and n = 2 independent experiments for 6 cell lines. FC, fold change, NT, non-targeting. d, Same as (b) for IP2 levels. n = 3 independent experiments for all cell lines except MP46, OMM2.5, Mel285, K029ax and Uacc62 n = 2. NT, non-targeting, Mut, mutant, WT, wild-type. e, Same as (c) for IP2 levels. n = 3 independent experiments for 8 cell lines and n = 2 independent experiments for 6 cell lines. FC, fold change, NT, non-targeting. f, Same as (b) for IP3 levels. n = 3 independent experiments for all cell lines except MP46, OMM2.5, Mel285, K029ax and Uacc62 n = 2. NT, non-targeting, Mut, mutant, WT, wild-type. Box plots showing the mean value of all cell lines are shown in Fig. 3b. g, Same as (b) for IP4 levels. n = 3 independent experiments for all cell lines except MP46, OMM2.5, Mel285, K029ax and Uacc62 n = 2. NT, non-targeting, Mut, mutant, WT, wild-type. Box plots showing the mean value of all cell lines are shown in Fig. 3c. All data are presented as mean ± s.e.m.; P values were determined by one-way analysis of variance (ANOVA) with multiple comparisons (c, e). Box plots show the 25th to 75th percentiles, center line depicts median and whiskers depict minimum and maximum values (c, e).
Extended Data Fig. 5
Extended Data Fig. 5. GNAQ/11-mutant cells produce high levels of IP3.
a, b, Quantitative analysis of IP3 (a) and IP4 (b) levels of 92.1-doxycycline-inducible shRNA cells expressing empty vector or the indicated INPP5A cDNA 72 h after doxycycline treatment. Data are presented as relative fold change to no dox, IP3, n = 3 and IP4, n = 2 independent experiments. FC, fold change. c, Schematic depiction of the metabolic flux of IP3 upon activating the Gα proteins, GNAQ and GNA11. LiCl inhibits the enzymatic activity of inositol monophosphatases (IMPases), leading to the stability of IP1, a downstream metabolite of IP3. IP1 accumulation is used as a surrogate for IP3 synthesis by activated GNAQ/11. d, Bar graph showing homologous time-resolved fluorescence (HTRF)-based IP1 accumulation in the indicated cell lines. Ratio of HTRF signal in cells treated with DMSO or GNAQ/11 inhibitor (FR900359 10 nM) for 16 h is shown. HTRF is a competitive immunoassay that measures cellular levels of IP1 which is used as a surrogate for the levels of IP3 produced as described in (c). HTRF signal is inversely proportional to the endogenous levels of IP1. GNAQ/11Mut UM cells exhibit enhanced IP3 synthesis driven by their oncogenic mutations compared to GNAQ/11WT cells. Upon inhibition of GNAQ/11 activity by FR, IP3 synthesis is reduced leading to lower accumulation of endogenous IP1 and thus increased HTRF signal, n = 4 independent experiments for DMSO and n = 2 for FR data for all cell lines except MP41 and 92.1 DMSO n = 6, Mel202 DMSO n = 3, MP46, OMM2.5, Mel285, Mel290 FR n = 4. Mut, mutant, WT, wild-type. e, Bar graph showing HTRF-based IP1 accumulation in HEK293A-Cas9 parental cells or cells expressing the indicated HA-GNAQ cDNAs. Cells were treated with DMSO or increasing concentrations of the GNAQ/11 inhibitor (FR900359) for 16 h. An increase in HTRF signal, which is indicative of reduced IP3 synthesis, was achieved at lower FR concentrations in cells expressing GNAQ-R183Q compared to GNAQ-Q209L or GNAQ-Q209P -expressing cells, suggesting that R183Q mutation results in intrinsically less active mutant GNAQ/11 proteins. DMSO, n = 2, FR, n = 3 biologically independent samples. WT, wild-type. All data are presented as mean ± s.e.m.; P values were determined by two-way analysis of variance (ANOVA) with multiple comparisons (a, e) or two-tailed, unpaired Student’s t-test (d). Source data
Extended Data Fig. 6
Extended Data Fig. 6. Tight regulation of IP3 receptors is crucial for GNAQ/11-mutant UM cells survival.
a, Table summarizing CCLE mRNA expression (TPM values) data of ITPR1, ITPR2 and ITPR3 (encoding IP3R1, IP3R2 and IP3R3 subtypes, respectively) in OMM1 and 92.1 cells. IP3-receptor subtype with the highest expression in each cell line is shown in red. b,c, Levels of inositol phosphates (IP1, IP2, IP3 and IP4) in 92.1-Cas9 (b) and OMM1-Cas9 (c) cells expressing the indicated sgRNAs. Cells transduced with sgITPR3#1 or sgITPR3#2 (92.1-Cas9) and sgITPR1#1 or sgITPR1#2 (OMM1-Cas9) were co-transduced with sgINPP5A#1 or non-targeting sgRNA and harvested 72 h later. Results are shown relative to NT control sgRNA and dashed line depicts equivalent levels to control, n = 3 independent experiments. NT, non-targeting. d, e, f, Growth of Mel202-Cas9 (d), 92.1-Cas9 (e) and Uacc62-Cas9 (f) cells determined by Incucyte live-cell analysis following the transduction with the indicated sgRNAs. ERLIN2 is depleted with two independent sgRNAs (sgERLIN2#1 and #2), sgNT and sgPLK1 are negative and positive control sgRNAs, respectively, n= 2 independent experiments. NT, non-targeting. g, h, i, Box plots showing TCGA mRNA expression data (TPM values) of ITPR1 (encoding IP3R subtype 1) (g), ITPR2 (encoding IP3R subtype 2) (h) and ITPR3 (encoding IP3R subtype 3) (i) in human UM and CM tumors. UM, uveal melanoma; CM, cutaneous melanoma. All data are presented as mean ± s.e.m.; P values were determined by two-way analysis of variance (ANOVA) with multiple comparisons (b, c), one-way ANOVA with multiple comparisons (d, e, f), or two-tailed, unpaired Student’s t-test (g, h, i). Box plots show 25th to 75th percentiles, center line depicts median, and whiskers depict minimum and maximum values (g, h, i). Source data
Extended Data Fig. 7
Extended Data Fig. 7. INPP5A depletion preferentially results in elevated cytosolic calcium levels in GNAQ/11-mutant UM cells.
a, Cumulative time course illustrating the response of fura-2 signal to changes in intracellular calcium levels. The curves depict fura-2 fluorescence signal measured at excitation wavelength of 340 nm (left y axis) and 380 nm (right y axis). Ionomycin (2 µM) was added to cell culture medium at ~40 seconds after the start of imaging to induce changes in cytosolic calcium levels. b, Cumulative time course illustrating intensities of fura-2 fluorescence ratio (F340/F380) produced by excitation at two wavelengths (340 nm and 380 nm). The increase in cytosolic calcium levels results in an increased ratio of ion-bound indicator (measured at 340 nm) over ion-free indicator (measured at 380 nm). c, d, Quantification of fura-2 fluorescence signal ratio (F340/F380) 24 h (c) and 48 h (d) after transduction with the indicated sgRNAs in the depicted cell lines. Each point represents a cell; n indicates the cell number used for quantification in each group. A representative of n = 3 for 92.1 and OMM1 and n = 2 for Mel202 and Colo741 independent experiments is shown. e, Quantification of normalized GFP signal intensity of Uacc62-Cas9 cells transduced with the indicated sgRNAs. The calcium ATPase inhibitor Thapsigargin (1.5 nM) was added before the start of imaging. Measured signal represents median per well, n = 2 independent experiments. f, Quantification of the percentage of dead cells of Uacc62-Cas9 cells transduced with the indicated sgRNAs and treated as shown in (e), n = 2 independent experiments. All data are presented as mean ± s.e.m.; P values were determined by one-way analysis of variance (ANOVA) with multiple comparisons (c, d). Source data
Extended Data Fig. 8
Extended Data Fig. 8. Cellular phenotypes induced by depleting INPP5A in UM cells.
a, Scatter plots of Log10 fold change gene expression as determined by RNA-seq upon depletion of INPP5A in 92.1 cell line using two independent shINPP5A (#1 and #2). Cells expressing doxycycline-inducible shRNA and overexpressing empty expression vector (left), phosphatase-deficient INPP5A (INPP5A-D384G) cDNA (middle) or wild-type INPP5A (INPP5A-WT) cDNA (right) were harvested 7 days following doxycycline treatment. Correlations between Log10 FC of shINPP5A #1 and shINPP5A #2 are shown for all detected genes (depicted as gray dots and correlation shown as black lines) or only for significant differentially expressed genes (DEGs; n = 84, depicted as blue dots and correlation shown as red lines). Profiles of cells transduced with shINPP5A#1 (x axis) and shINPP5A#2 (y axis) showed good correlation for the DEGs. b, c, Gene set enrichment analyses (GSEA) signature enrichment plots for E2F targets (b) and G2/M checkpoint (c) HALLMARK gene sets for the DEGs depicted in (a). NES, normalized enrichment score. d, Immunoblot showing levels of cleaved PARP (c-PARP), p53-phosphorylated serine 15 (p53-pS15) and p21 in doxycycline-inducible shRNA-expressing 92.1 cells 11 days after doxycycline treatment. α-tubulin is used as loading control. e, Stacked bar graph showing percentage of early and late apoptotic cells based on annexin V and propidium iodide staining in doxycycline-inducible shRNA-expressing 92.1 cells at 4, 8 and 11 days after doxycycline treatment. A representative of n = 3 independent experiments is shown. Dox, doxycycline. f, Bar graph showing percentage of apoptotic cells based on annexin V and propidium iodide staining in 92.1-Cas9 cells at day 11 after transduction with the indicated sgRNAs, n = 3 independent experiments. g, Quantitative real-time PCR (qRT–PCR) analysis of CDKN1A in parental cells and two independent TP53 knockout (TP53-KO1 and TP53-KO2) 92.1-Cas9 cell lines after transduction with the indicated sgRNAs, n = 3 biologically independent samples. h, FACS plots depicting the gating strategy for determining different cell cycle phases. Debris and dead cells were excluded according to the forward scatter-area (FSC-A) and side scatter-area (SSC-A) gating. Singlets were identified based on FSC-A and forward scatter-height (FSC- H) profiles. Then, they were analyzed for propidium iodide (DNA content) and 5-ethynyl-2 deoxyuridine (EdU) coupled to Alexa Fluor 647 (EdU–647) staining intensities. As EdU is incorporated during active DNA synthesis, EdU+ cells were classified as ‘S phase’. EdU cells were classified as ‘G1 phase’ or ‘G2/M phase’ based on their DNA content. i, Cell cycle analysis 7 days following shRNA induction with doxycycline in doxycycline-inducible shRNA-expressing 92.1 cells. Percentage of cells at a specific cell cycle phase from total number of live singlet cells is shown. A representative experiment of n = 2 independent experiments is shown. j, k, l, Quantitative real-time PCR (qRT–PCR) analysis of INPP5A (j), NOXA (k) and PUMA (l) in parental cells and two independent TP53 knockout (TP53-KO1 and TP53-KO2) 92.1-Cas9 cell lines after transduction with the indicated sgRNAs, n = 3 biologically independent samples. All data are presented as mean ± s.e.m.; P values were determined by two-way analysis of variance (ANOVA) with multiple comparisons (e) or one-way ANOVA with multiple comparisons (f, g, j, k, l). Western blot was repeated twice with similar results. Source data
Extended Data Fig. 9
Extended Data Fig. 9. INPP5A is required for UM tumor growth and metastasis development.
a, Quantitative real-time PCR (qRT–PCR) analysis of INPP5A mRNA levels of 92.1 xenografts tumors on day 3 and 45 post doxycycline treatment. Results are shown as percentage of no doxycycline control. shCtl, n = 3 mice, shINPP5A#1 and shINPP5A#2 day 3 and 45, n = 6 mice, except shINPP5A#2 day 45, n = 5. Ctl, control, INP, INPP5A. b, Quantification of Ki67 immunohistochemistry staining in 92.1 xenograft tumors at day 10 post-induction of the indicated shRNAs; n = 3 mice for all conditions, except shCtl + dox, n = 2 mice. Ctl, control, INP, INPP5A. c, d, Quantitative analysis of IP3 (c) and IP4 (d) levels of 92.1 xenograft tumors 72 h after treating the mice with doxycycline (25 mg/Kg q.d.) to induce the expression of the indicated shRNAs. Results are shown relative to no doxycycline control. Dashed line depicts equal levels to control, n = 7 mice for all conditions. Ctl, control, INP, INPP5A. e, Bioluminescence images of NSG mice transplanted with 92.1-luciferase-labeled cells represented at day 21 post-transplantation (top). Cells were transduced with the indicated shRNAs before injection and mice were treated with doxycycline as indicated. Ex vivo bioluminescence images of histological sections of the liver of the mice (middle). The liver signal confirms that injected cells could colonize the liver and form tumor metastases. Immunohistochemistry staining of haematoxylin and eosin (H&E) and the melanocytic marker gp100 confirm that the metastases are originating from the injected UM cells (bottom). Scale bar, 500 µm. f, Quantitative real-time PCR (qRT–PCR) analysis of INPP5A mRNA levels of liver metastases formed upon transplantation of 92.1-lucifearse-labeled cells transduced with the indicated shRNAs. Results are shown as percentage of no doxycycline, each black dot represents an individual animal, shCtl +Dox and shINPP5A -Dox, n = 7, and shINPP5A +Dox, n = 4. Data confirm that doxycycline treatment induced the knockdown of INPP5A in the liver metastases. g, Quantification of bioluminescence signal of the liver of the mice after transplantation of 92.1-luciferase-labeled cells transduced with shCtl or shINPP5A. Images were taken on days 10, 21, 31, 41, 51 and 61 post-transplantation. Data show that doxycycline treatment does not impact the bioluminescence signal and cells transduced with control or INPP5A shRNAs have similar growth rates in the liver, n = 8 mice per condition. h, i, Quantification of bioluminescence signal after transplantation of 92.1-luciferase-labeled cells transduced with shCtl or shINPP5A at day 21 (h) and day 31 (i) post-transplantation. Mice were treated with doxycycline as indicated. Data represent average flux as photons per second for the liver area. The results show that the signal was comparable between control groups (shCtl + dox at day 0 and shINPP5A -Dox) and the treatment groups (shINPP5A + Dox at day 21 or day 31) at the start of the treatment. For treatment group of day 21, shCtl + Dox, n = 8, shINPP5A - Dox, n = 12, and shINPP5A + Dox, n =12, for treatment group of day 31, shCtl + Dox, n = 8, shINPP5A - Dox, n = 11, and shINPP5A + Dox, n =12. All data are presented as mean ± s.e.m.; P values were determined by two-tailed, unpaired Student’s t-test (a, b, f), two-way analysis of variance (ANOVA) with multiple comparisons (c, d) or one-way ANOVA with multiple comparisons (h, i). Source data
Extended Data Fig. 10
Extended Data Fig. 10. Steady-state levels of inositol phosphates in UM cell lines, patient-derived xenografts, and patient tumor biopsies.
a, b, Graphs showing steady-state levels of IP4 (a) and IP3 (b) displayed as µg per million cells in HEK293A-Cas9 parental cells (gray) or cells expressing wild-type (green) or Q209L mutant (blue) HA-GNAQ cDNAs, n = 3 independent experiments. c, Box plots showing steady-state levels of IP3 displayed as µg per million cells in GNAQ/11WT cell lines (n = 8) and GNAQ/11Mut cell lines (n = 7). Each dot represents an individual cell line. d, Scatter-plot illustrating the correlation of between cell viability upon INPP5A depletion (y axis) and steady-state levels of IP3 as µg per million cells (x axis) for GNAQ/11WT cell lines (green, n = 7) and GNAQ/11Mut cell lines (blue, n = 6). e, Table summarizing relevant information for the patient-derived xenograft (PDX) samples analyzed. f, Representative images of haematoxylin and eosin (H&E) and Melan A immunohistochemistry staining of CM patients’ tumor samples (n = 8 biopsies). Percentage of tumor content and oncogenic mutation are depicted for each biopsy. Scale bars, 50 μm. g, Box plots of steady-state levels of IP3 shown as µg per gram of tumor tissue of GNAQ/11WT CM patient-derived xenografts (PDX) (n = 4) and GNAQ/11Mut or CYSLTR2Mut UM patient-derived xenografts (n = 5). h, Box plots of steady-state levels of IP3 shown as µg per gram of tumor tissue of GNAQ/11WT CM patients’ tumor samples (n = 8 biopsies) and GNAQ/11Mut UM patients’ tumor samples (n =7 biopsies). All biopsies are represented by two distinct histological sections (indicated as matching-color dots), except two biopsies per tumor type each is represented by one section. All data are presented as mean ± s.e.m.; P values were determined by one-way analysis of variance (ANOVA) with multiple comparisons (a, b), two-tailed, unpaired Student’s t-test (c, d, g, h). Two-tailed Pearson’s correlation with 95% confidence interval (d). Box plots show 25th to 75th percentiles, center line depicts median, and whiskers depict minimum and maximum values (c, g, h). Source data

References

    1. Jager MJ, et al. Uveal melanoma. Nat. Rev. Dis. Primers. 2020;20:18–20. - PubMed
    1. Carvajal RD, et al. Advances in the clinical management of uveal melanoma. Nat. Rev. Clin. Oncol. 2023;20:99–115. doi: 10.1038/s41571-022-00714-1. - DOI - PubMed
    1. Shain AH, et al. The genetic evolution of metastatic uveal melanoma. Nat. Genet. 2019;51:1123–1130. doi: 10.1038/s41588-019-0440-9. - DOI - PMC - PubMed
    1. Zuidervaart W, et al. Activation of the MAPK pathway is a common event in uveal melanomas although it rarely occurs through mutation of BRAF or RAS. Br. J. Cancer. 2005;92:2032–2038. doi: 10.1038/sj.bjc.6602598. - DOI - PMC - PubMed
    1. Van Raamsdonk CD, et al. Frequent somatic mutations of GNAQ in uveal melanoma and blue naevi. Nature. 2009;457:599–602. doi: 10.1038/nature07586. - DOI - PMC - PubMed

MeSH terms

Substances