. 2024 Jan 17;10(1):3.
doi: 10.1038/s41522-024-00476-x.

Nisin lantibiotic prevents NAFLD liver steatosis and mitochondrial oxidative stress following periodontal disease by abrogating oral, gut and liver dysbiosis

Affiliations

Nisin lantibiotic prevents NAFLD liver steatosis and mitochondrial oxidative stress following periodontal disease by abrogating oral, gut and liver dysbiosis

Ryutaro Kuraji et al. NPJ Biofilms Microbiomes. .

Abstract

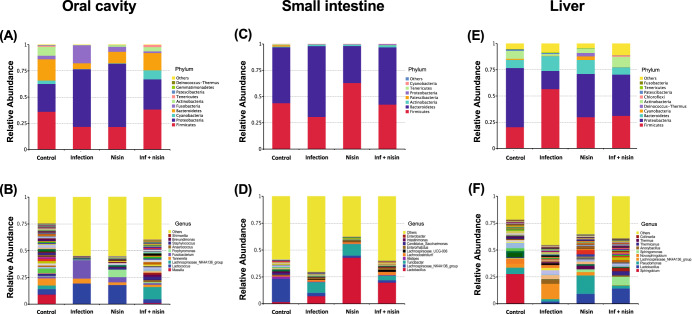
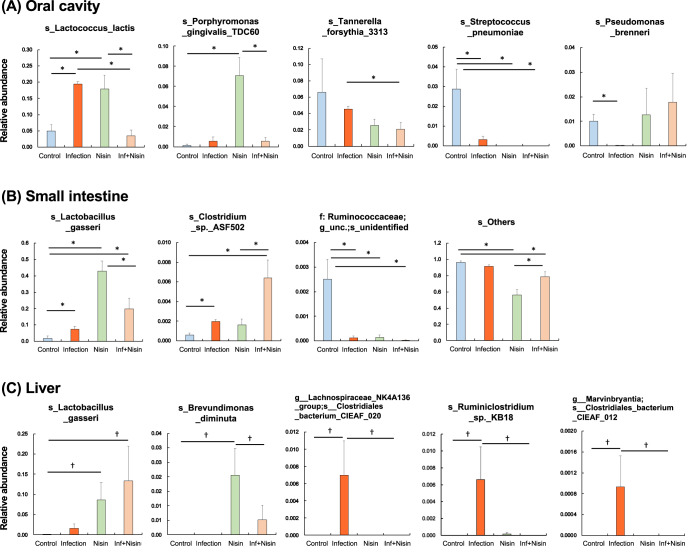
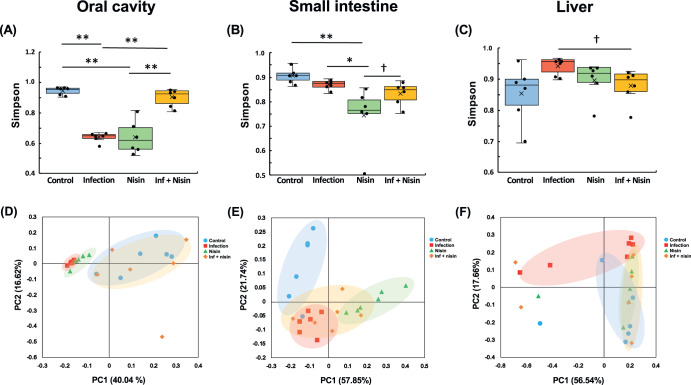
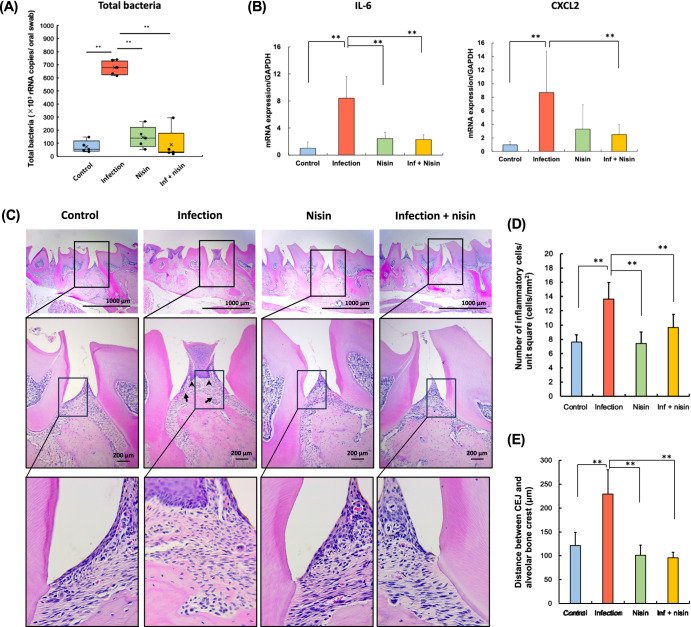
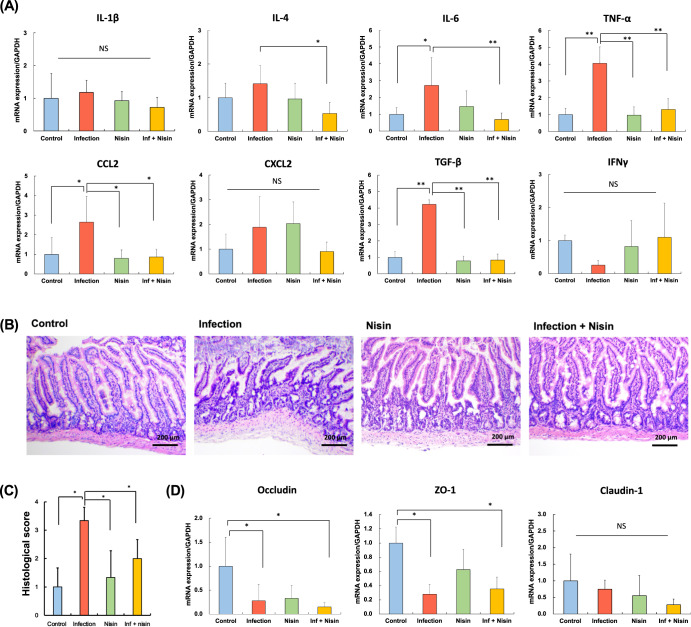
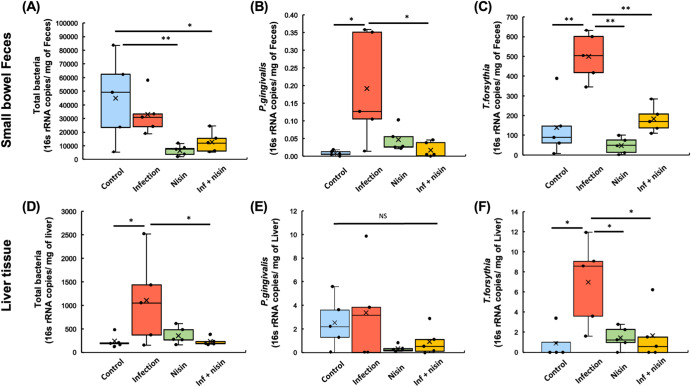
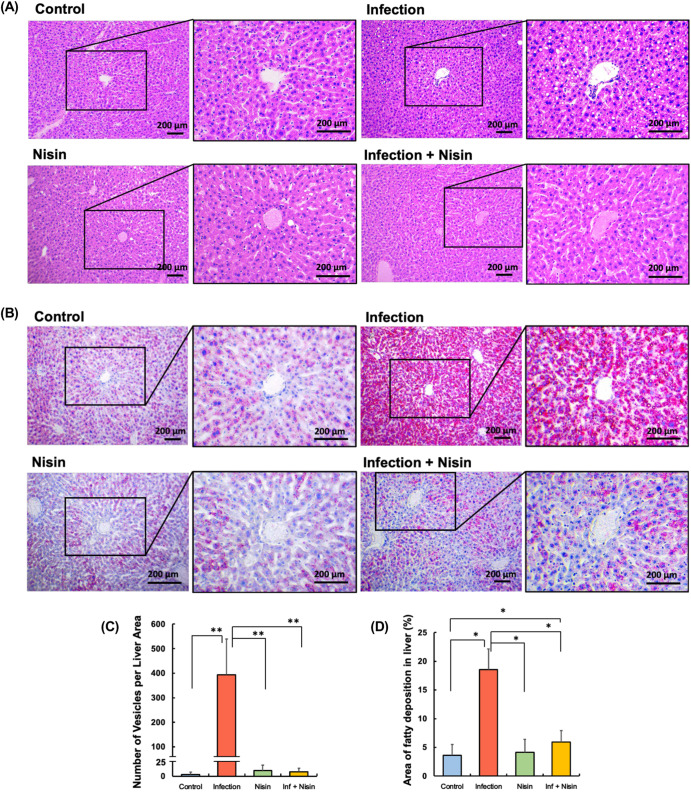
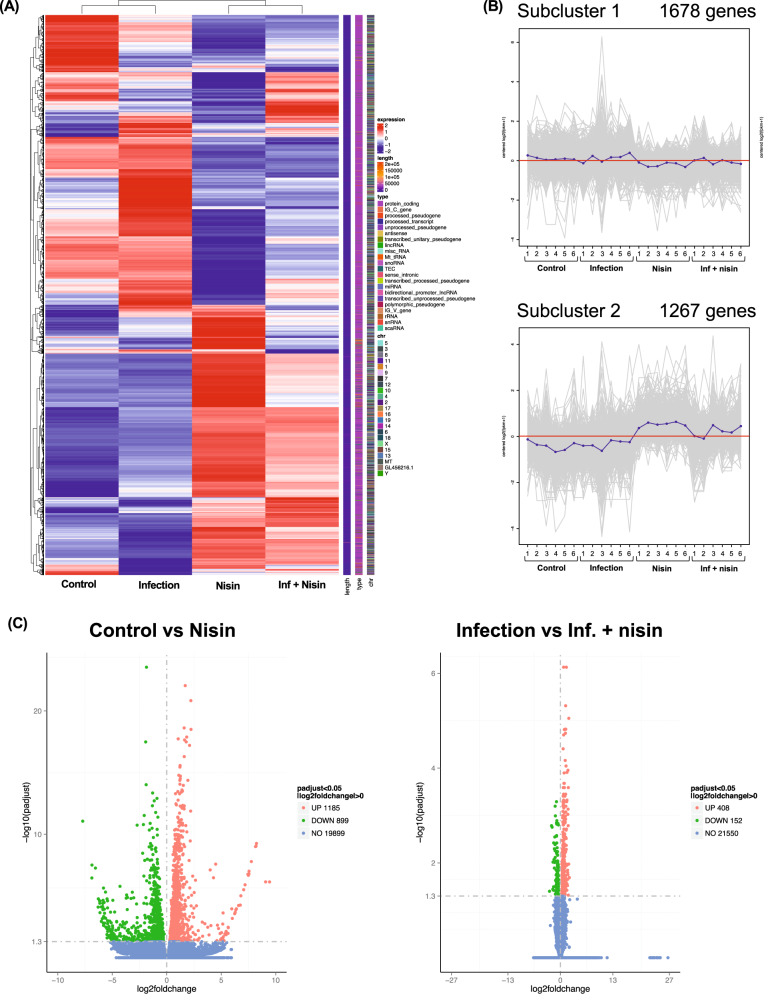
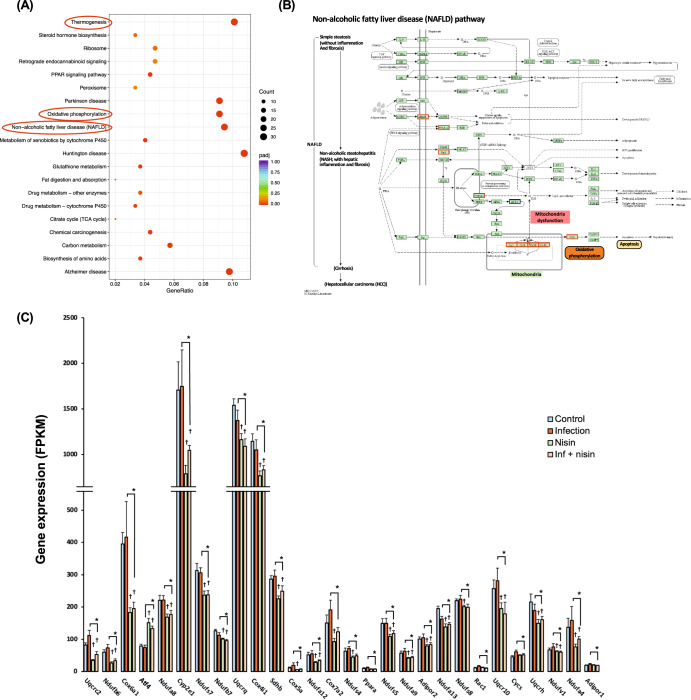
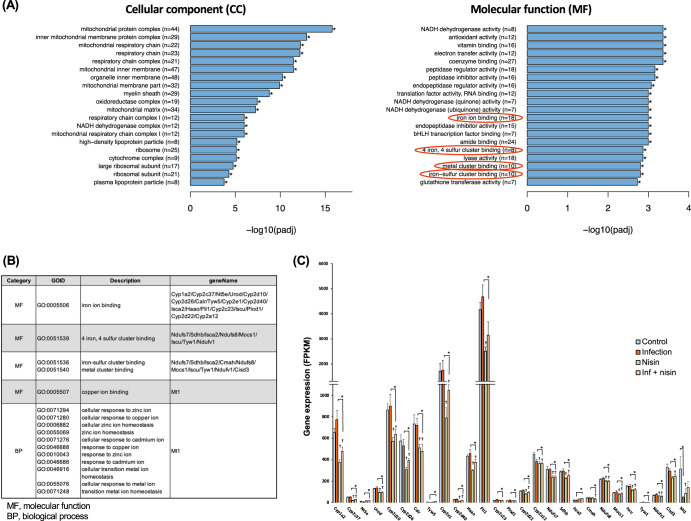
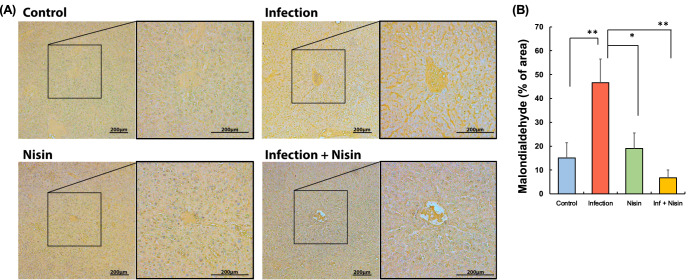
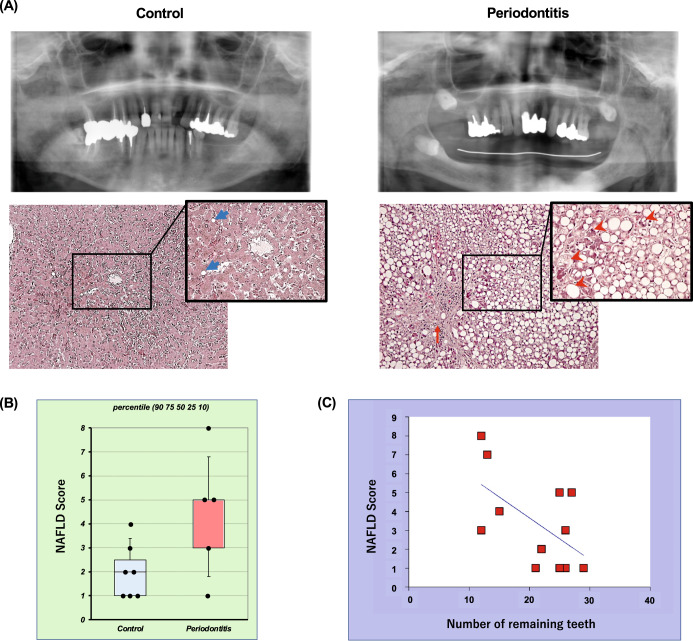
Oral microbiome dysbiosis mediates chronic periodontal disease, gut microbial dysbiosis, and mucosal barrier disfunction that leads to steatohepatitis via the enterohepatic circulation. Improving this dysbiosis towards health may improve liver disease. Treatment with antibiotics and probiotics have been used to modulate the microbial, immunological, and clinical landscape of periodontal disease with some success. The aim of the present investigation was to evaluate the potential for nisin, an antimicrobial peptide produced by Lactococcus lactis, to counteract the periodontitis-associated gut dysbiosis and to modulate the glycolipid-metabolism and inflammation in the liver. Periodontal pathogens, namely Porphyromonas gingivalis, Treponema denticola, Tannerella forsythia and Fusobacterium nucleatum, were administrated topically onto the oral cavity to establish polymicrobial periodontal disease in mice. In the context of disease, nisin treatment significantly shifted the microbiome towards a new composition, commensurate with health while preventing the harmful inflammation in the small intestine concomitant with decreased villi structural integrity, and heightened hepatic exposure to bacteria and lipid and malondialdehyde accumulation in the liver. Validation with RNA Seq analyses, confirmed the significant infection-related alteration of several genes involved in mitochondrial dysregulation, oxidative phosphorylation, and metal/iron binding and their restitution following nisin treatment. In support of these in vivo findings indicating that periodontopathogens induce gastrointestinal and liver distant organ lesions, human autopsy specimens demonstrated a correlation between tooth loss and severity of liver disease. Nisin's ability to shift the gut and liver microbiome towards a new state commensurate with health while mitigating enteritis, represents a novel approach to treating NAFLD-steatohepatitis-associated periodontal disease.


Conflict of interest statement

The authors declare no competing interests.

Figures

Fig. 1
Fig. 1. Nisin promotes a shift from a disease-associated microbiome toward a healthy state through multiple body sites.
Bar graphs show relative abundance of each bacteria taxa at the phylum level (A, C, E) and genus level (B, D, F) in oral cavity, small intestine, and liver (n = 6). The list next to the bars shows the top 10 taxa relative abundance in each taxonomic rank.
Fig. 2
Fig. 2. Nisin shifted the microbiome from a disease-associated state toward a healthy state through multiple body sites.
Bar plots show bacterial taxa that exhibited significant differences in relative abundances at the species level within the oral cavity (A), small intestine (B) and liver (C). The data in the bar graphs are shown as means ± standard deviation. *p < 0.05 between groups with Tukey test, †p < 0.05 with t test (n = 6).
Fig. 3
Fig. 3. Nisin prevents the alterations in microbial diversity and community structure induced by a polymicrobial infection in the oral cavity, small intestine, and liver.
Simpson index for analysis of alpha diversity (AC). PCoA using weighted UniFrac distance for evaluating differences in microbiome composition between groups (DF). Box-plots display the median, first quartiles (25th percentile), third quartiles (75th percentile), and minimum and maximum whiskers, with all data points plotted. *p < 0.05 and **p < 0.01 between groups with Tukey test, p < 0.05 with t test (n = 6).
Fig. 4
Fig. 4. Periodontal inflammation following polymicrobial oral infection is reduced by nisin.
A Total bacteria amount, (B) Gene expression of pro-inflammatory cytokine, and (C) Histopathological evaluation in periodontal tissue of the maxillary specimens (Scale bar: 1000 μm in the upper panel and 200 μm in the lower panel, respectively). D The number of inflammatory cells per 1.0 mm2 of connective tissue, and (E) Average calculated linear distance between the CEJ and ABC in histological image. The data in the bar graphs are shown as means ± standard deviation. Box-plots display the median, first quartiles (25th percentile), third quartiles (75th percentile), and minimum and maximum whiskers, with all data points plotted. *p < 0.05 and **p < 0.01 between groups with Tukey tests for real-time PCR analysis (n = 5) and histological analysis (n = 3), respectively.
Fig. 5
Fig. 5. Inflammation of small intestine following polymicrobial oral infection is prevented with nisin treatment.
A Gene expression of immune cytokine profiles from the ileum tissue, (B) Histopathological examination to evaluate severity of inflammation of small intestine (Scale bar: 200 μm), (C) Histological score, (D) Gene expression of tight junction proteins associated with gut barrier function. The data in the bar graphs are shown as means ± standard deviation. *p < 0.05 and **p < 0.01 between groups with Tukey test for real-time PCR analysis (n = 5) and Steel-Dwass test for histological analysis (n = 3), respectively.
Fig. 6
Fig. 6. Nisin treatment attenuates the burden of total bacterial and periodontal pathogens into the small intestine and liver.
In order to further assess the bacterial load on gut-liver-axis, the number of total bacteria and periodontal pathogens was measured in the small bowel feces (AC) and liver samples (DF) using RT-PCR in the manner of absolute quantification. Box-plots display the median, first quartiles (25th percentile), third quartiles (75th percentile), and minimum and maximum whiskers, with all data points plotted. *p < 0.05 and **p < 0.01 between groups with Tukey test (n = 5).
Fig. 7
Fig. 7. Hepatic lipid deposition by polymicrobial infection is significantly abrogated in mice treated with nisin.
Histopathological analysis of liver tissue was conducted to evaluate the ability of nisin to modulate the diseased changes in lipid deposition and inflammatory reaction in the histological images stained by hematoxylin (A) and Oil red (B) (Scale bar: 200 μm). Four different fields (×100 magnification) were randomly selected on the images of three tissue sections per mouse specimen (n = 3 per group), and number of vesicles (C) and area of orange-stained fatty deposition (D) was measured using ImageJ analysis software. The data in the bar graphs are shown as means ± standard deviation. *p < 0.05 between groups and **p < 0.01 between groups with Dunn’s test or Tukey test.
Fig. 8
Fig. 8. Gene profile in liver tissue analyzed by RNA sequencing.
A RNA-seq detected 2,949 genes were categorized by hierarchical clustering approach (n = 6). B Subcluster analysis were further performed to determine the trends in gene expressions among groups. C Volcano plot revealed 2,084 DEGs (1185 up-regulated and 899 down-regulated) between the control group and the nisin group (left panel) and 560 DEGs (408 up-regulated and 152 down-regulated) between the infection group and the inf. + nisin group (right panel).
Fig. 9
Fig. 9. Functional analysis expressed genes in liver tissue for KEGG pathways.
A Scatter Plot shows for top 20 significantly enriched KEGG terms, which were determined between the infection group and the inf. + nisin group by ClusterProfiler (version 3.8.1). B The enriched pathway of Non-alcoholic fatty liver disease (NAFLD, term 04932) in KEGG database. C The bar graph revealed differential genes among four groups for the NAFLD-related pathway (* adjusted p-value by FDR < 0.05 with pairwise t test, n = 6). The data are shown as means ± standard deviation.
Fig. 10
Fig. 10. Functional analysis expressed genes in liver tissue for GO pathways.
A Bar plot shows for top 20 significantly enriched GO terms at molecular function category, which were determined between the infection group and the inf. + nisin group by ClusterProfiler (version 3.8.1). B Related genes of iron binding and metal cluster binding in GO database. C The bar graph reveals differential genes among four groups for the iron binding-, metal cluster binding-, and cellular response to metal ion- related genes (*: adjusted i-value by FDR < 0.05 with pairwise t test, n = 6). The data are shown as means ± standard deviation.
Fig. 11
Fig. 11. Hepatic malondialdehyde (MDA) deposition following the polymicrobial infection is significantly reduced in mice treated with nisin.
MDA in liver tissue was quantified to evaluate the ability of nisin to modulate lipid peroxidation due to oxidative stress in the histological sections stained by immunohistochemistry (A) (Scale bar: 200 μm). Four different fields (100× magnification) were randomly selected on the images of three tissue sections per mouse specimen (n = 3 per group), and area of brown-stained MDA deposition (B) was measured using ImageJ analysis software. The data in the bar graphs are shown as means ± standard deviation. *p < 0.05 between groups and **p < 0.01 between groups with Dunn’s test.
Fig. 12
Fig. 12. The number of remaining teeth correlated with the severity of liver disease at human autopsy study.
The control and periodontitis groups were defined based on the severity and extent of periodontal disease assessed on panoramic radiographs and cone-beam CT images, respectively. Panel (A) shows representative findings of oral (upper panel) and liver (lower panel) in each group. Blue arrows indicate small fat droplets, red arrows indicate scarring fibrosis, and arrowheads indicate ballooning hepatocytes with cell injury, respectively. The NAFLD activity score (NAS) measured from histological findings (B) was compared between the control group (n = 7) and the periodontitis group using an unpaired t test (n = 5). Box-plots display the 90, 75th, 50th 25th, 10 percentile, respectively, with all data points plotted. The correlation coefficient between the NAS and the number of remaining teeth (C) was analyzed using the Pearson correlation coefficient (n = 12).

Similar articles

Cited by

References

    1. Williams RC. Periodontal disease. N. Engl. J. Med. 1990;322:373–382. doi: 10.1056/NEJM199002083220606. - DOI - PubMed
    1. Lamont RJ, Koo H, Hajishengallis G. The oral microbiota: dynamic communities and host interactions. Nat. Rev. Microbiol. 2018;16:745–759. doi: 10.1038/s41579-018-0089-x. - DOI - PMC - PubMed
    1. Page RC. The pathobiology of periodontal diseases may affect systemic diseases: inversion of a paradigm. Ann. Periodontol. 1998;3:108–120. doi: 10.1902/annals.1998.3.1.108. - DOI - PubMed
    1. Muller-Glauser W, Schroeder HE. The pocket epithelium: a light- and electronmicroscopic study. J. Periodontol. 1982;53:133–144. doi: 10.1902/jop.1982.53.3.133. - DOI - PubMed
    1. Hujoel PP, White BA, Garcia RI, Listgarten MA. The dentogingival epithelial surface area revisited. J. Periodontal Res. 2001;36:48–55. doi: 10.1034/j.1600-0765.2001.00011.x. - DOI - PubMed