

Tumor-associated neutrophils suppress CD8+ T cell immunity in urothelial bladder carcinoma through the COX-2/PGE2/IDO1 Axis
- PMID: 38233491
- PMCID: PMC10912642
- DOI: 10.1038/s41416-023-02552-z
Tumor-associated neutrophils suppress CD8+ T cell immunity in urothelial bladder carcinoma through the COX-2/PGE2/IDO1 Axis
Abstract
Background: Many urothelial bladder carcinoma (UBC) patients don't respond to immune checkpoint blockade (ICB) therapy, possibly due to tumor-associated neutrophils (TANs) suppressing lymphocyte immune response.
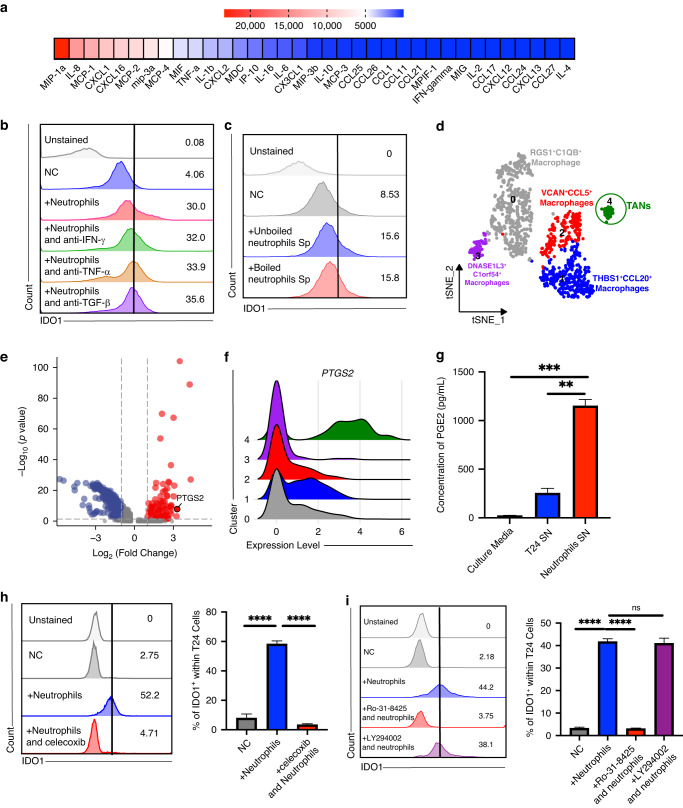
Methods: We conducted a meta-analysis on the predictive value of neutrophil-lymphocyte ratio (NLR) in ICB response and investigated TANs' role in UBC. We used RNA-sequencing, HALO spatial analysis, single-cell RNA-sequencing, and flow cytometry to study the impacts of TANs and prostaglandin E2 (PGE2) on IDO1 expression. Animal experiments evaluated celecoxib's efficacy in targeting PGE2 synthesis.
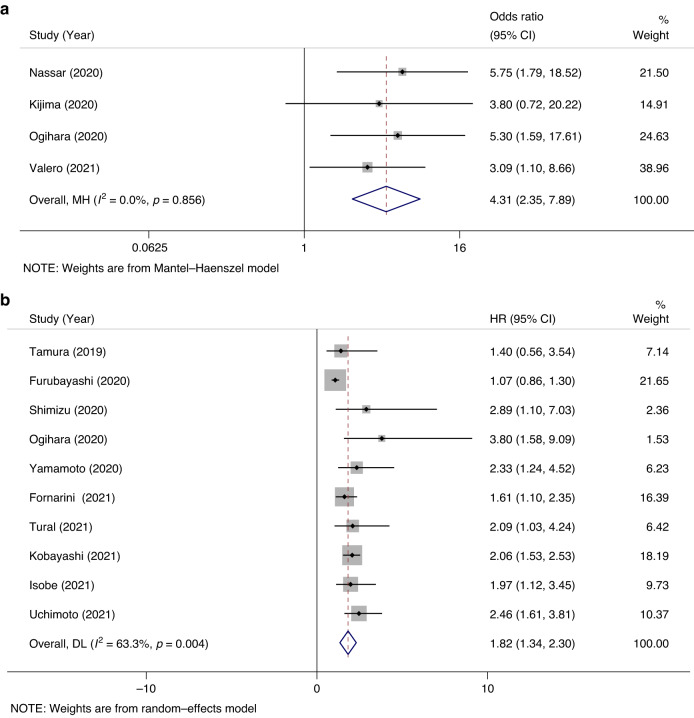
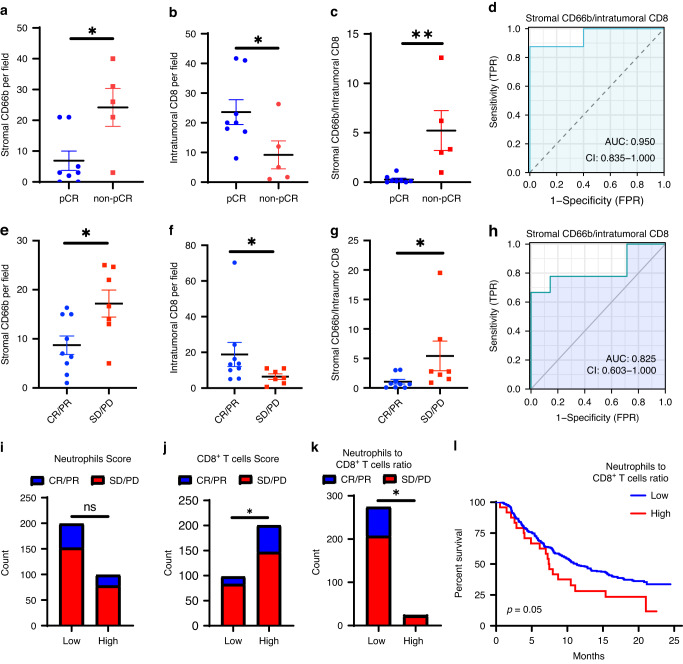
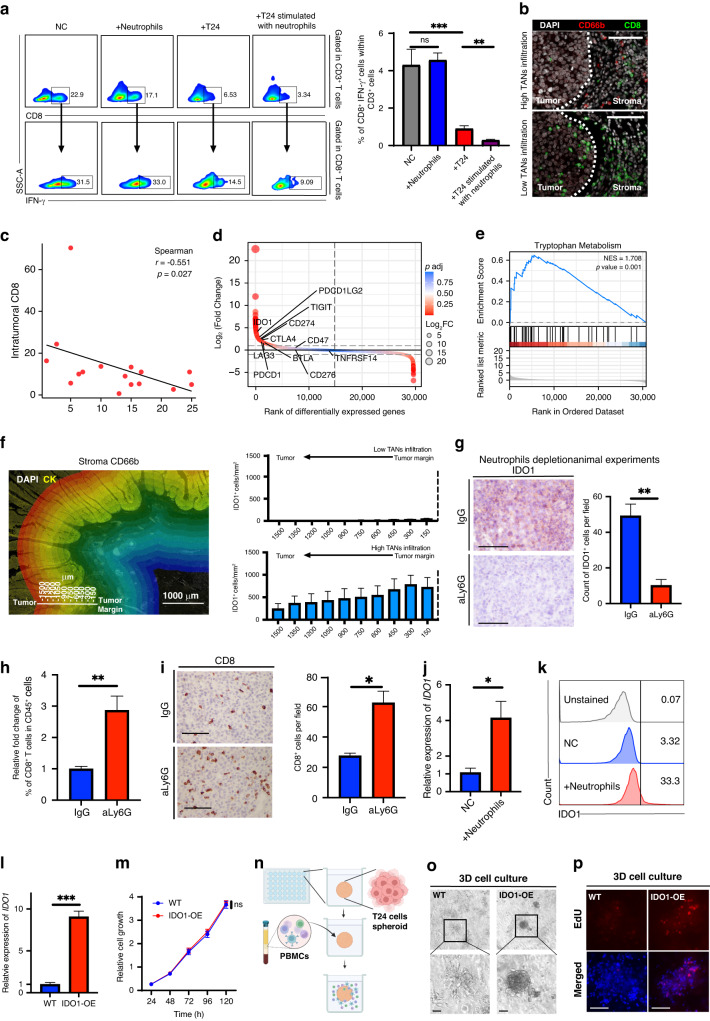
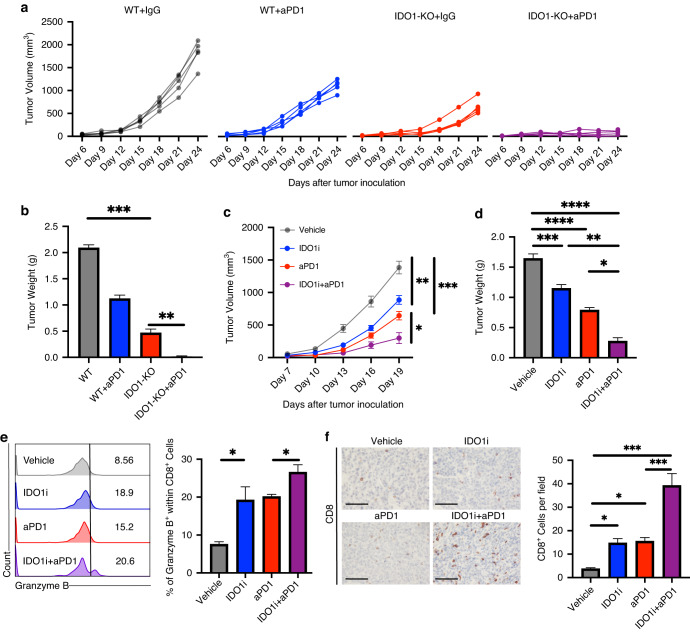
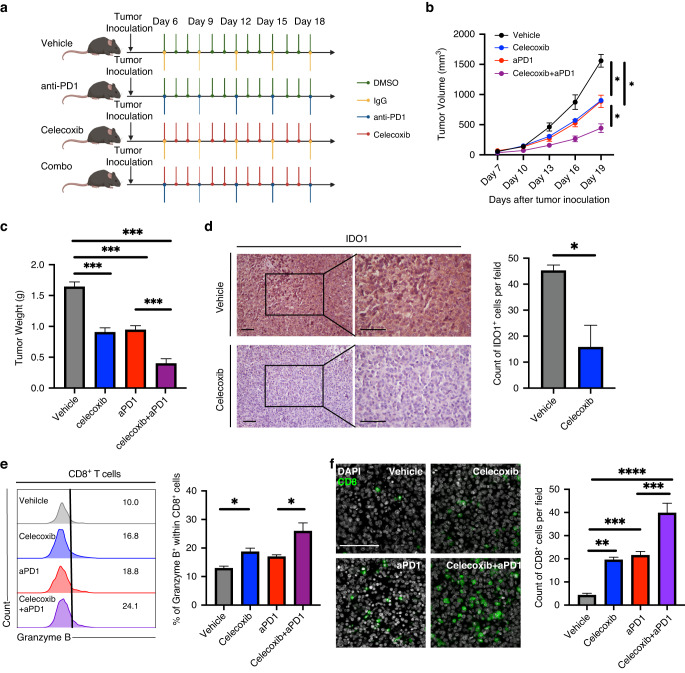
Results: Our analysis showed that higher TAN infiltration predicted worse outcomes in UBC patients receiving ICB therapy. Our research revealed that TANs promote IDO1 expression in cancer cells, resulting in immunosuppression. We also found that PGE2 synthesized by COX-2 in neutrophils played a key role in upregulating IDO1 in cancer cells. Animal experiments showed that targeting PGE2 synthesis in neutrophils with celecoxib enhanced the efficacy of ICB treatment.
Conclusions: TAN-secreted PGE2 upregulates IDO1, dampening T cell function in UBC. Celecoxib targeting of PGE2 synthesis represents a promising approach to enhance ICB efficacy in UBC.
© 2024. The Author(s), under exclusive licence to Springer Nature Limited.
Conflict of interest statement
The authors declare no competing interests.
Figures
Similar articles
-
Tumor-Associated Neutrophils Recruit Macrophages and T-Regulatory Cells to Promote Progression of Hepatocellular Carcinoma and Resistance to Sorafenib.Gastroenterology. 2016 Jun;150(7):1646-1658.e17. doi: 10.1053/j.gastro.2016.02.040. Epub 2016 Feb 26. Gastroenterology. 2016. PMID: 26924089
-
Immunosuppressive JAG2+ tumor-associated neutrophils hamper PD-1 blockade response in ovarian cancer by mediating the differentiation of effector regulatory T cells.Cancer Commun (Lond). 2025 Jul;45(7):747-773. doi: 10.1002/cac2.70021. Epub 2025 Mar 22. Cancer Commun (Lond). 2025. PMID: 40120139 Free PMC article.
-
Inflammatory biomarkers and bladder cancer prognosis: a systematic review.Eur Urol. 2014 Dec;66(6):1078-91. doi: 10.1016/j.eururo.2014.07.033. Epub 2014 Aug 20. Eur Urol. 2014. PMID: 25151017
-
A robust gene prognostic index composed of GZMB, IRF1, and TP63 can stratify the risk of two metastatic urothelial carcinoma cohorts based on immune checkpoint blockade therapy.J Cancer Res Clin Oncol. 2023 Sep;149(12):9877-9890. doi: 10.1007/s00432-023-04902-z. Epub 2023 May 29. J Cancer Res Clin Oncol. 2023. PMID: 37247083 Free PMC article.
-
Immunotherapy for advanced or metastatic urothelial carcinoma.Cochrane Database Syst Rev. 2023 Oct 9;10(10):CD013774. doi: 10.1002/14651858.CD013774.pub2. Cochrane Database Syst Rev. 2023. PMID: 37811690 Free PMC article.
Cited by
-
Tumor immune dysfunction and exclusion subtypes in bladder cancer and pan-cancer: a novel molecular subtyping strategy and immunotherapeutic prediction model.J Transl Med. 2024 Apr 17;22(1):365. doi: 10.1186/s12967-024-05186-8. J Transl Med. 2024. PMID: 38632658 Free PMC article.
-
Heightened IDO1 levels predict Bacillus Calmette-Guèrin failure in high-risk non-muscle-invasive bladder cancer patients.Cell Death Discov. 2025 Apr 26;11(1):203. doi: 10.1038/s41420-025-02489-7. Cell Death Discov. 2025. PMID: 40287406 Free PMC article.
-
Fusobacterium nucleatum: a novel regulator of antitumor immune checkpoint blockade therapy in colorectal cancer.Am J Cancer Res. 2024 Aug 25;14(8):3962-3975. doi: 10.62347/MYZA2640. eCollection 2024. Am J Cancer Res. 2024. PMID: 39267665 Free PMC article. Review.
-
Metabolic reprogramming of tumor-associated neutrophils in tumor treatment and therapeutic resistance.Front Cell Dev Biol. 2025 Apr 24;13:1584987. doi: 10.3389/fcell.2025.1584987. eCollection 2025. Front Cell Dev Biol. 2025. PMID: 40342932 Free PMC article. Review.
-
Immunoregulatory mechanisms of the arachidonic acid pathway in cancer.FEBS Lett. 2025 Apr;599(7):927-951. doi: 10.1002/1873-3468.70013. Epub 2025 Feb 20. FEBS Lett. 2025. PMID: 39973474 Free PMC article. Review.
References
-
- Bray F, Ferlay J, Soerjomataram I, Siegel RL, Torre LA, Jemal A. Global cancer statistics 2018: GLOBOCAN estimates of incidence and mortality worldwide for 36 cancers in 185 countries. CA Cancer J Clin. 2018;68:394–424. - PubMed
-
- Powles T, Morrison L. Biomarker challenges for immune checkpoint inhibitors in urothelial carcinoma. Nat Rev Urol. 2018;15:585–7. - PubMed
-
- Sharma P, Retz M, Siefker-Radtke A, Baron A, Necchi A, Bedke J, et al. Nivolumab in metastatic urothelial carcinoma after platinum therapy (CheckMate 275): a multicentre, single-arm, phase 2 trial. Lancet Oncol. 2017;18:312–22. - PubMed
-
- Rosenberg JE, Hoffman-Censits J, Powles T, van der Heijden MS, Balar AV, Necchi A, et al. Atezolizumab in patients with locally advanced and metastatic urothelial carcinoma who have progressed following treatment with platinum-based chemotherapy: a single-arm, multicentre, phase 2 trial. Lancet. 2016;387:1909–20. - PMC - PubMed
Publication types
MeSH terms
Substances
Grants and funding
LinkOut - more resources
Full Text Sources
Medical
Research Materials
