. 2024 Jan 17;7(1):14.
doi: 10.1038/s42004-024-01100-x.

From structural polymorphism to structural metamorphosis of the coat protein of flexuous filamentous potato virus Y

Affiliations

From structural polymorphism to structural metamorphosis of the coat protein of flexuous filamentous potato virus Y

Luka Kavčič et al. Commun Chem. .

Abstract

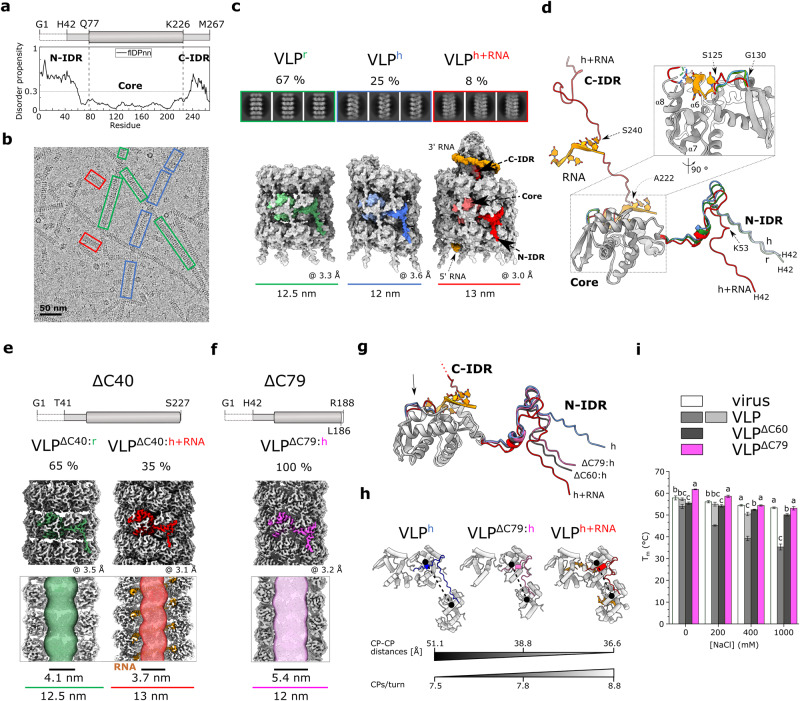
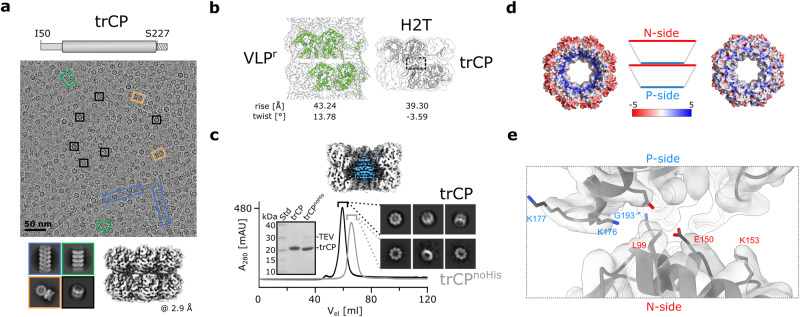
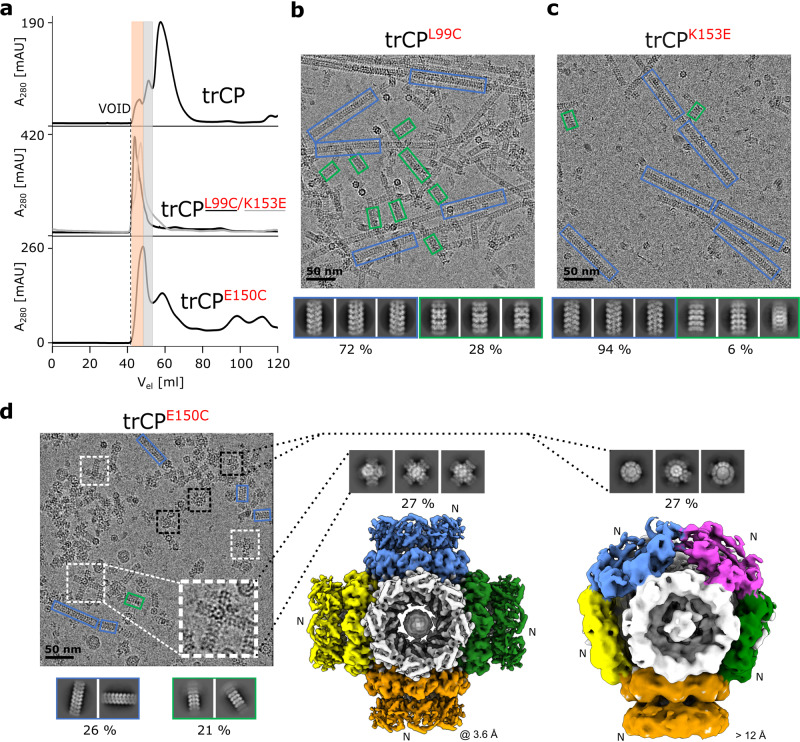
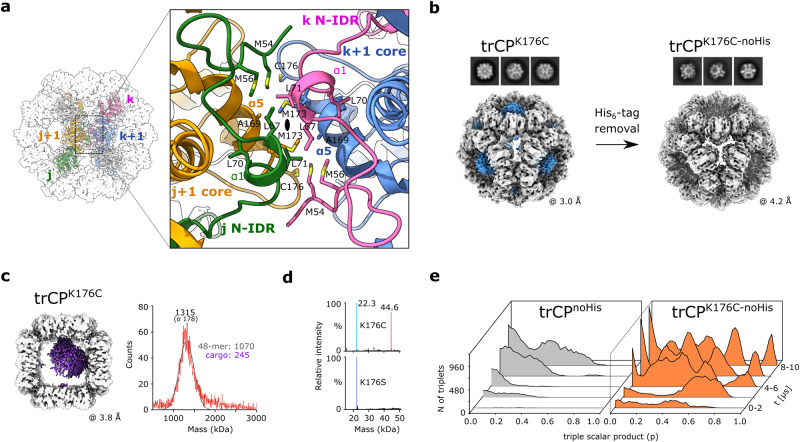
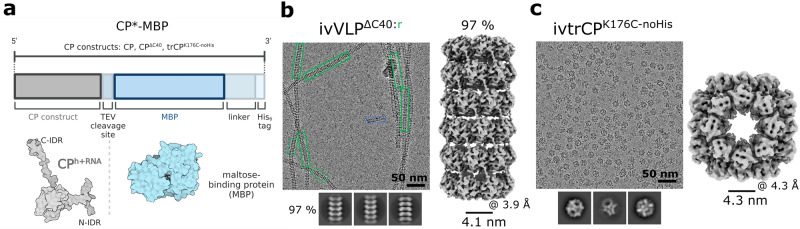
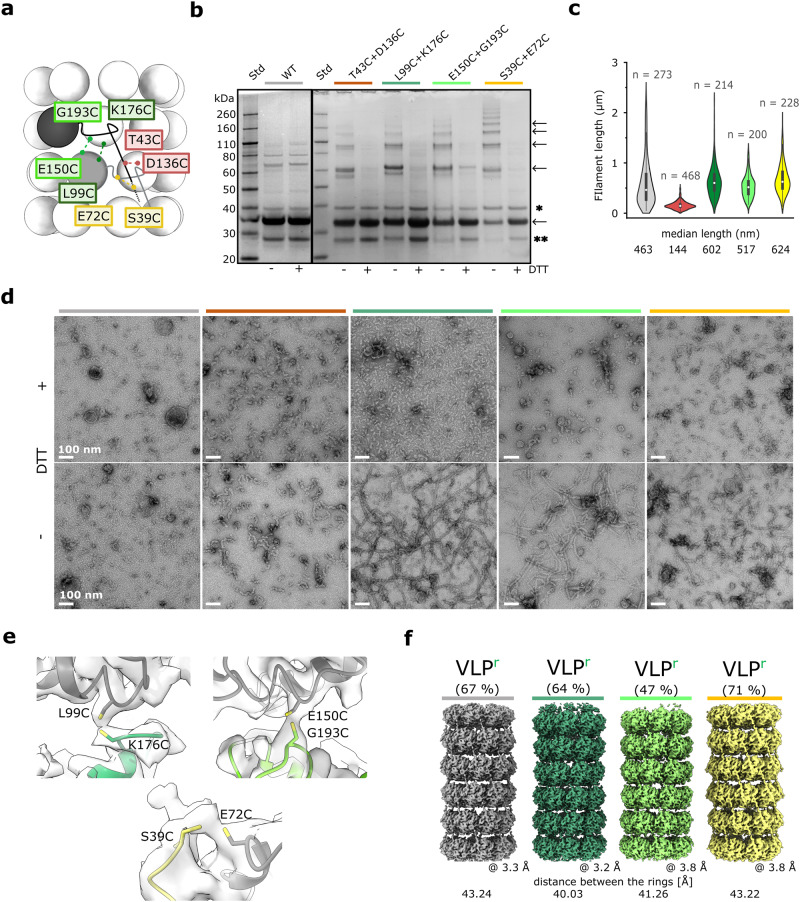
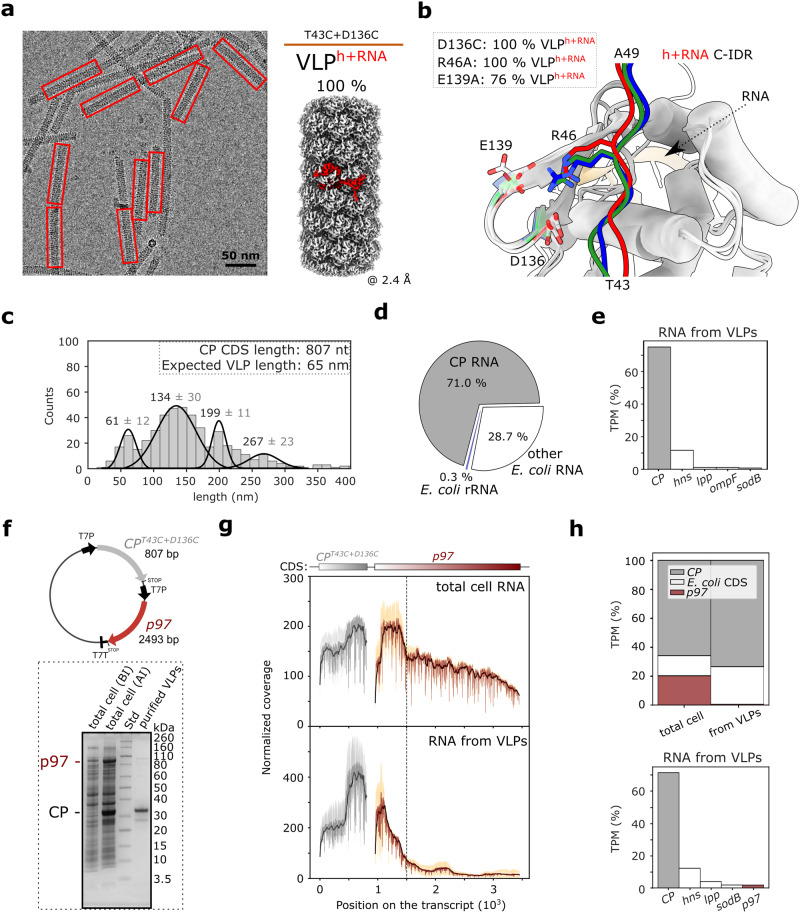
The structural diversity and tunability of the capsid proteins (CPs) of various icosahedral and rod-shaped viruses have been well studied and exploited in the development of smart hybrid nanoparticles. However, the potential of CPs of the wide-spread flexuous filamentous plant viruses remains to be explored. Here, we show that we can control the shape, size, RNA encapsidation ability, symmetry, stability and surface functionalization of nanoparticles through structure-based design of CP from potato virus Y (PVY). We provide high-resolution insight into CP-based self-assemblies, ranging from large polymorphic or monomorphic filaments to smaller annular, cubic or spherical particles. Furthermore, we show that we can prevent CP self-assembly in bacteria by fusion with a cleavable protein, enabling controlled nanoparticle formation in vitro. Understanding the remarkable structural diversity of PVY CP not only provides possibilities for the production of biodegradable nanoparticles, but may also advance future studies of CP's polymorphism in a biological context.


Conflict of interest statement

The authors declare no competing interests.

Figures

Fig. 1
Fig. 1. Structural polymorphism of recombinant PVY CP.
a Top: schematic representation of CP, the marked residues delineate N-IDR, Core and C-IDR. Residues G1-T41 are not resolved in the cryo-EM maps. Bottom: flDPnn prediction of structural disorder in CP (threshold = 0.3). b Cryo-EM micrograph of wild type VLPs. Architecturally distinct filament types are marked: red: VLPh+RNA, blue: VLPh-RNA, green: VLPr. c Cryo-EM 2D class averages and 3D reconstructions of the three VLP types. A CP subunit within each VLP is colored, color code as in b. Orange: RNA. The percentage of each particle type is indicated above the 2D classes. The overall resolution (in Å) and diameter (in nm) of the filaments are indicated. d Superposition of CP subunits of the three VLP forms. IDRs, the S125-G130 RNA-binding loop, and RNA (sticks) are colored as in b. For RMSD values, see Supplementary Fig. 2c. Top: schematic representation of CPΔC40 (e) and CPΔC79 (f). Middle: cryo-EM 3D reconstructions of the corresponding VLPs with subunits highlighted in red (VLPΔC40:h+RNA) or green (VLPΔC40:r) (e) and pink (VLPΔC79:h) (f). Bottom: cross-section of filaments with corresponding filament widths and inner channel diameters (MOLE 2.5). g Superposition of atomic models of different CPs showing the N-IDRs of CPΔC60:h (black), CPΔC79:h (pink), CPh (blue) and CPh+RNA (red). As the focus is on different N-IDR conformations, the CPh+RNA C-IDR is not fully shown; its direction is indicated by a dotted line. The black arrow marks the RNA-binding loop. For RMSD values, see Supplementary Fig. 4c. h Packing of CP subunits connected by N-IDR in VLPh (blue), VLPΔC79:h (pink), and VLPh+RNA (red). CP-CP distances between N113-Cα atoms of the subunits in adjacent helical turns are shown and the number of CP units per helix turn. i Thermal stability. Melting temperatures (Tm) are shown as mean ± SD (N = 6) for VLPΔC60 (dark gray), VLPΔC79 (pink), VLP (gray/light gray), and PVY virus (white) at different NaCl concentrations at pH 7.0. Statistical significance was determined by one-way ANOVA with Tukey’s multiple comparison test (p = 0.001). Markers (ac) indicate a statistically significant difference. The source data for panels a and i are provided in the Supplementary Data file.
Fig. 2
Fig. 2. CP with truncated IDRs preferentially forms (double) octameric rings.
a Top: schematic representation of the trCP construct. The dashed box beyond S227 marks the presence of the additional linker with the TEV protease cleavage site and the His6-tag. Middle: representative cryo-EM micrograph of the trCP sample. Black rectangles: H2T-double rings; blue rectangles: RNA-free helical filaments; green rectangles: RNA-free stacked-ring filaments; orange rectangles: orthogonal stacking of two H2T double rings. Bottom: left: corresponding 2D class averages. Right: 3D reconstruction of the H2T-double rings, the overall resolution is indicated below in Å. b Organization of CP units in the wild type VLPr (left) and trCP H2T-double ring (right), with helical parameters shown below. The dashed rectangle highlights the contact between two rings in H2T. c Top: cross-section of the 3D reconstruction of the trCP H2T double ring with the central untraceable density in blue. Bottom: comparison of SEC (HiLoad Superdex 200 16/600) profiles of trCP before (black) and after removal of the His6-tag (gray, trCPnoHis) with the corresponding cryo-EM 2D class averages and SDS-PAGE gel. The source data for this panel are provided as Supplementary Data file. d Electrostatic surface of trCP H2T double ring with predominant negative (N-side, left) or positive (P-side, right) charge (APBS, −/+ 5 kB T ec−1). e Model of the trCP H2T double ring in the cryo-EM density map showing the non-conserved charged residues (sticks) facing the interface as marked by the dashed gray rectangle in (b).
Fig. 3
Fig. 3. N-side mutations resume formation of filaments and lead to novel architectures of filament junctions.
a Comparison of SEC analysis (HiLoad Superdex 200 16/600) between the trCP sample and its N-side mutants trCPL99C, trCPK153E, and trCPE150C. The orange and gray shading indicate distinct fractions eluting earlier than H2T double rings formed by the trCP, thereby indicating formation of larger particles. The micrographs in bd show samples before SEC analysis. b, c Cryo-EM micrograph and 2D class averages of trCPL99C (a) or trCPK153E (b) filaments. Blue rectangles: helical RNA-free filaments; green rectangles: RNA-free stacked-ring filaments. Percentage of each type of filamentous particle is indicated. d Left: Cryo-EM micrograph of trCPE150C sample with 2D class averages of filaments below. White and black dashed rectangles: filament junctions growing form the central cubes or spheres, respectively; blue rectangles: RNA-free helical filaments; green rectangles: RNA-free stacked-ring filaments. Middle and right: 2D class averages and 3D reconstructions of trCPE150C filament junctions growing from the central cubic (cross-shaped junctions, middle) or spherical (spherical junctions, right) arrangement of octameric rings, respectively, with corresponding overall resolutions in Å. “N” denotes the N-side of the rings.
Fig. 4
Fig. 4. P-side mutations lead to novel octameric-ring assemblies, such as H2H double rings, cubes and spheres.
a Comparison of SEC (Superdex200 10/300 GL) analysis of trCP and its P-side mutants trCPK176E, trCPG193C, trCPG193D, trCPK176C, trCPK176S and trCPK177E. Gray and blue shading indicate SEC fractions that elute similarly to the H2T rings and at an earlier time point, respectively. b 2D class averages and c 3D reconstructions (colored by rings) are shown from top to bottom for trCP, trCPK176E, trCPK176C and trCPK177E with their overall resolutions (Å) and particle diameter (nm) indicated below each reconstruction. “N” and “P” denote the N- and P-sides of the rings. For clarity, only the 3D reconstruction of the spherical trCPK177E assembly is shown, 3D reconstruction for cubes can be found on Supplementary Fig. 13.
Fig. 5
Fig. 5. The orthogonal assembly of octameric rings into cubes is driven by electrostatics and stabilized by hydrophobic interactions.
a Left: cubic assembly of trCPK176C along the C2 symmetry axis (black oval). Four distinctly colored trCPK176C subunits from adjacent rings are shown in colored ribbons (j, j+1 in one ring; k, k+1 in the adjacent ring). Gray surface: cryo-EM density. Right: magnification of the contact between two rings formed. Hydrophobic residues are shown in sticks. b Cryo-EM 2D class averages and 3D reconstructions of trCPK176C cubes before (left) and after (right) His6-tag removal, with the density map corresponding to His6-tag clustering in trCPK176C cubes shown in blue. c Left: asymmetric cryo-EM reconstruction of trCPK176C cube with additional central density in purple. The density maps of the front and back rings have been removed for clarity. Right: mass photometry spectra of the entire trCPK176C assembly show a peak centered around 1.3 MDa – consistent with additional cargo of about 245 kDa. d Deconvolution of denaturing mass spectrometry data for trCPK176C and trCPK176S reveals monomer masses of 22.3 kDa. Mutation of cysteine to serine eliminates the population of dimers. e Time evolution of clustering of triples of interacting rings for trCPK176C-noHis and trCPnoHis during MD simulation as a function of shape denoted by a triple scalar product p of ring orientations. Orthogonal packing corresponds to p = 1, while planar packing corresponds to p = 0. The source data are provided in the Supplementary Data file.
Fig. 6
Fig. 6. In vitro triggered self-assembly of engineered nanoparticles.
a Schematic representation of fusion protein with MBP (CP*-MBP) with surface representation of both fusion components below (MBP PDB ID: 3HPI). ‘*’ marks different CP constructs. Created with BioRender (Biorender.com). Micrographs, 2D class averages and 3D reconstructions of in vitro assembled hollow nanotubes with predominant stacked-ring architecture in ivVLPΔ40:r (b) or cubic particles of ivtrCPK176C-noHis (c). The overall resolution of the 3D reconstructions (Å) and inner particle diameters (nm) are given below. The blue rectangle in b marks the presence of small population (~3%) of particles, whose helical parameters resemble the RNA-free helical form.
Fig. 7
Fig. 7. Stabilization of VLPs by introducing disulfide bonds between CP units in filaments.
a Schematic representation of VLPs (stacked-ring architecture). Positions of amino acid residues mutated to Cys are indicated in colored rectangles. Pairs of residues simultaneously mutated to Cys and possibly forming disulfide bonds are color-coded. b SDS PAGE gels of double Cys mutants (colored as in a) under reducing (+DTT) or oxidizing (−DTT) conditions. The bands corresponding to the mutant CP (monomer, oligomers) are indicated with arrows. ‘*’ and ‘**’ indicate impurities. c Violin plot showing the length distribution of the filaments, with the corresponding median lengths shown below. ‘n’: the number of measured filaments. Wild type VLP (gray), VLPT43C+D136C (red), VLPL99C+K176C (dark green), VLPE150C+G193C (light green), VLPS39C+E72C (yellow). d Negative staining TEM (nsTEM) micrographs of wild type and double Cys-mutated VLPs (color codes as in a) after 10’ incubation at 60 °C under oxidizing (−DTT) and reducing (+DTT) conditions. The scale in the nsTEM micrographs represents a spacing of 100 nm. e Cryo-EM density at positions expected for disulfide bonds, observed in asymmetric cryo-EM density maps of VLPL99C+K176C, VLPE150C+G193C, and VLPS39C+E72C stacked ring filaments (color codes as in a) with a corresponding mutant model of CPr fitted into the density. f Comparison of cryo-EM reconstructions of stacked-ring filaments (VLPr) of wild type VLP (gray), VLPL99C+K176C (dark green), VLPE150C+G193C (light green), and VLPS39C+E72C (yellow). The overall resolution and the distances between adjacent rings are shown. The source data for panels b and c are provided as Supplementary Data file.
Fig. 8
Fig. 8. Analysis of ssRNA packaged in VLPs formed by CPT43C+D136C.
a Left: cryo-EM micrograph of VLPT43C+D136C. Only VLPs encapsidating ssRNA were detected (red rectangles). Right: 3D reconstruction of VLPT43C+D136C showing a CP subunit in red. b Superposition of CPn core regions of VLPr, VLPh, and VLPh+RNA with N-IDRs from CPm-2 (VLPr, green), CPn-9 (VLPh, blue) and CPn-10 (VLPh+RNA, red) (Supplementary Fig. 2c). RNA in CPh+RNA is shown as an orange cartoon. The conserved residues R46 and D136/E139 are shown in opaque or transparent sticks, respectively, using the same color code as for the N-IDRs. c VLPT43C+D136C length distribution of 468 selected particles from the nsTEM micrographs, with values above the peaks indicating the mean length ± SD. Expected VLP length was calculated with helical parameters for VLPT43C+D136C:h+RNA with 5 nt per CP unit. d Pie chart showing the mean percentage of RNA sequencing reads (per base) mapped either to CP mRNA, E. coli rRNA or other E. coli RNAs for the RNA extracted from VLPT43C+D136C. e Histogram showing five most abundant CDS after mapping to 3’ ends (Methods) in the RNA extracted from VLPT43C+D136C. Shown is the mean value of transcripts per million (TPM, expressed in percent) from two biological replicates. f Top: schematic of pRSFDuet-1 vector with introduced CPT43C+D136C and p97. “T7P” and “T7T” designate T7 promotor and terminator, respectively. Bottom: SDS-PAGE of total cell samples before (BI) and after (AI) induction of CP-p97 co-expression, and purified VLPs. g Normalized coverage plots of RNA sequencing of CP (gray) and p97 (red) coding sequences of total cell RNA (top) and RNA extracted from VLPs (bottom). Shown are smoothed (black) and raw (dark gray and dark red for CP and p97, respectively) mean of coverage (n = 2); standard deviation is indicated with light gray and orange. The vertical line designates position with significant decrease in normalized coverage in both samples. h Top: histogram showing mean values of transcripts per million (TPM, in percent) of mapped reads for CP (gray), p97 (red), or E. coli coding sequences (white) for total cell RNA and RNA from VLPs as determined by RNA sequencing. Bottom: histogram showing five most abundant CDS after mapping to 3’ ends (Methods) in RNA from VLPs. Each histogram shows the mean values of two biological replicates. The source data for panels c and f are provided as Supplementary Data file.

Similar articles

Cited by

References

    1. Stubbs G, Kendall A. Helical viruses. Adv. Exp. Med. Biol. 2012;726:631–658. doi: 10.1007/978-1-4614-0980-9_28. - DOI - PubMed
    1. Carstens, E. B. Introduction to virus taxonomy in virus taxonomy. In Ninth Report of the International Committee on Taxonomy of Viruses (ed. King, A. M. Q., Adams, M. J., Carstens, E. B. & Lefkowitz, E.) 3–20 (Elsevier Inc, 2012).
    1. Inoue-Nagata AK, et al. ICTV virus taxonomy profile: potyviridae 2022. J. Gen. Virol. 2022;103:001738. doi: 10.1099/jgv.0.001738. - DOI - PubMed
    1. Yang X, Li Y, Wang A. Research advances in potyviruses: from the laboratory bench to the field. Ann. Rev. Phytopathol. 2021;59:1–29. doi: 10.1146/annurev-phyto-020620-114550. - DOI - PubMed
    1. Zamora M, et al. Potyvirus virion structure shows conserved protein fold and RNA binding site in ssRNA viruses. Sci. Adv. 2017;3:eaao2182. doi: 10.1126/sciadv.aao2182. - DOI - PMC - PubMed