. 2024 Jan;625(7996):743-749.
doi: 10.1038/s41586-023-06912-w. Epub 2024 Jan 17.

Top-down control of flight by a non-canonical cortico-amygdala pathway

Affiliations

Top-down control of flight by a non-canonical cortico-amygdala pathway

Chandrashekhar D Borkar et al. Nature. 2024 Jan.

Abstract

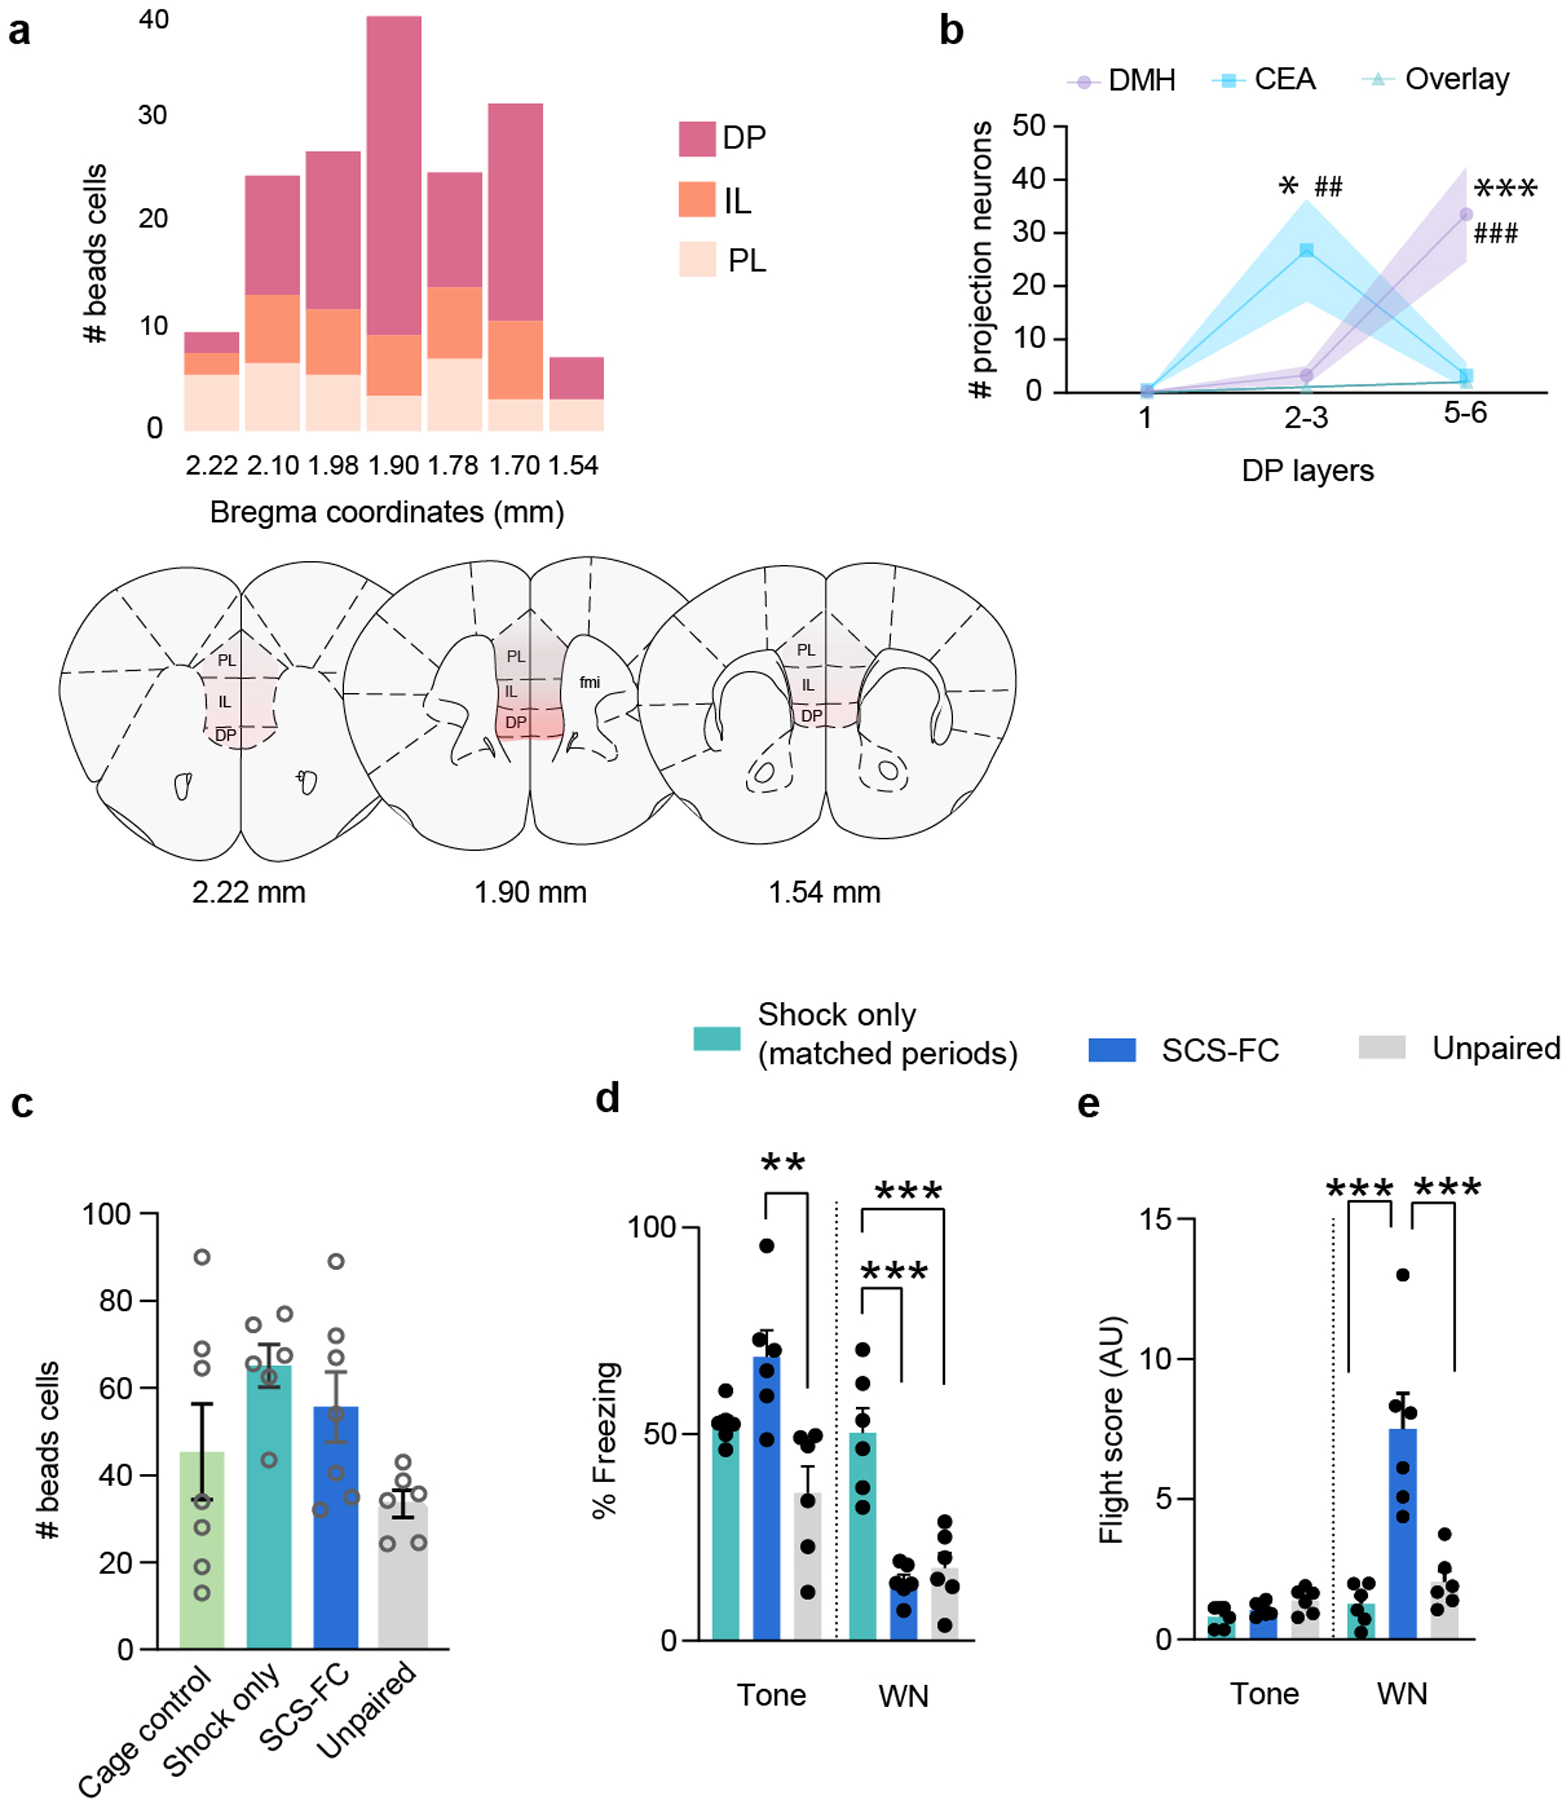
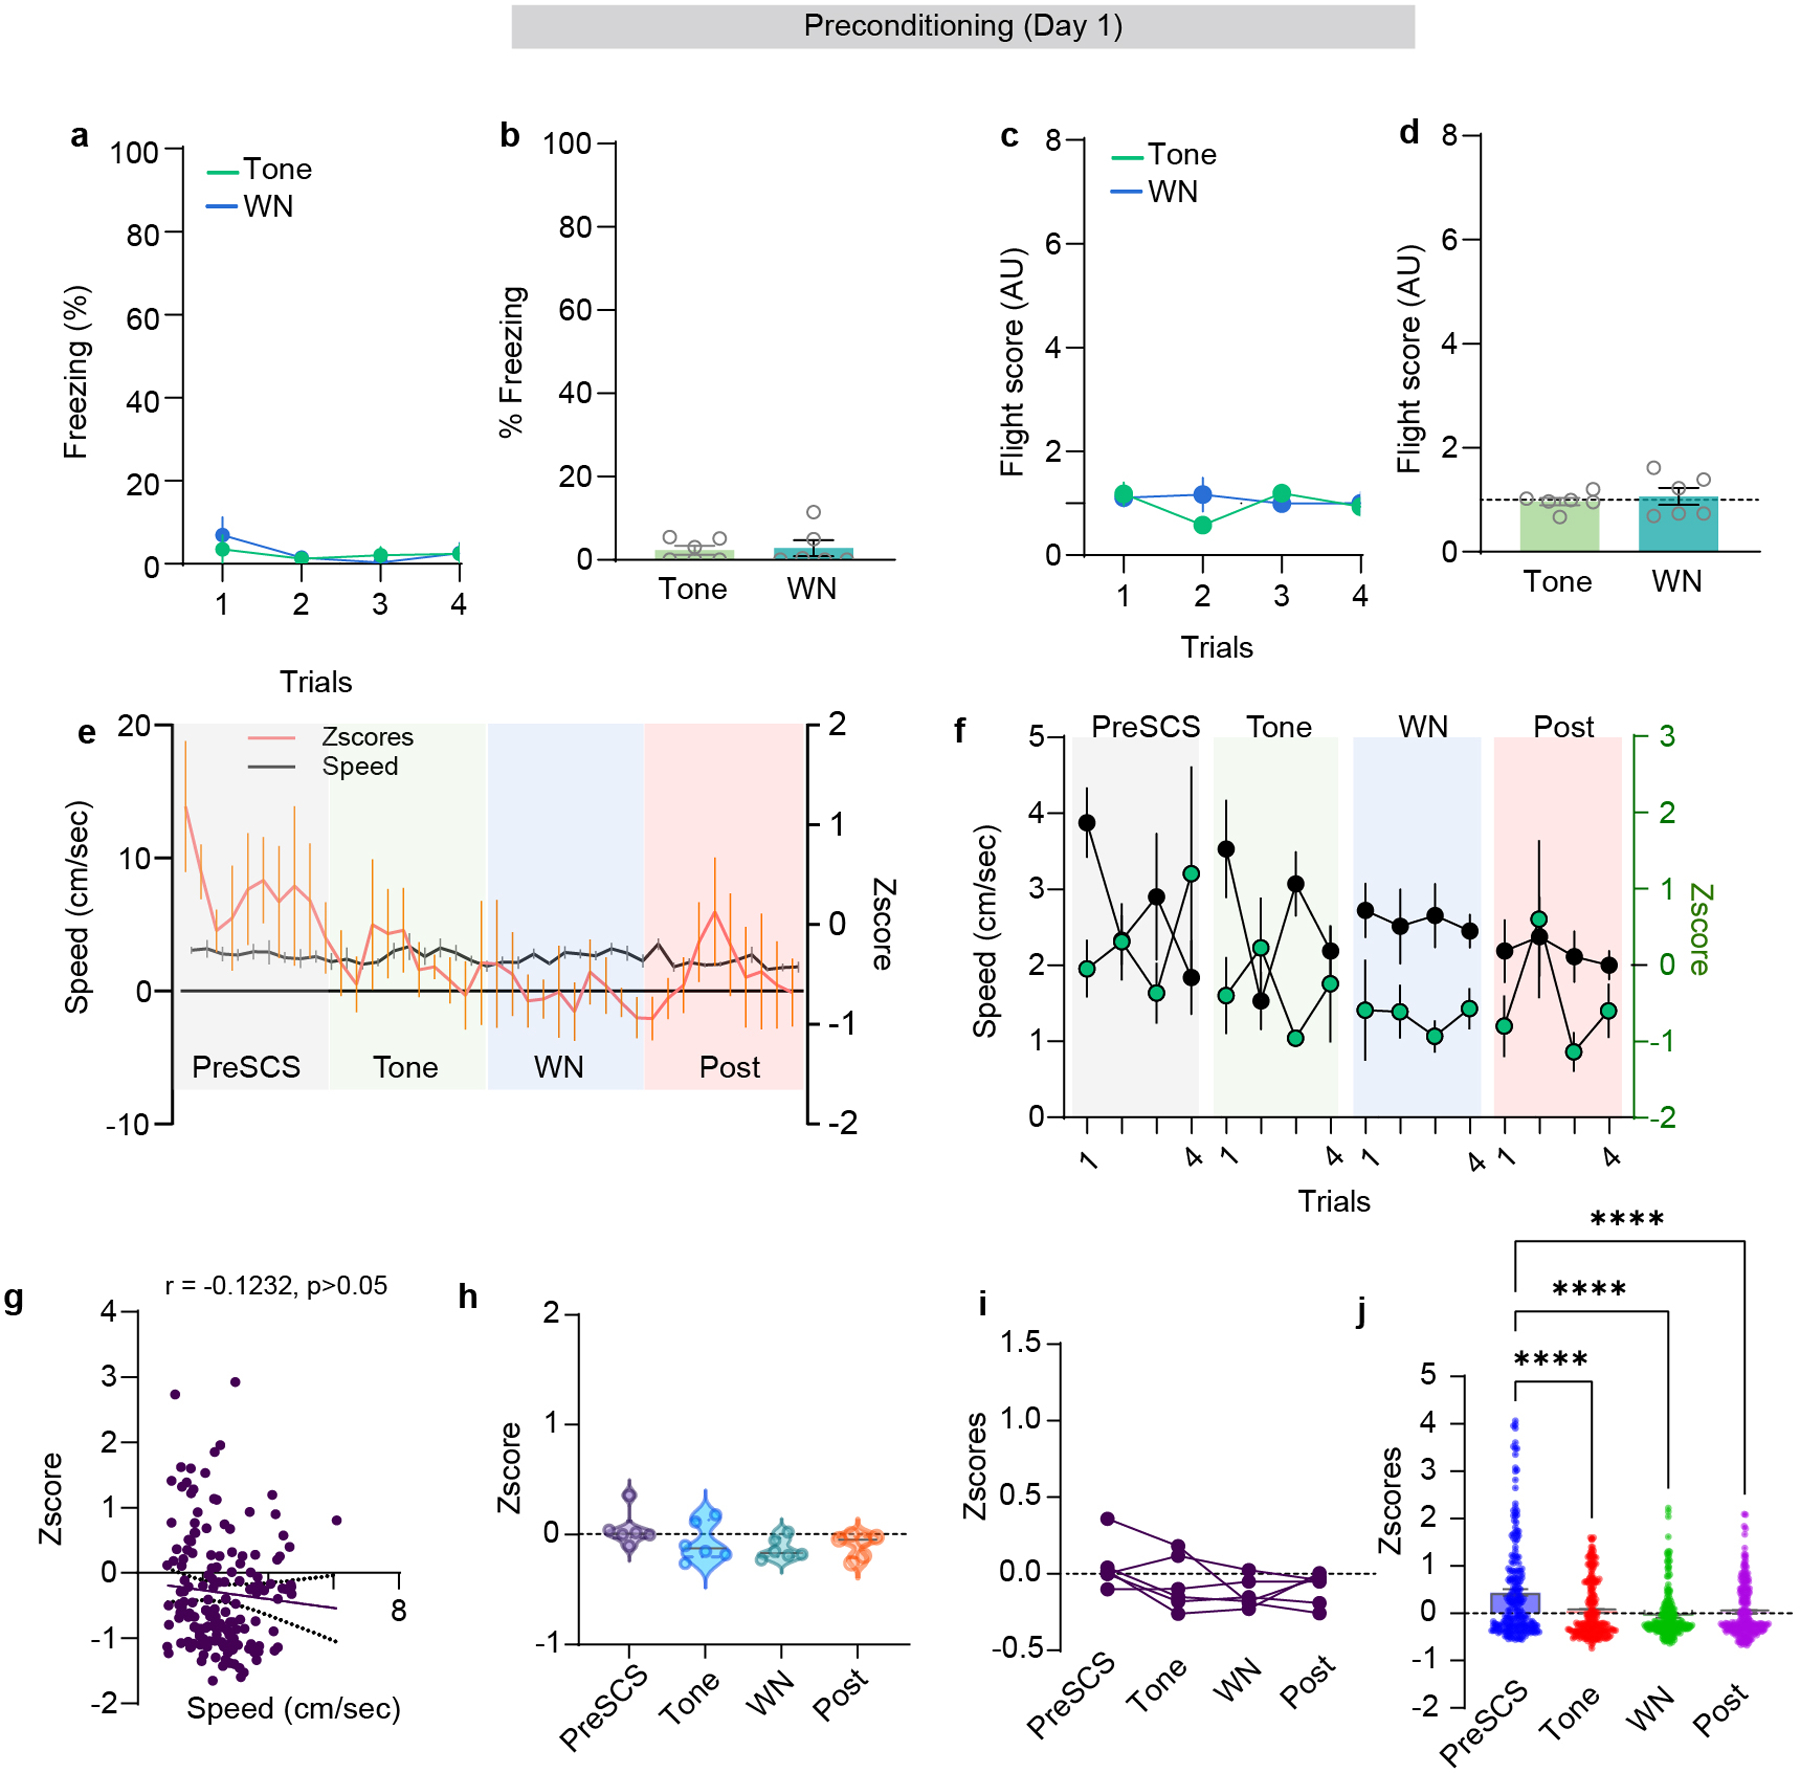
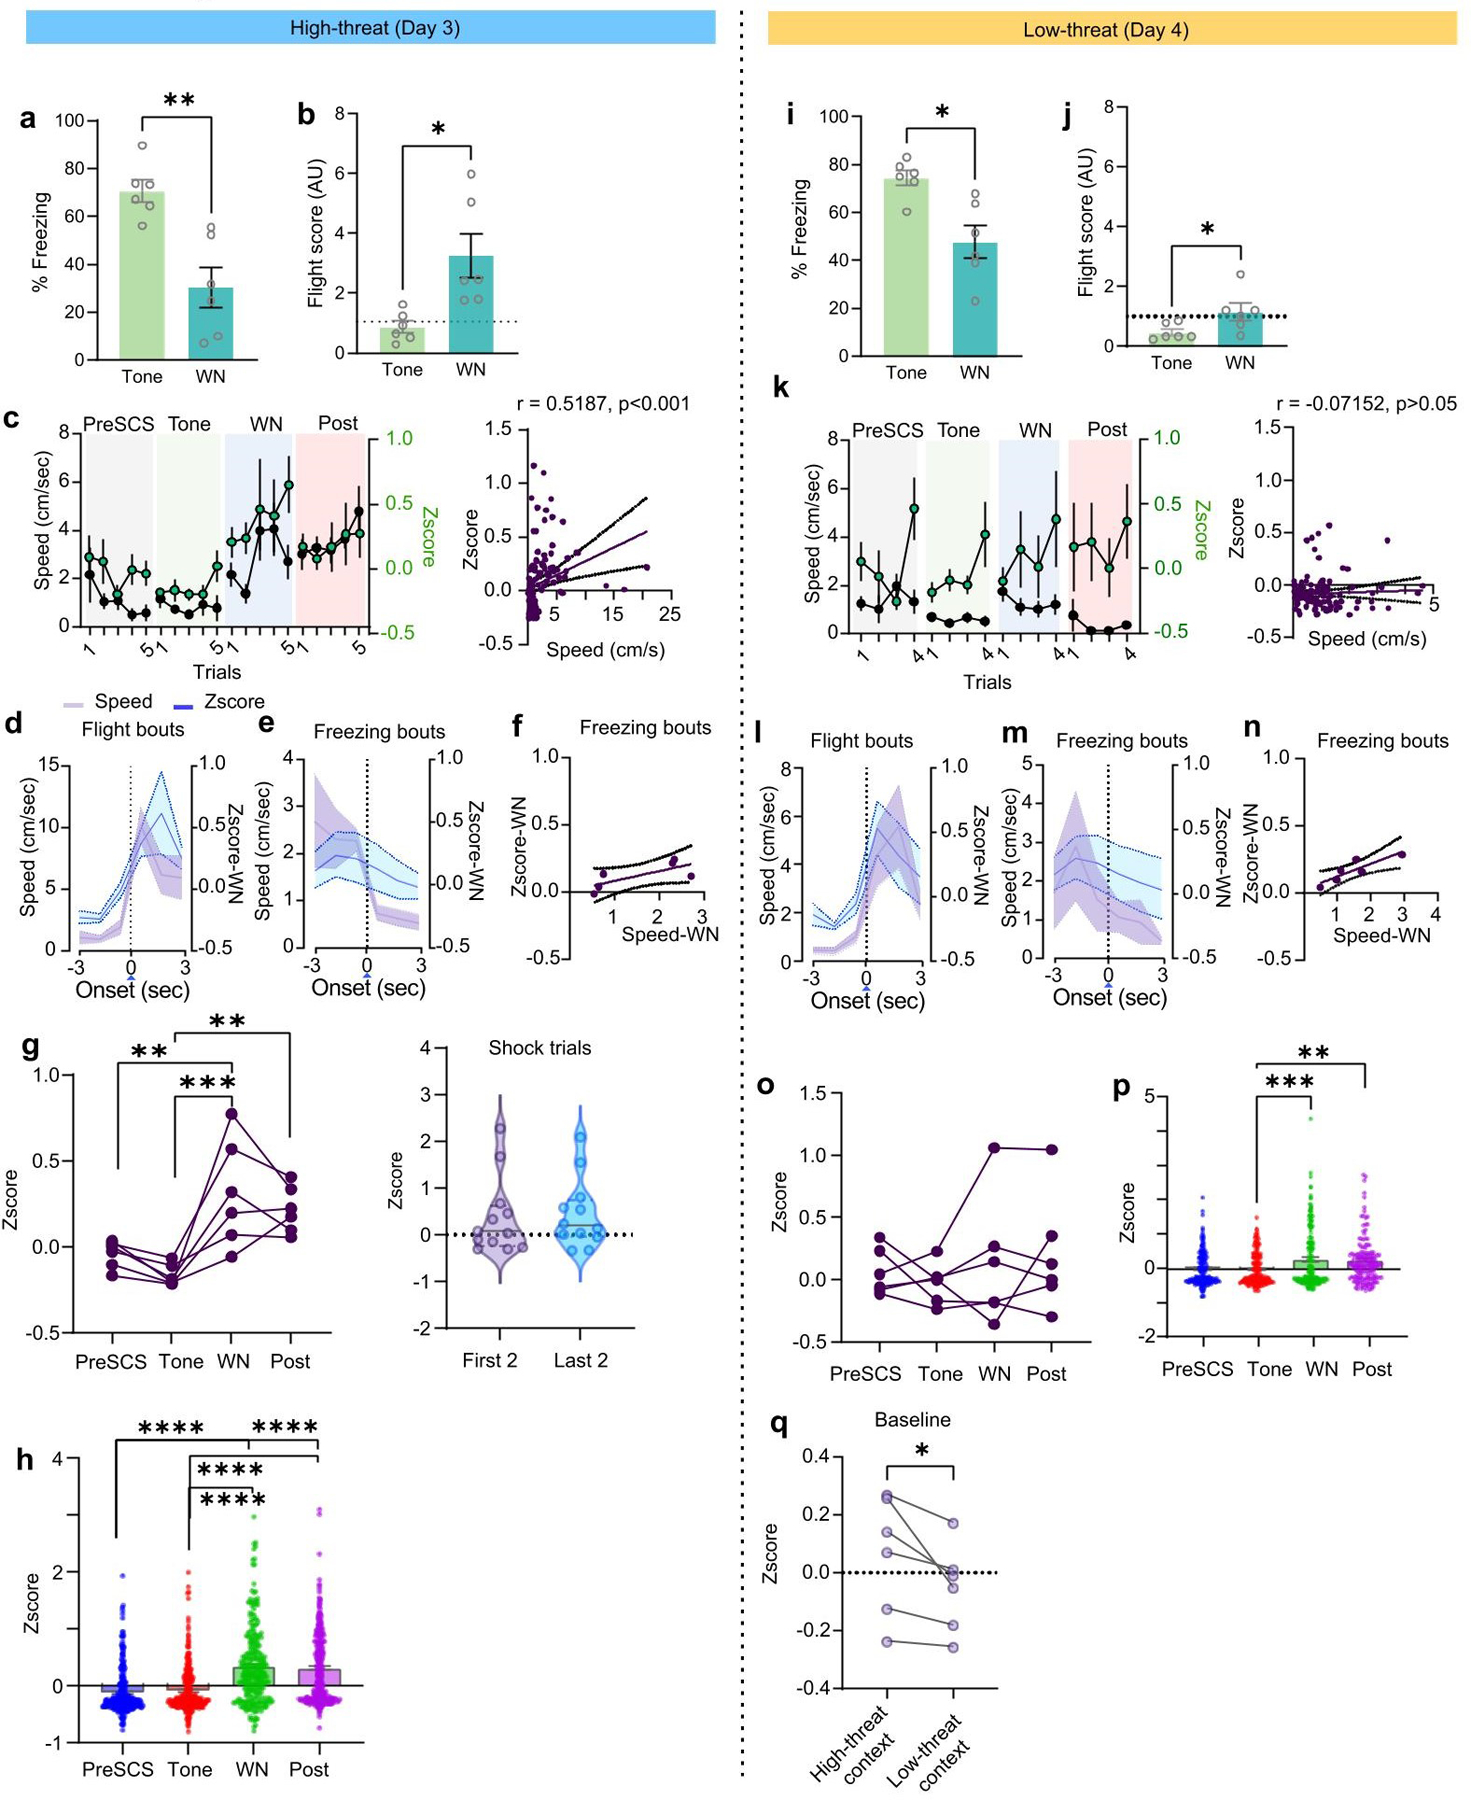
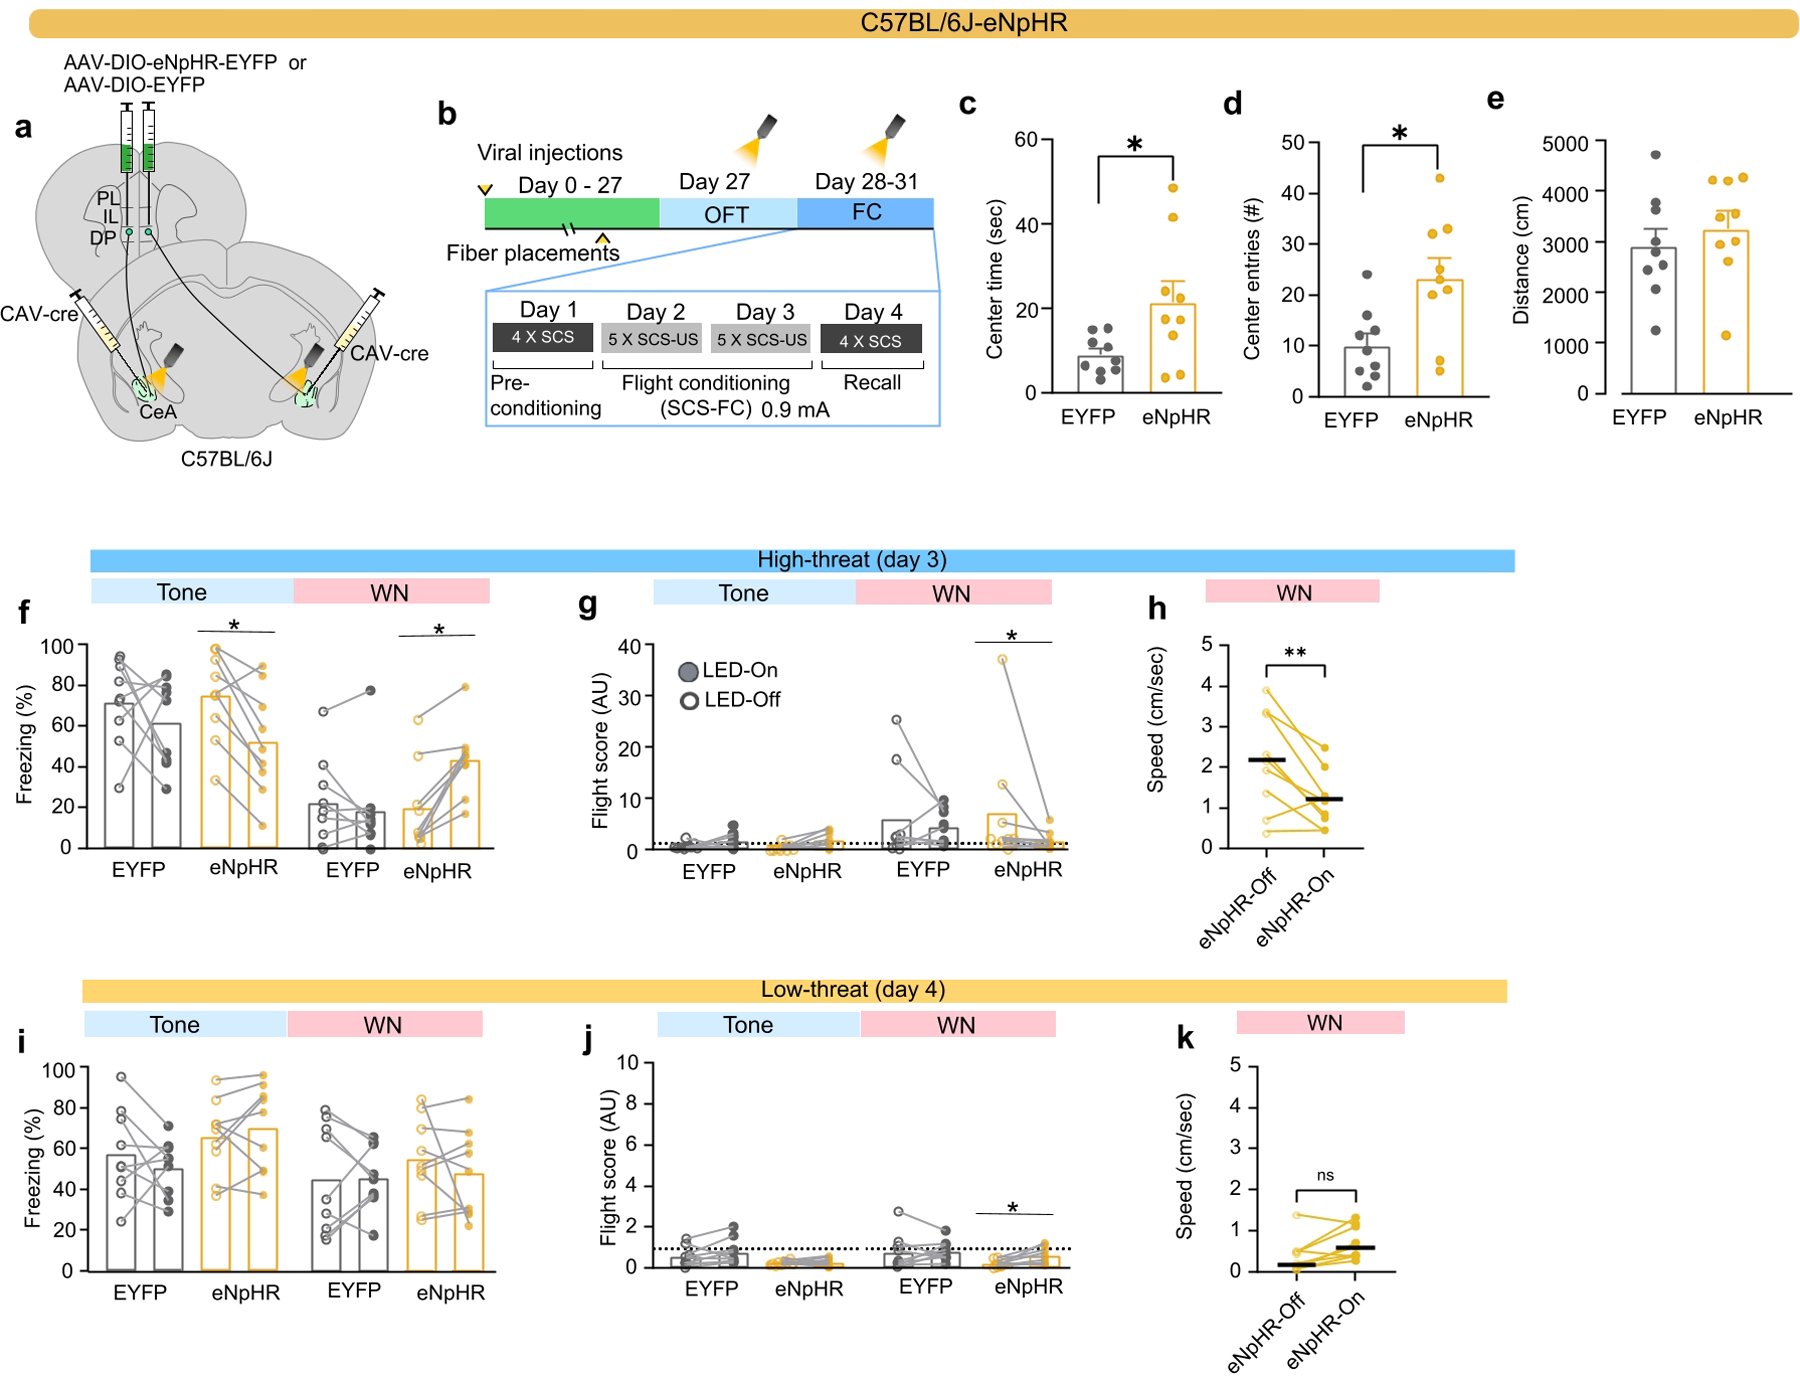
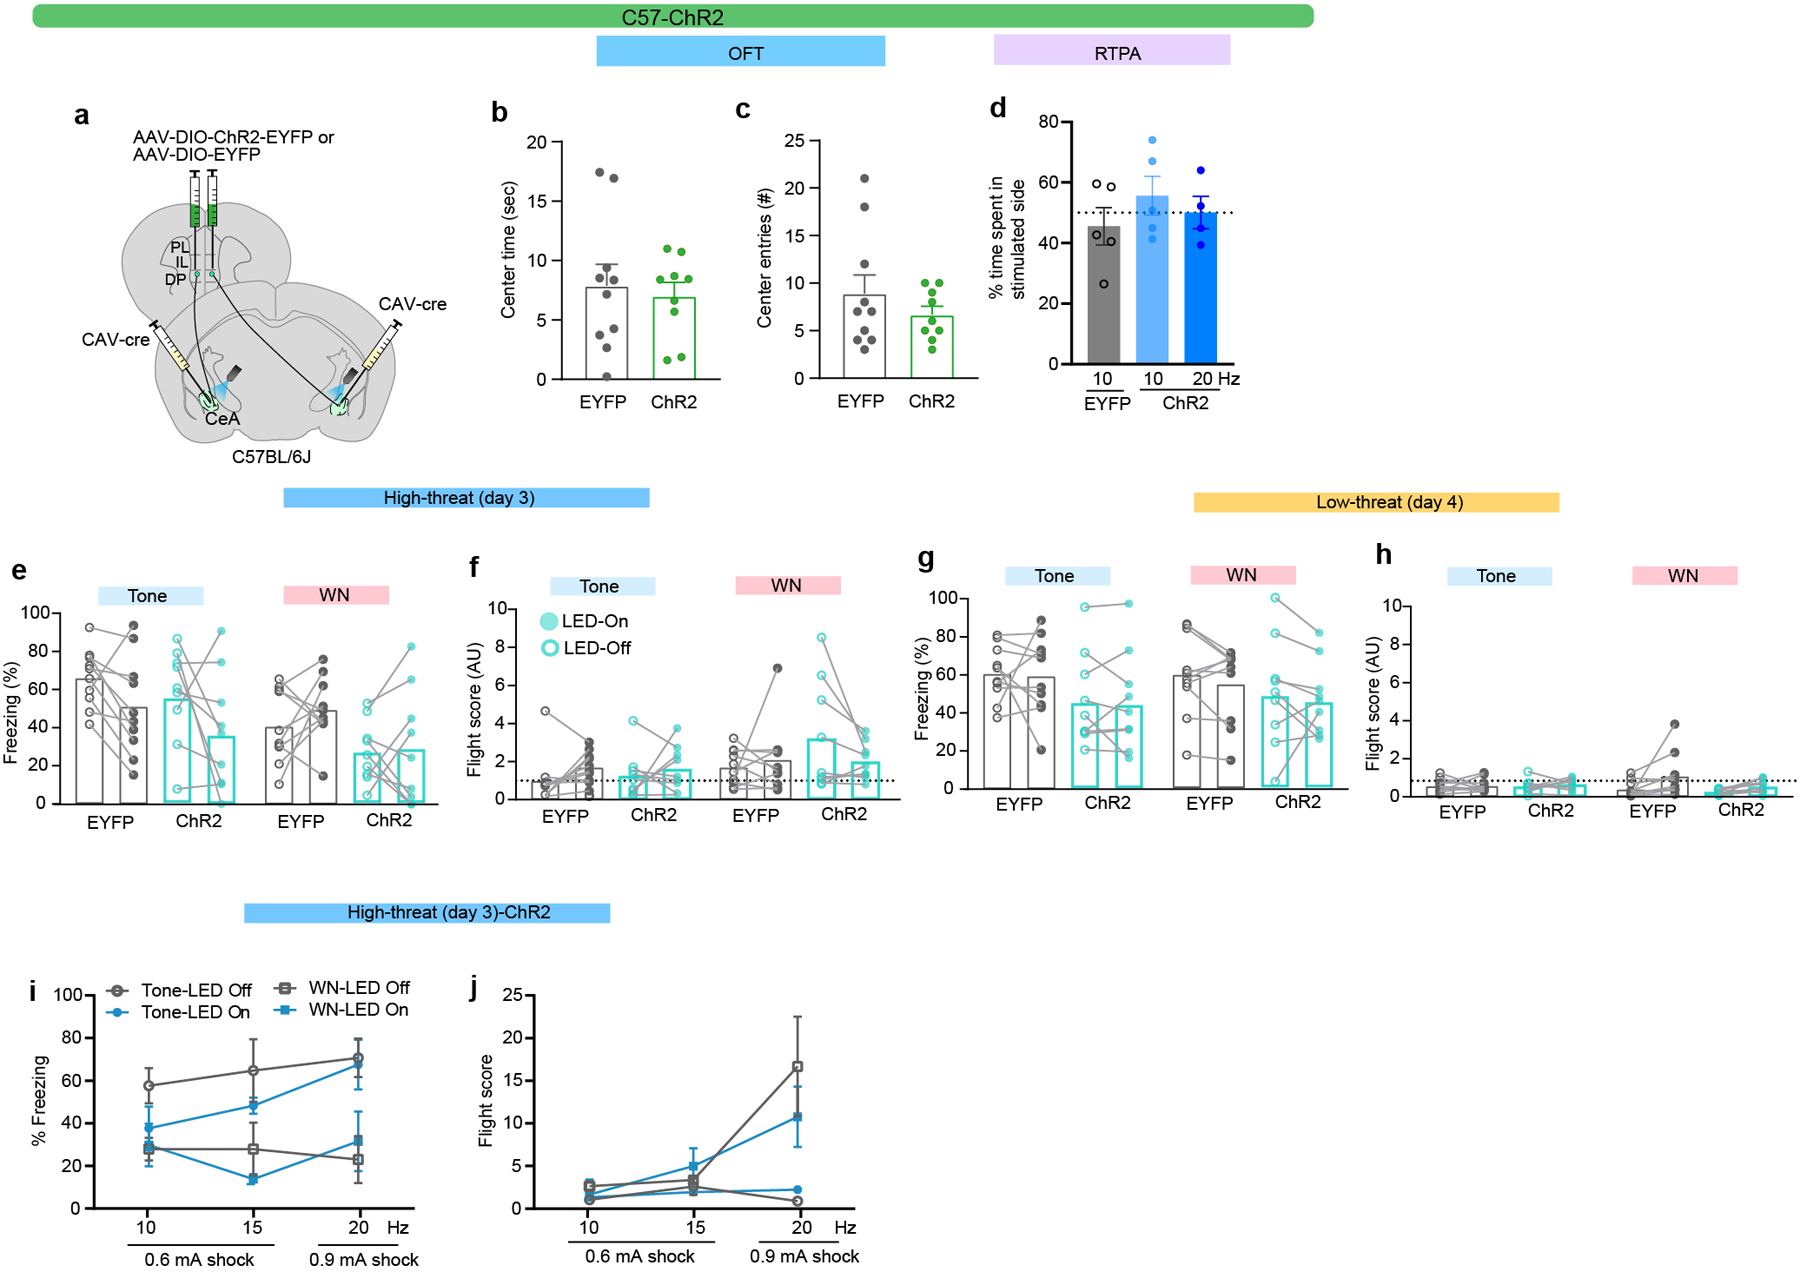
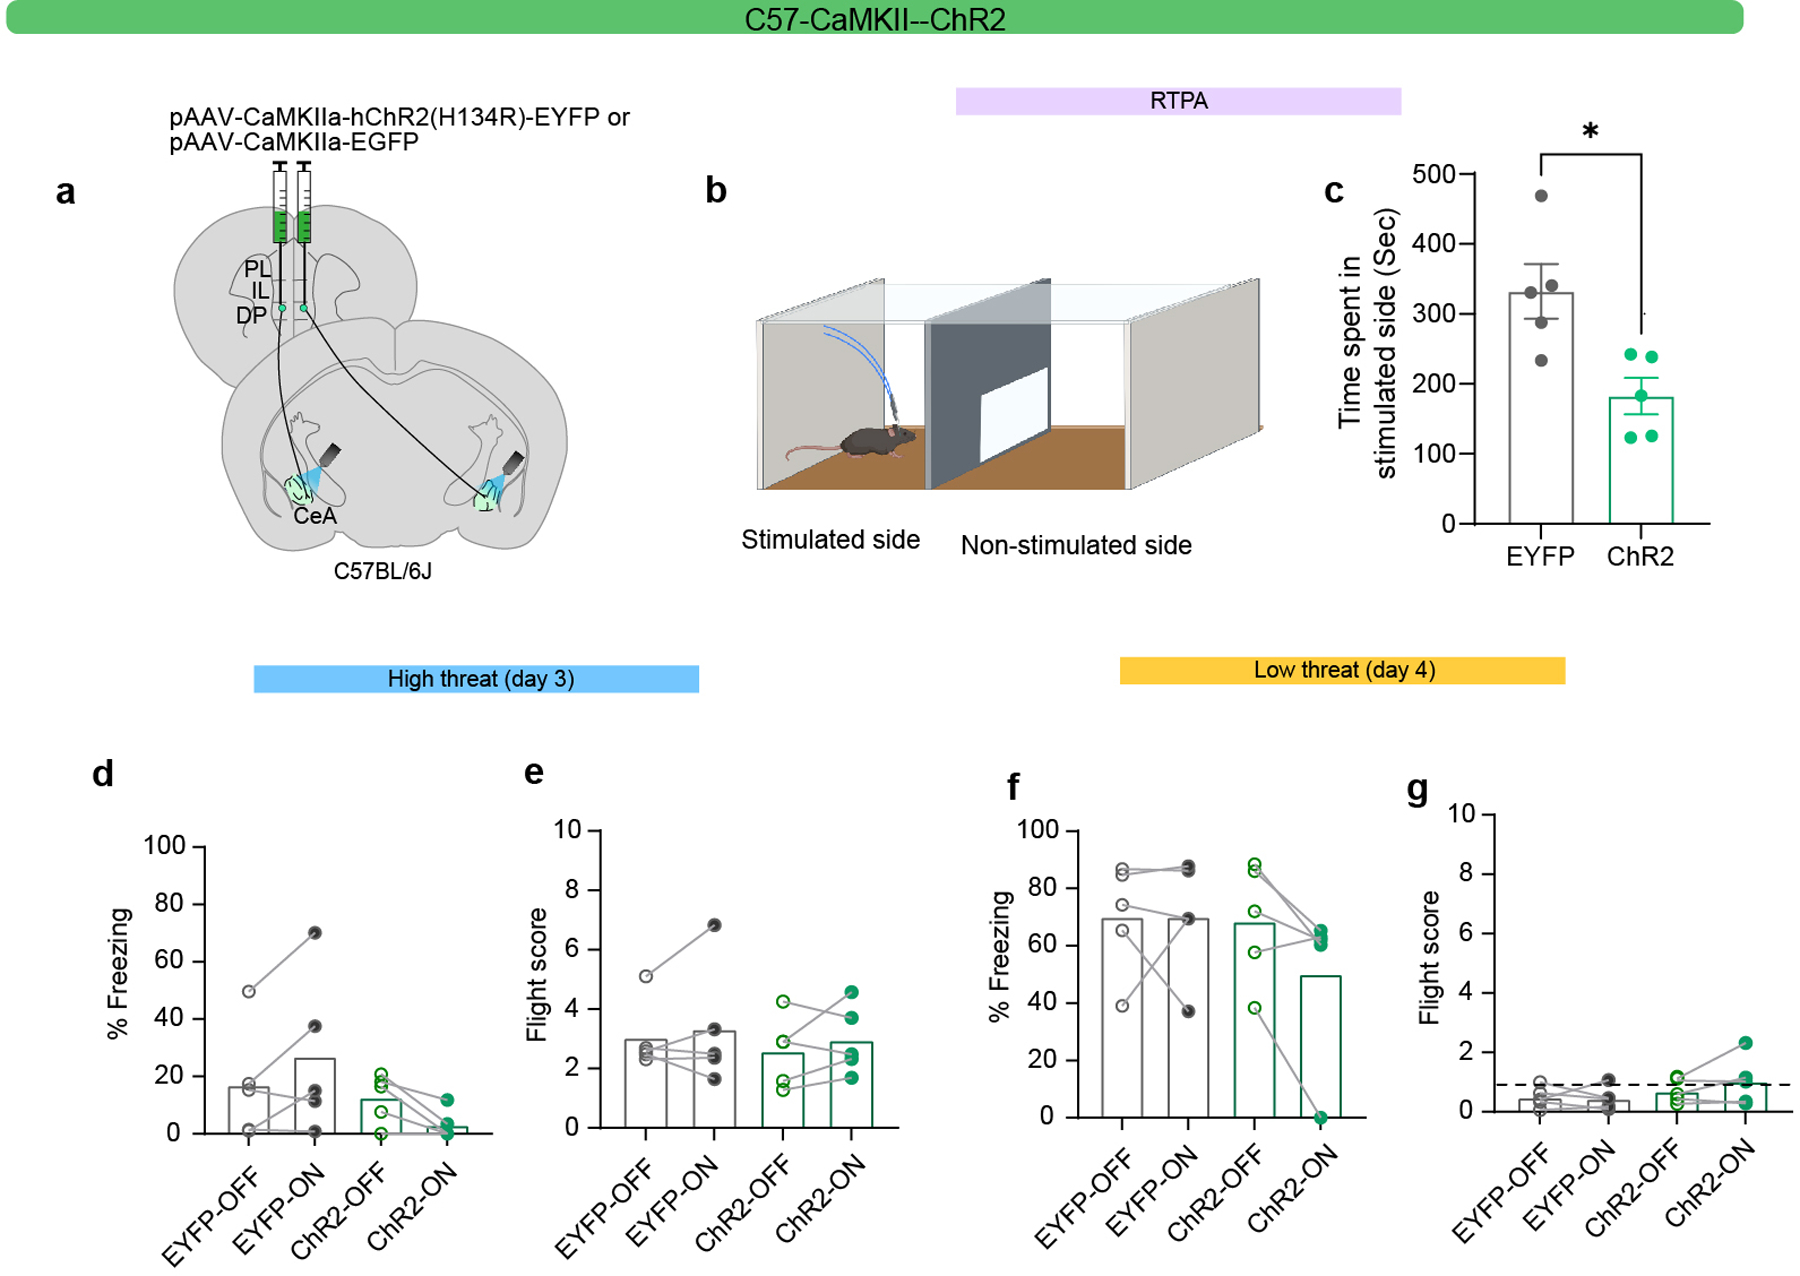
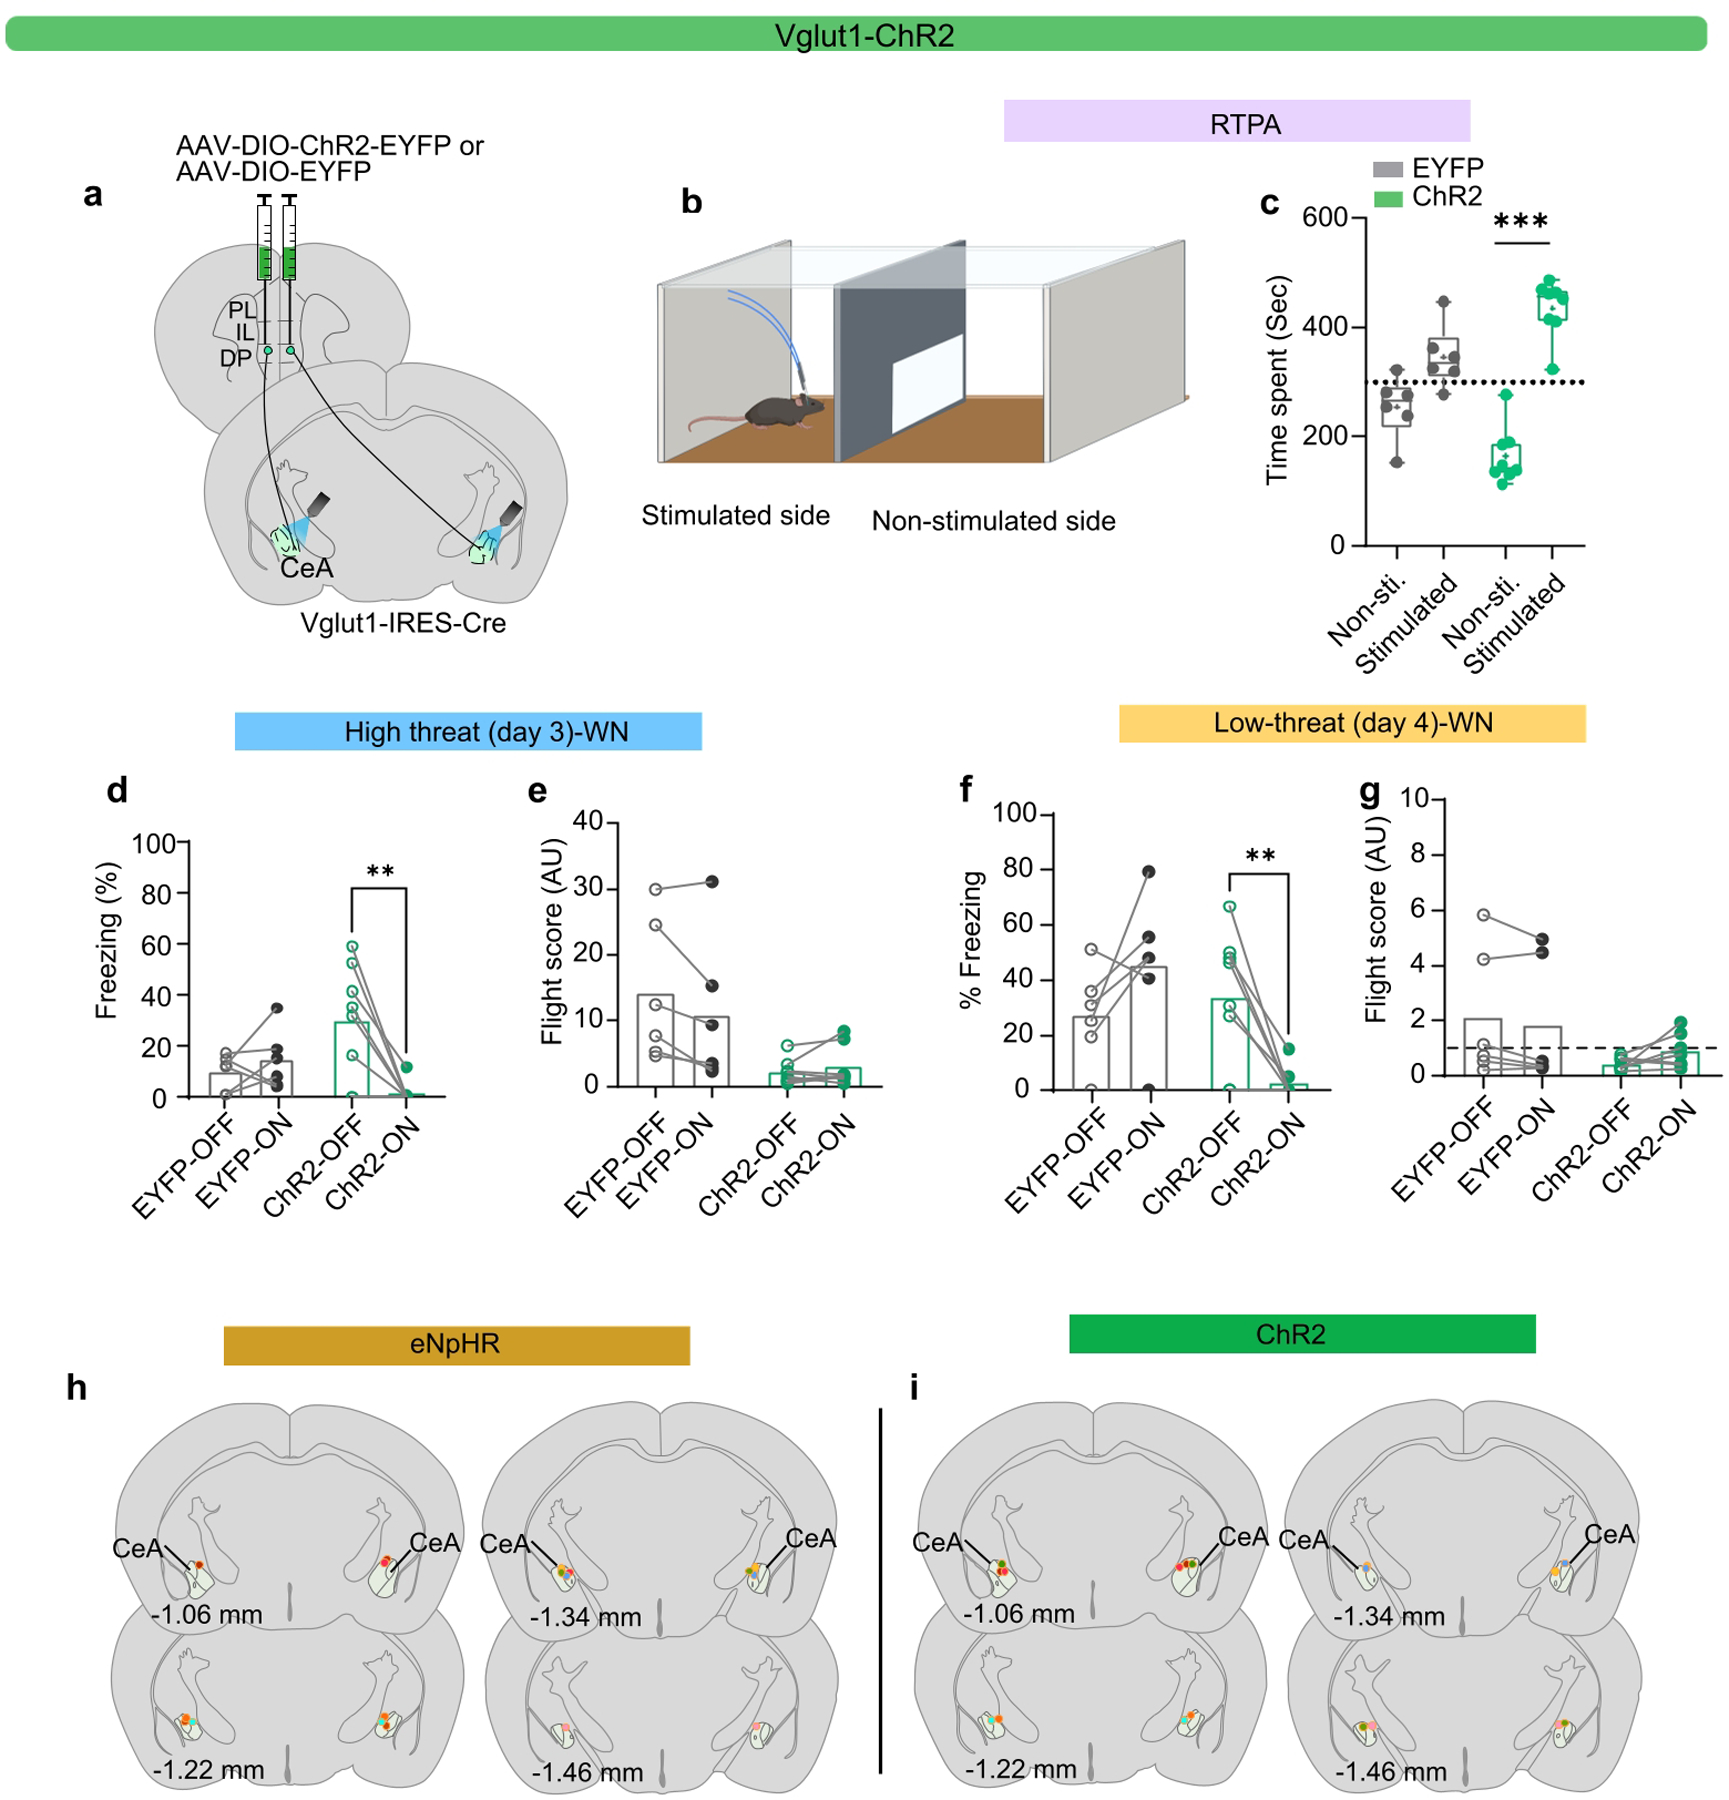
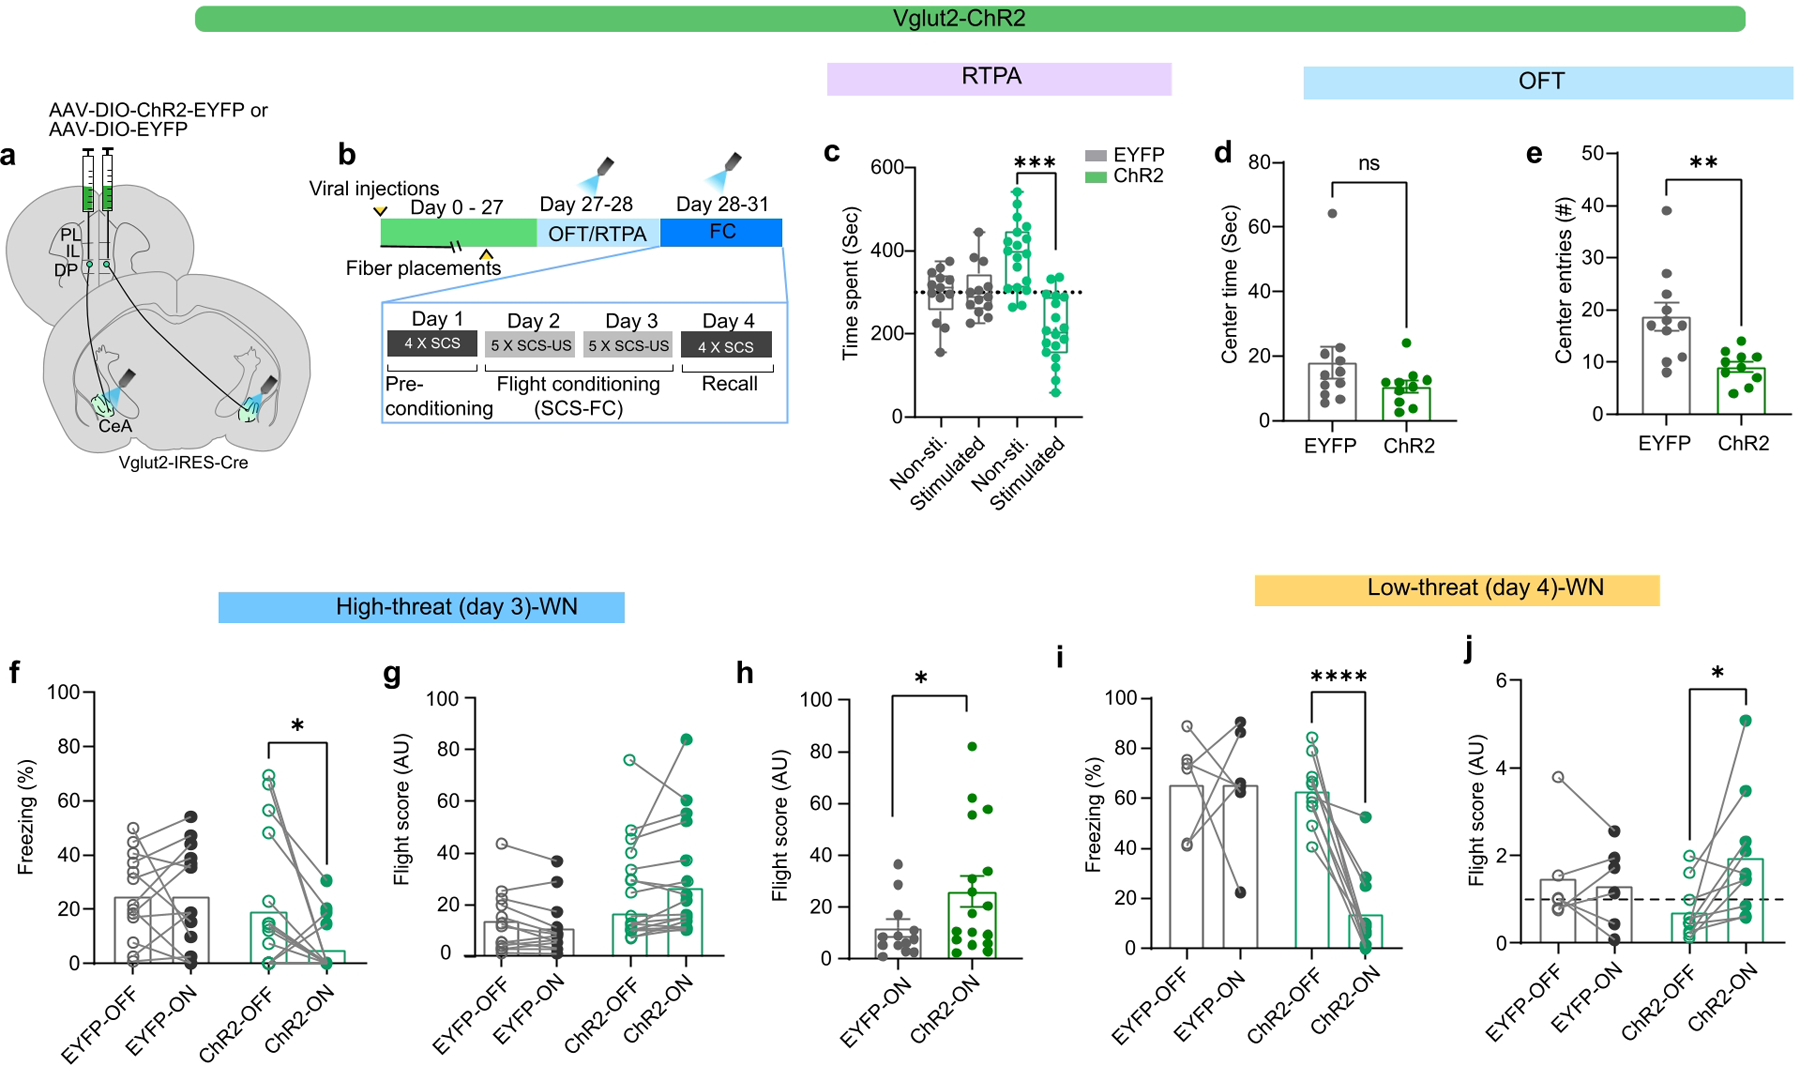
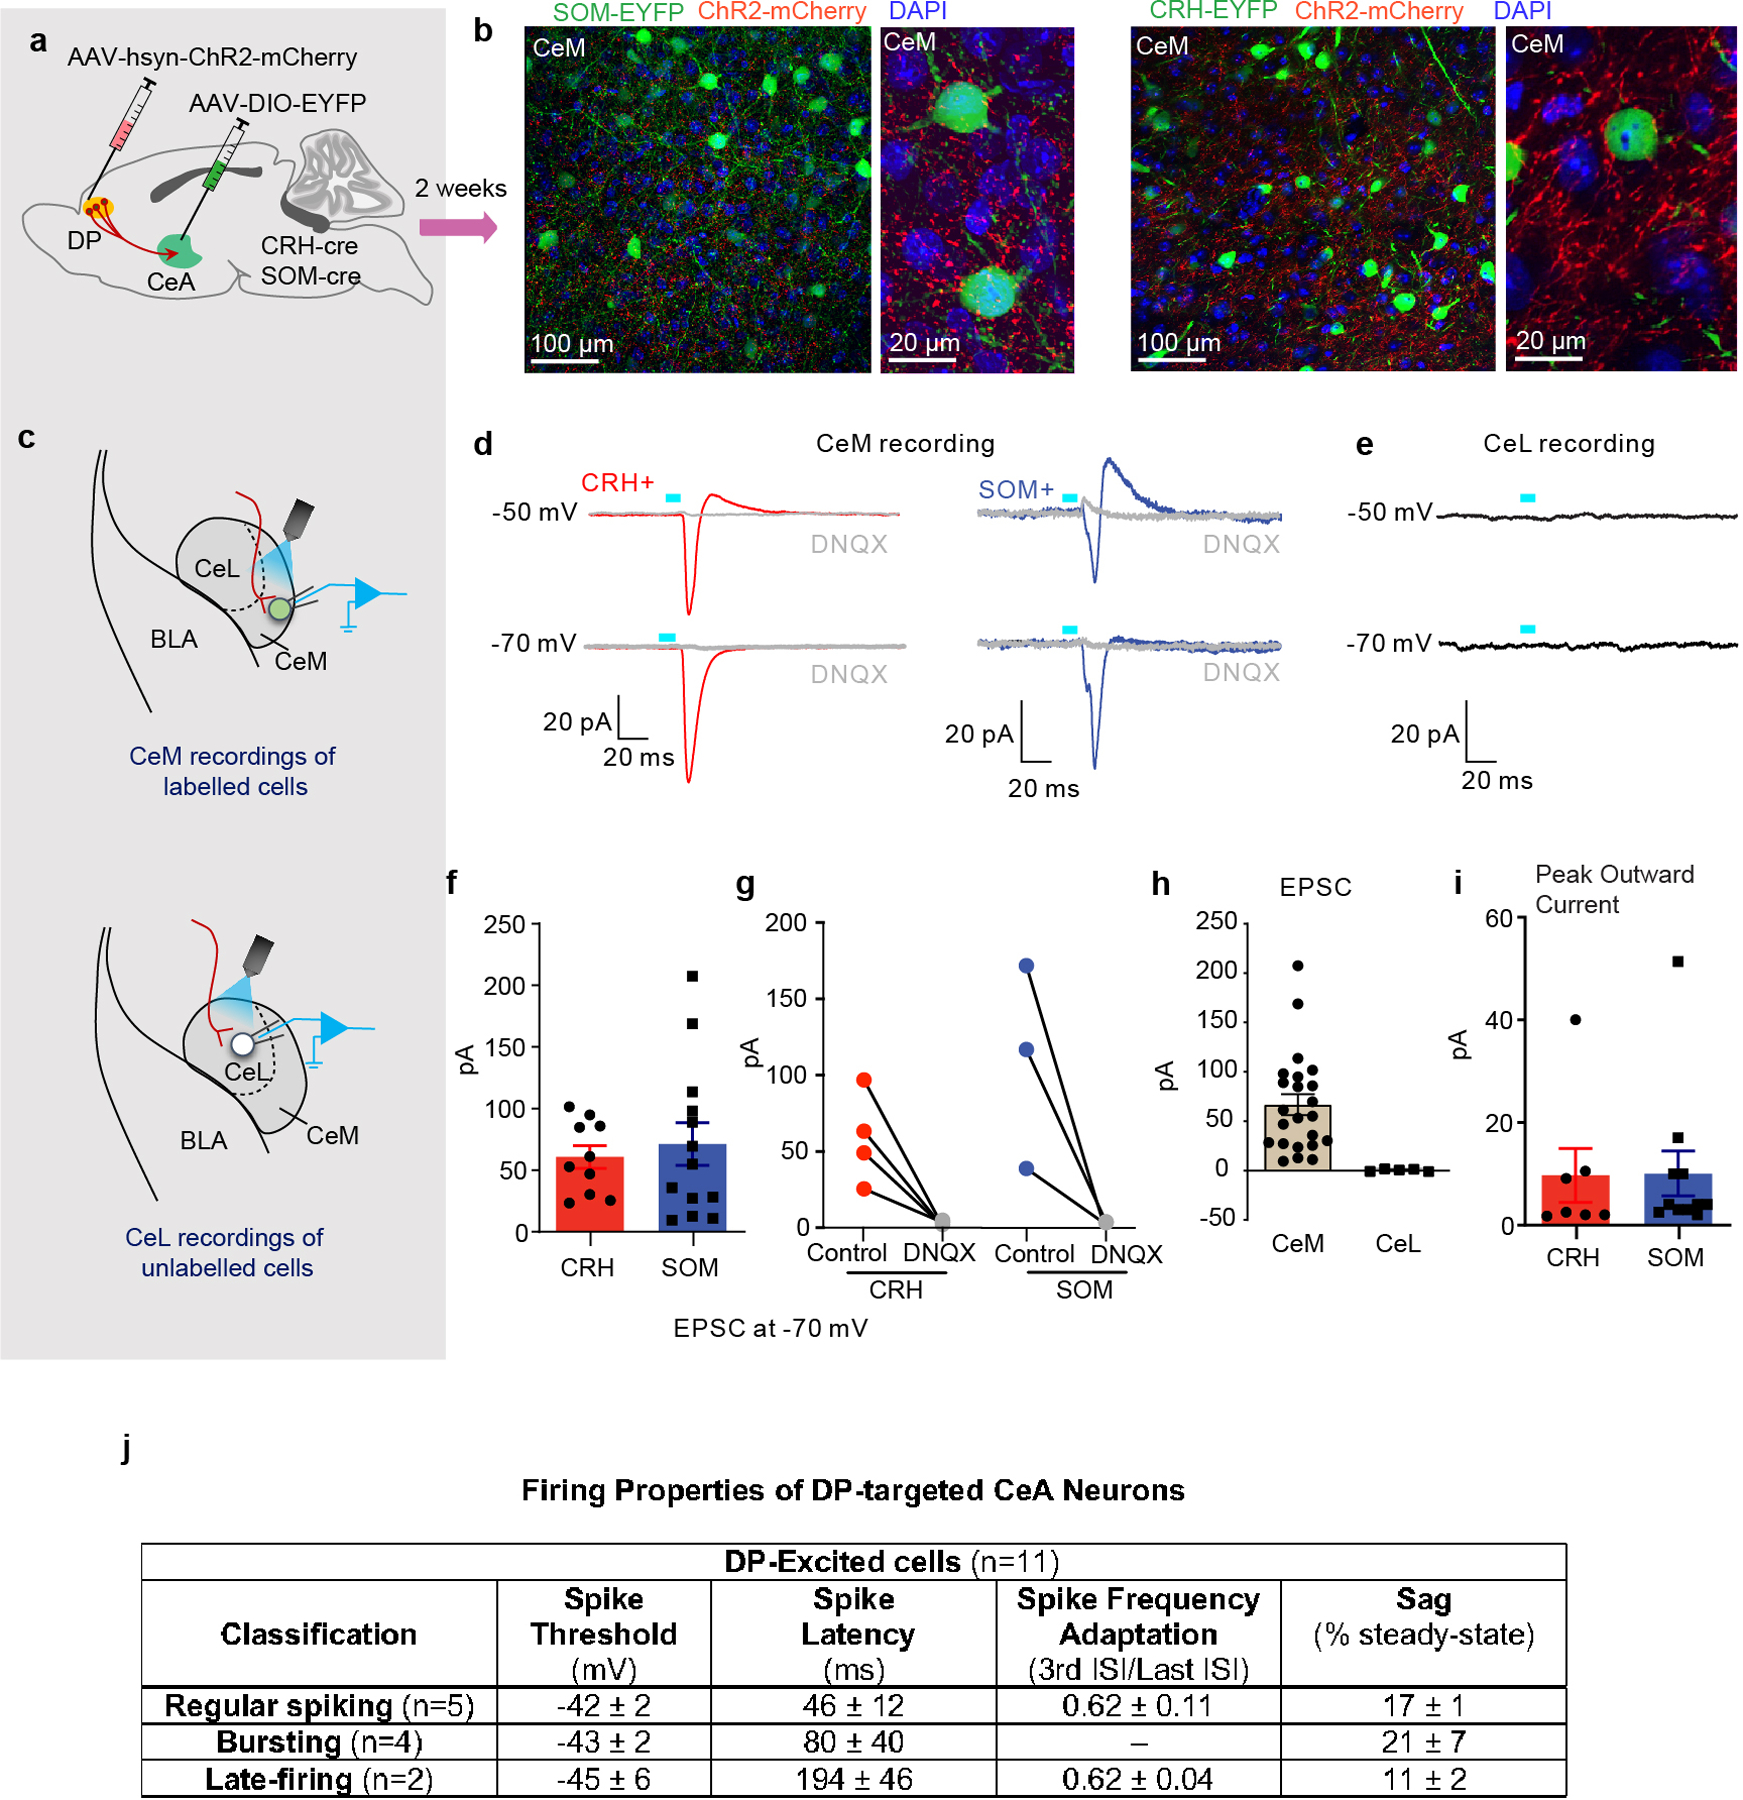
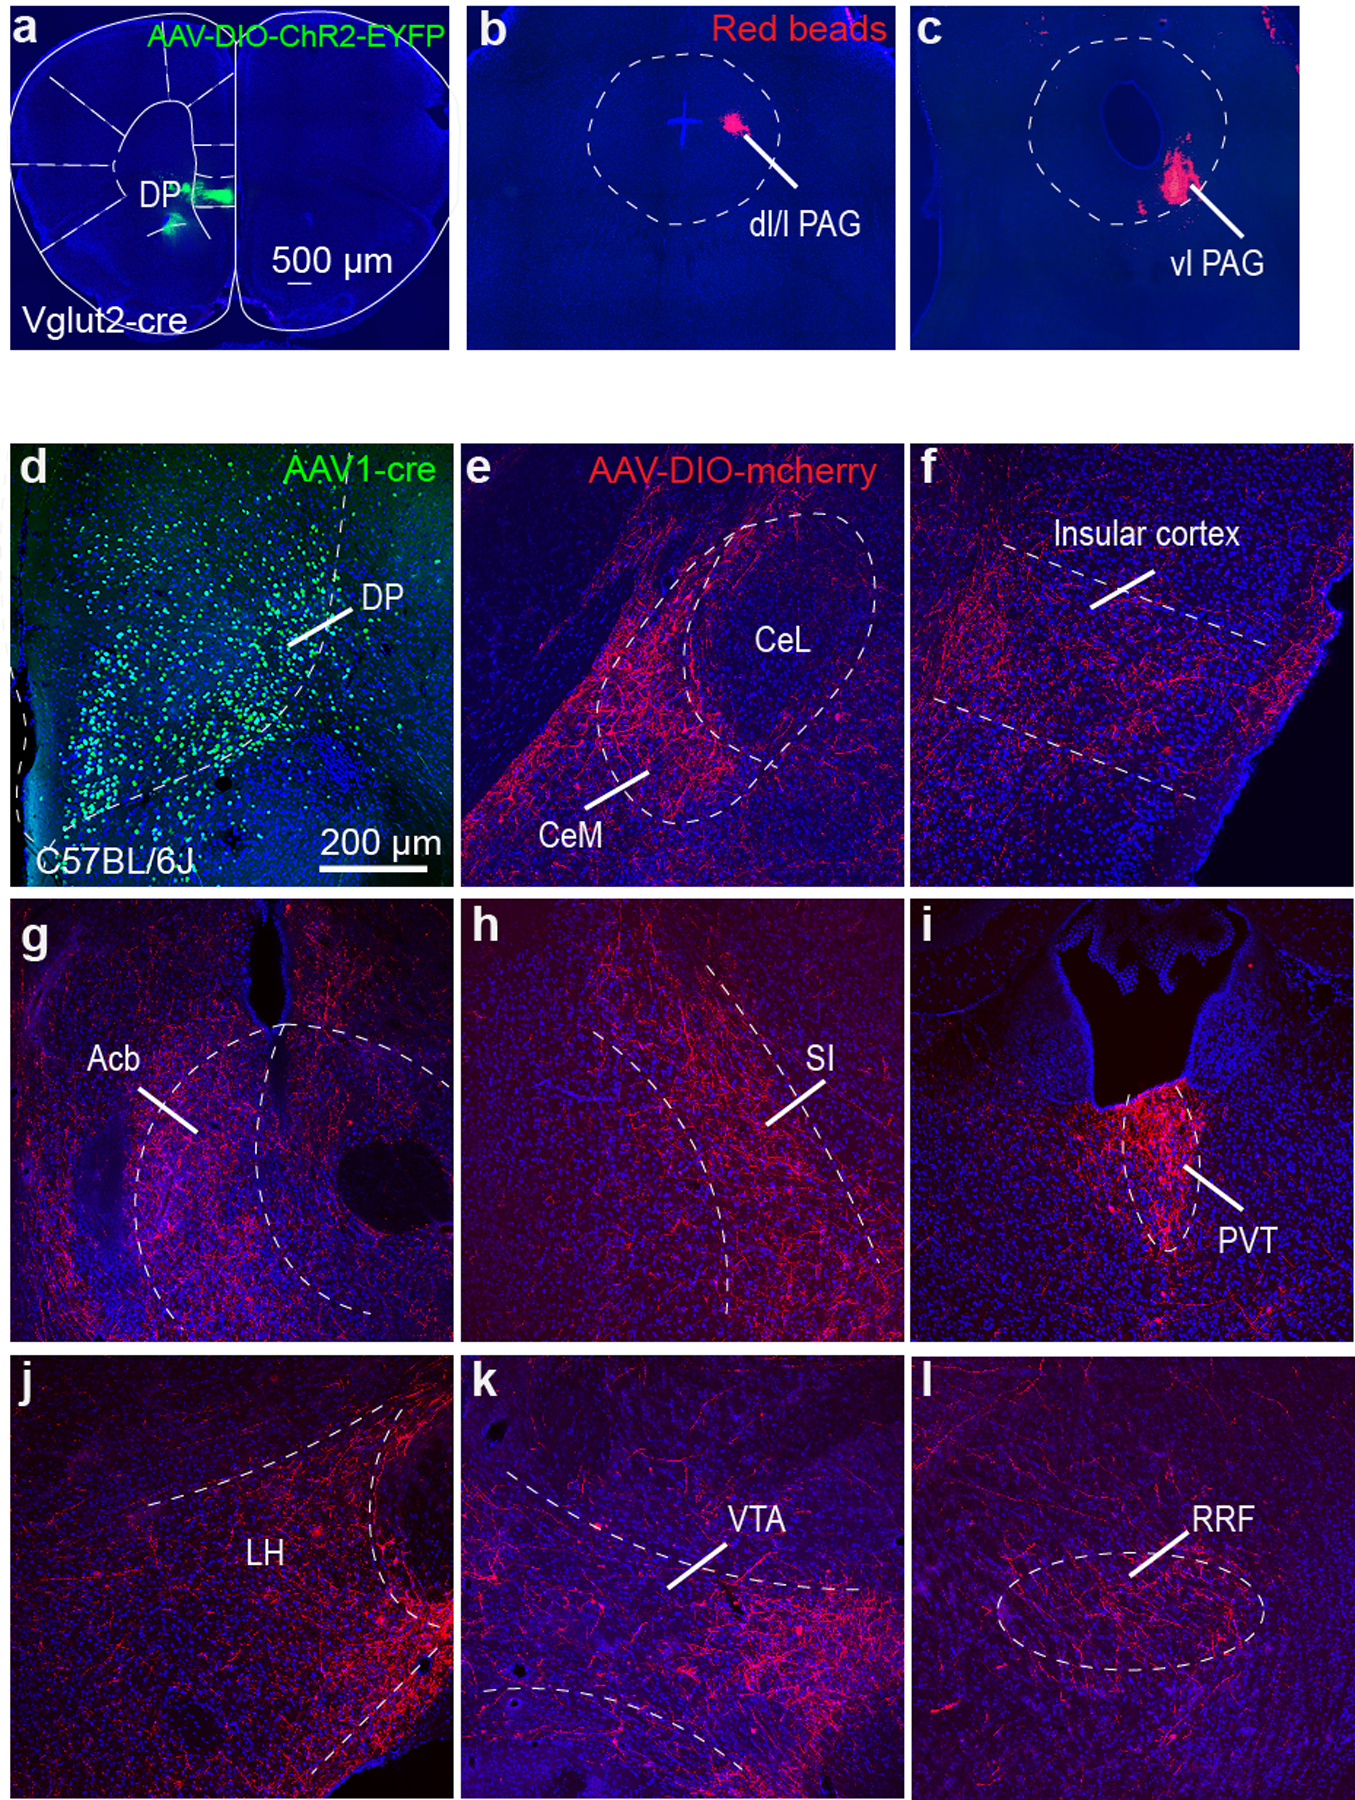
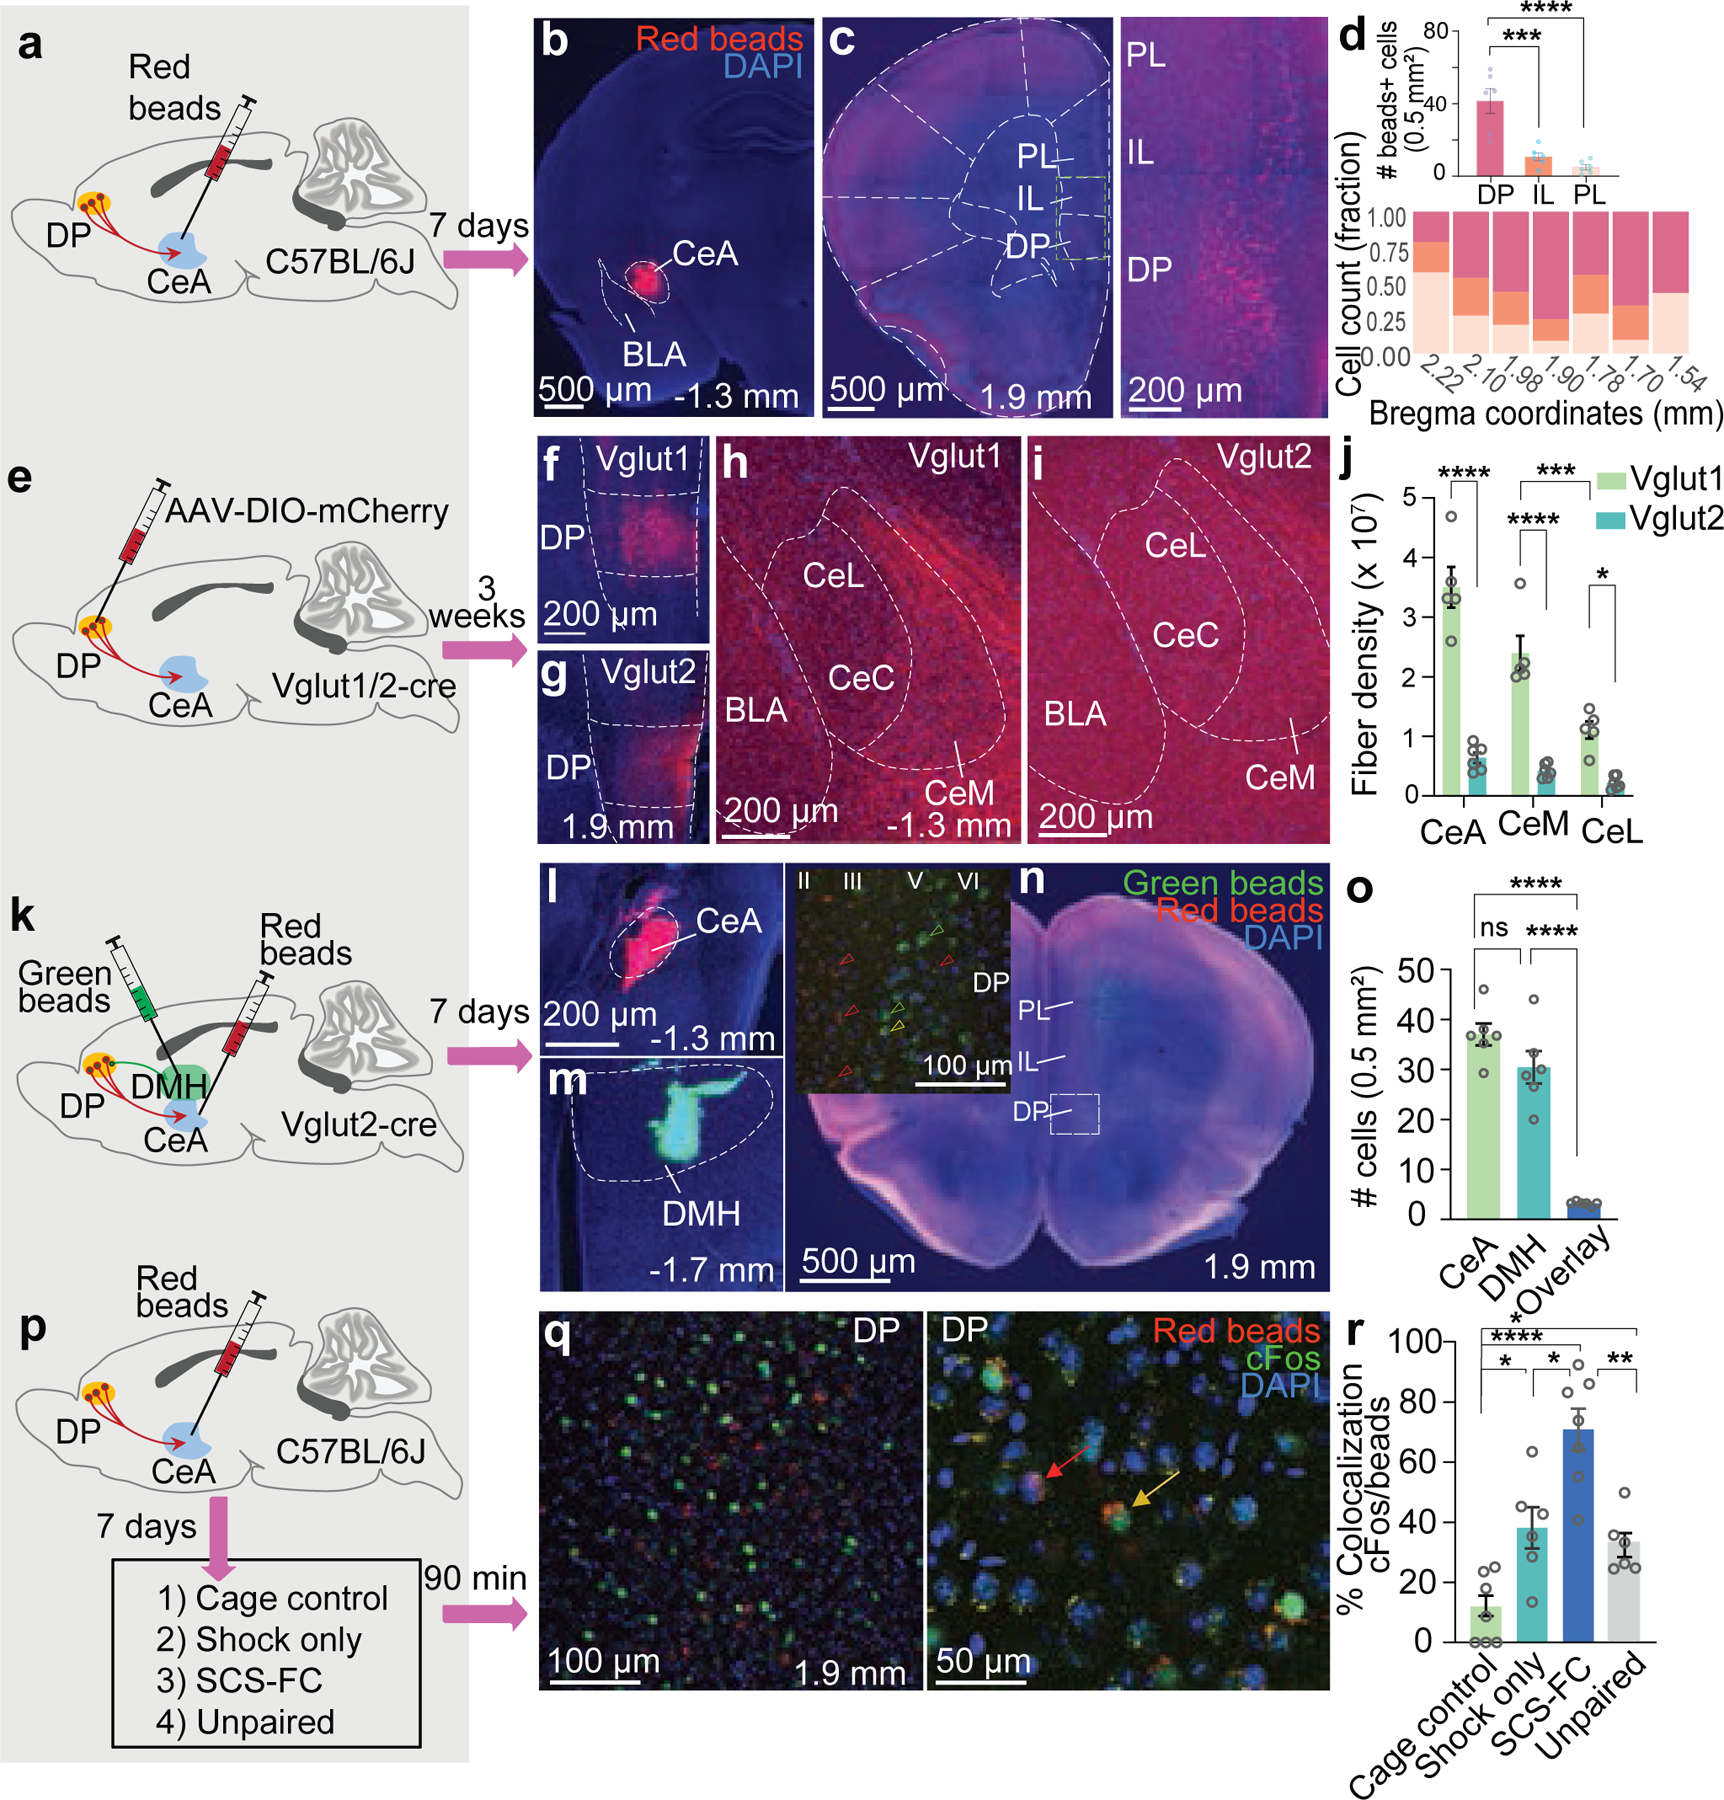
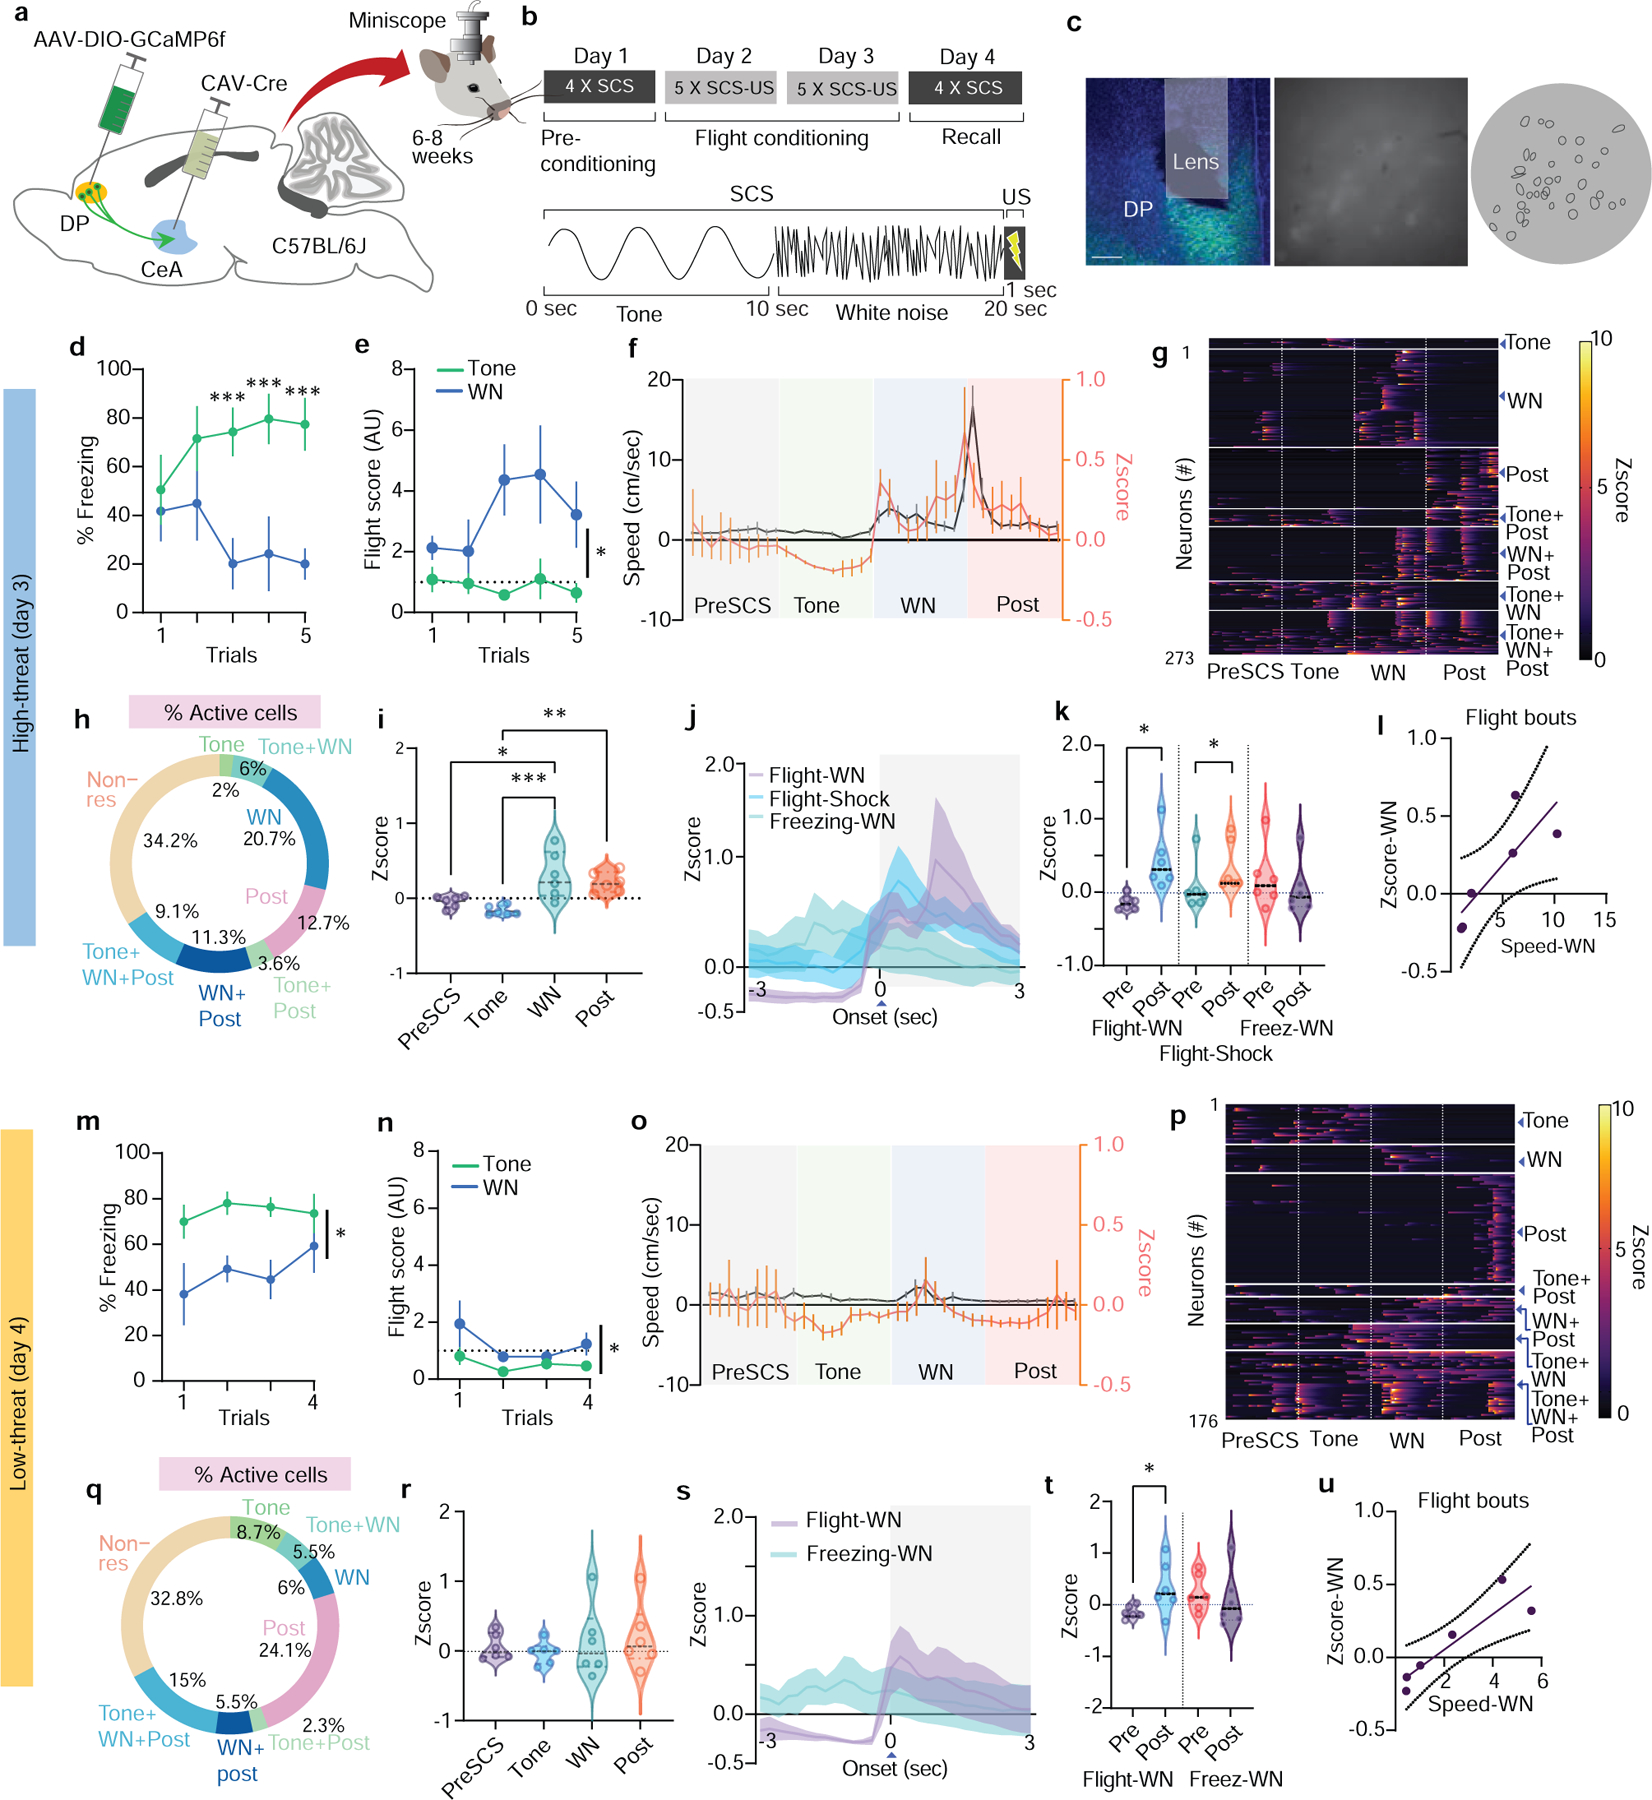
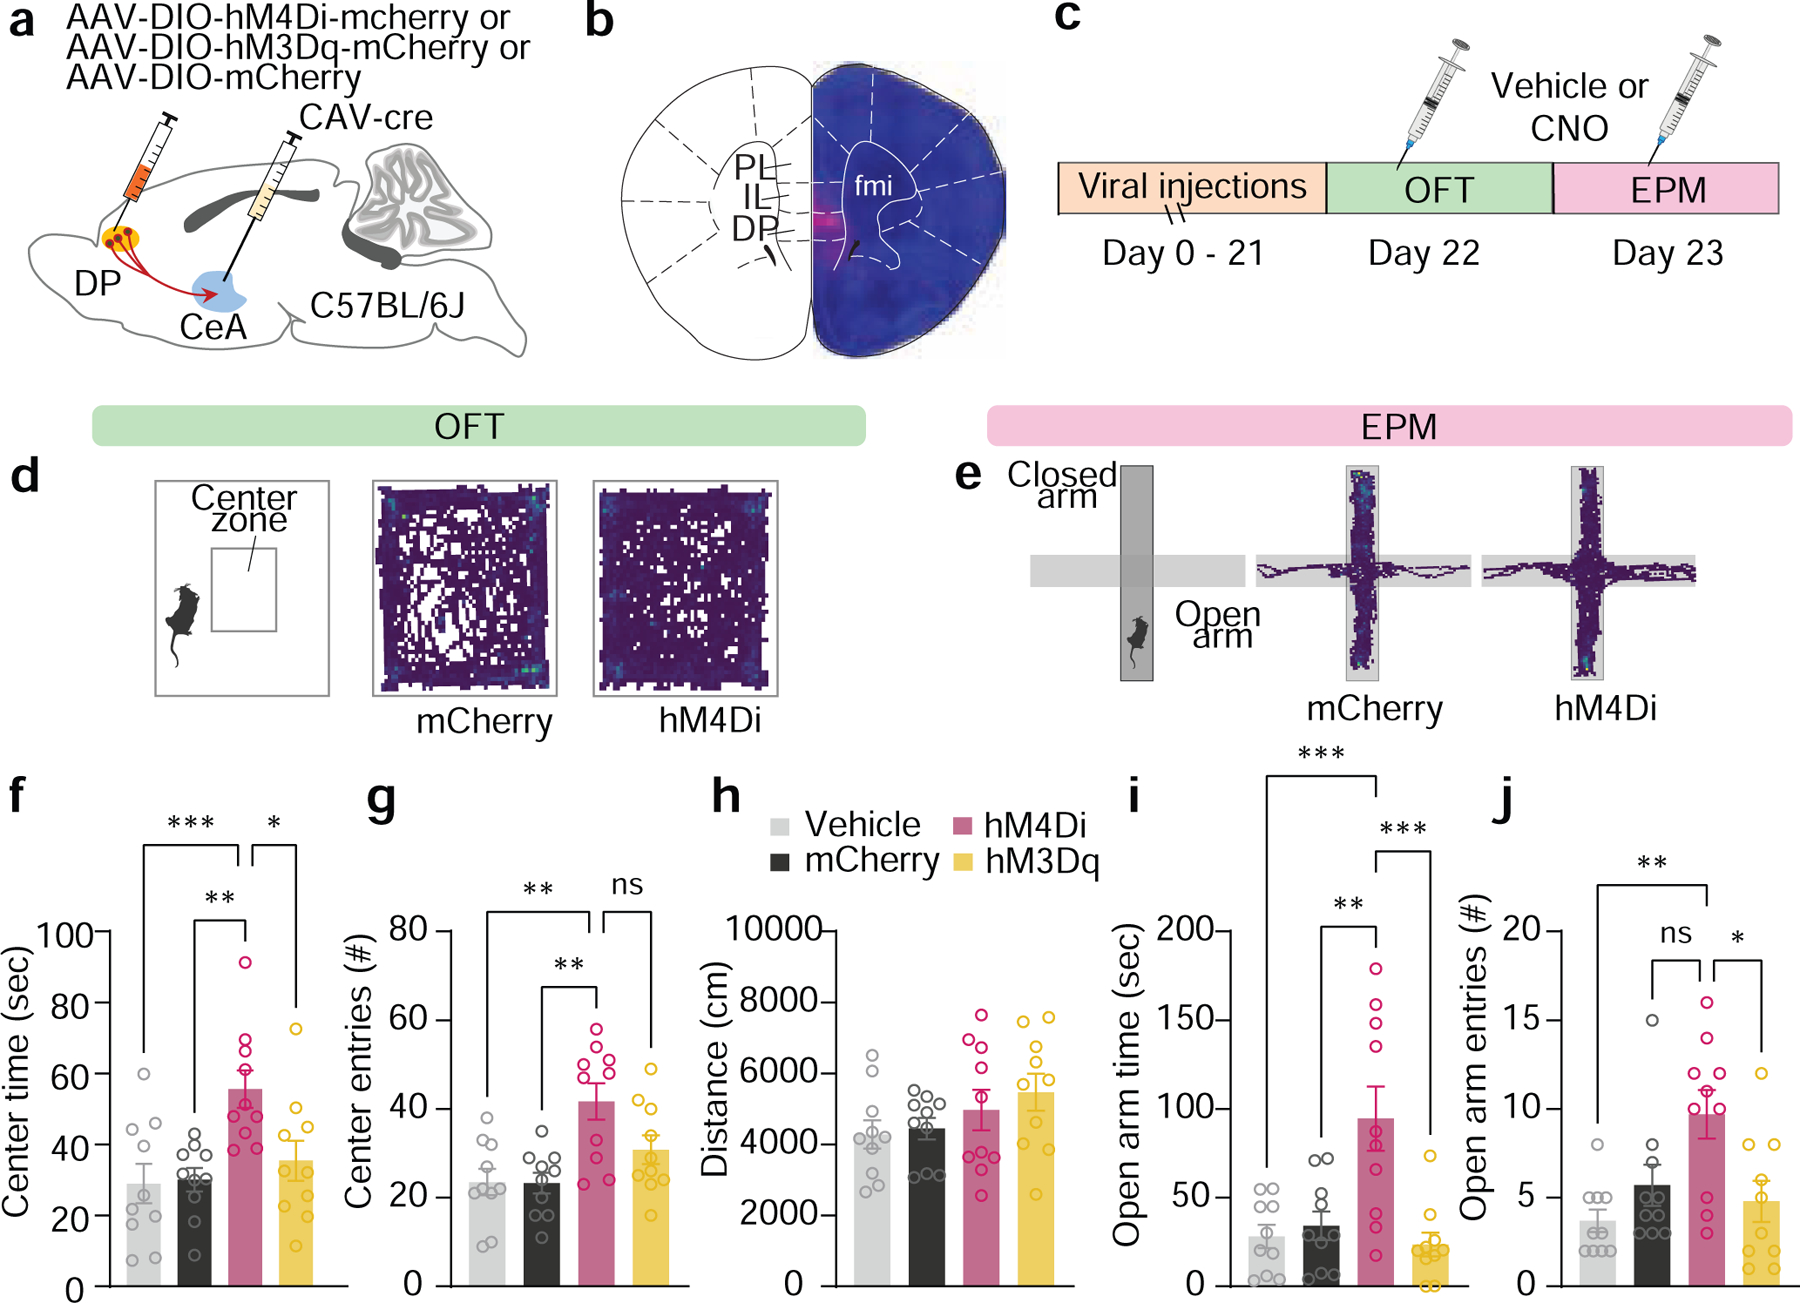
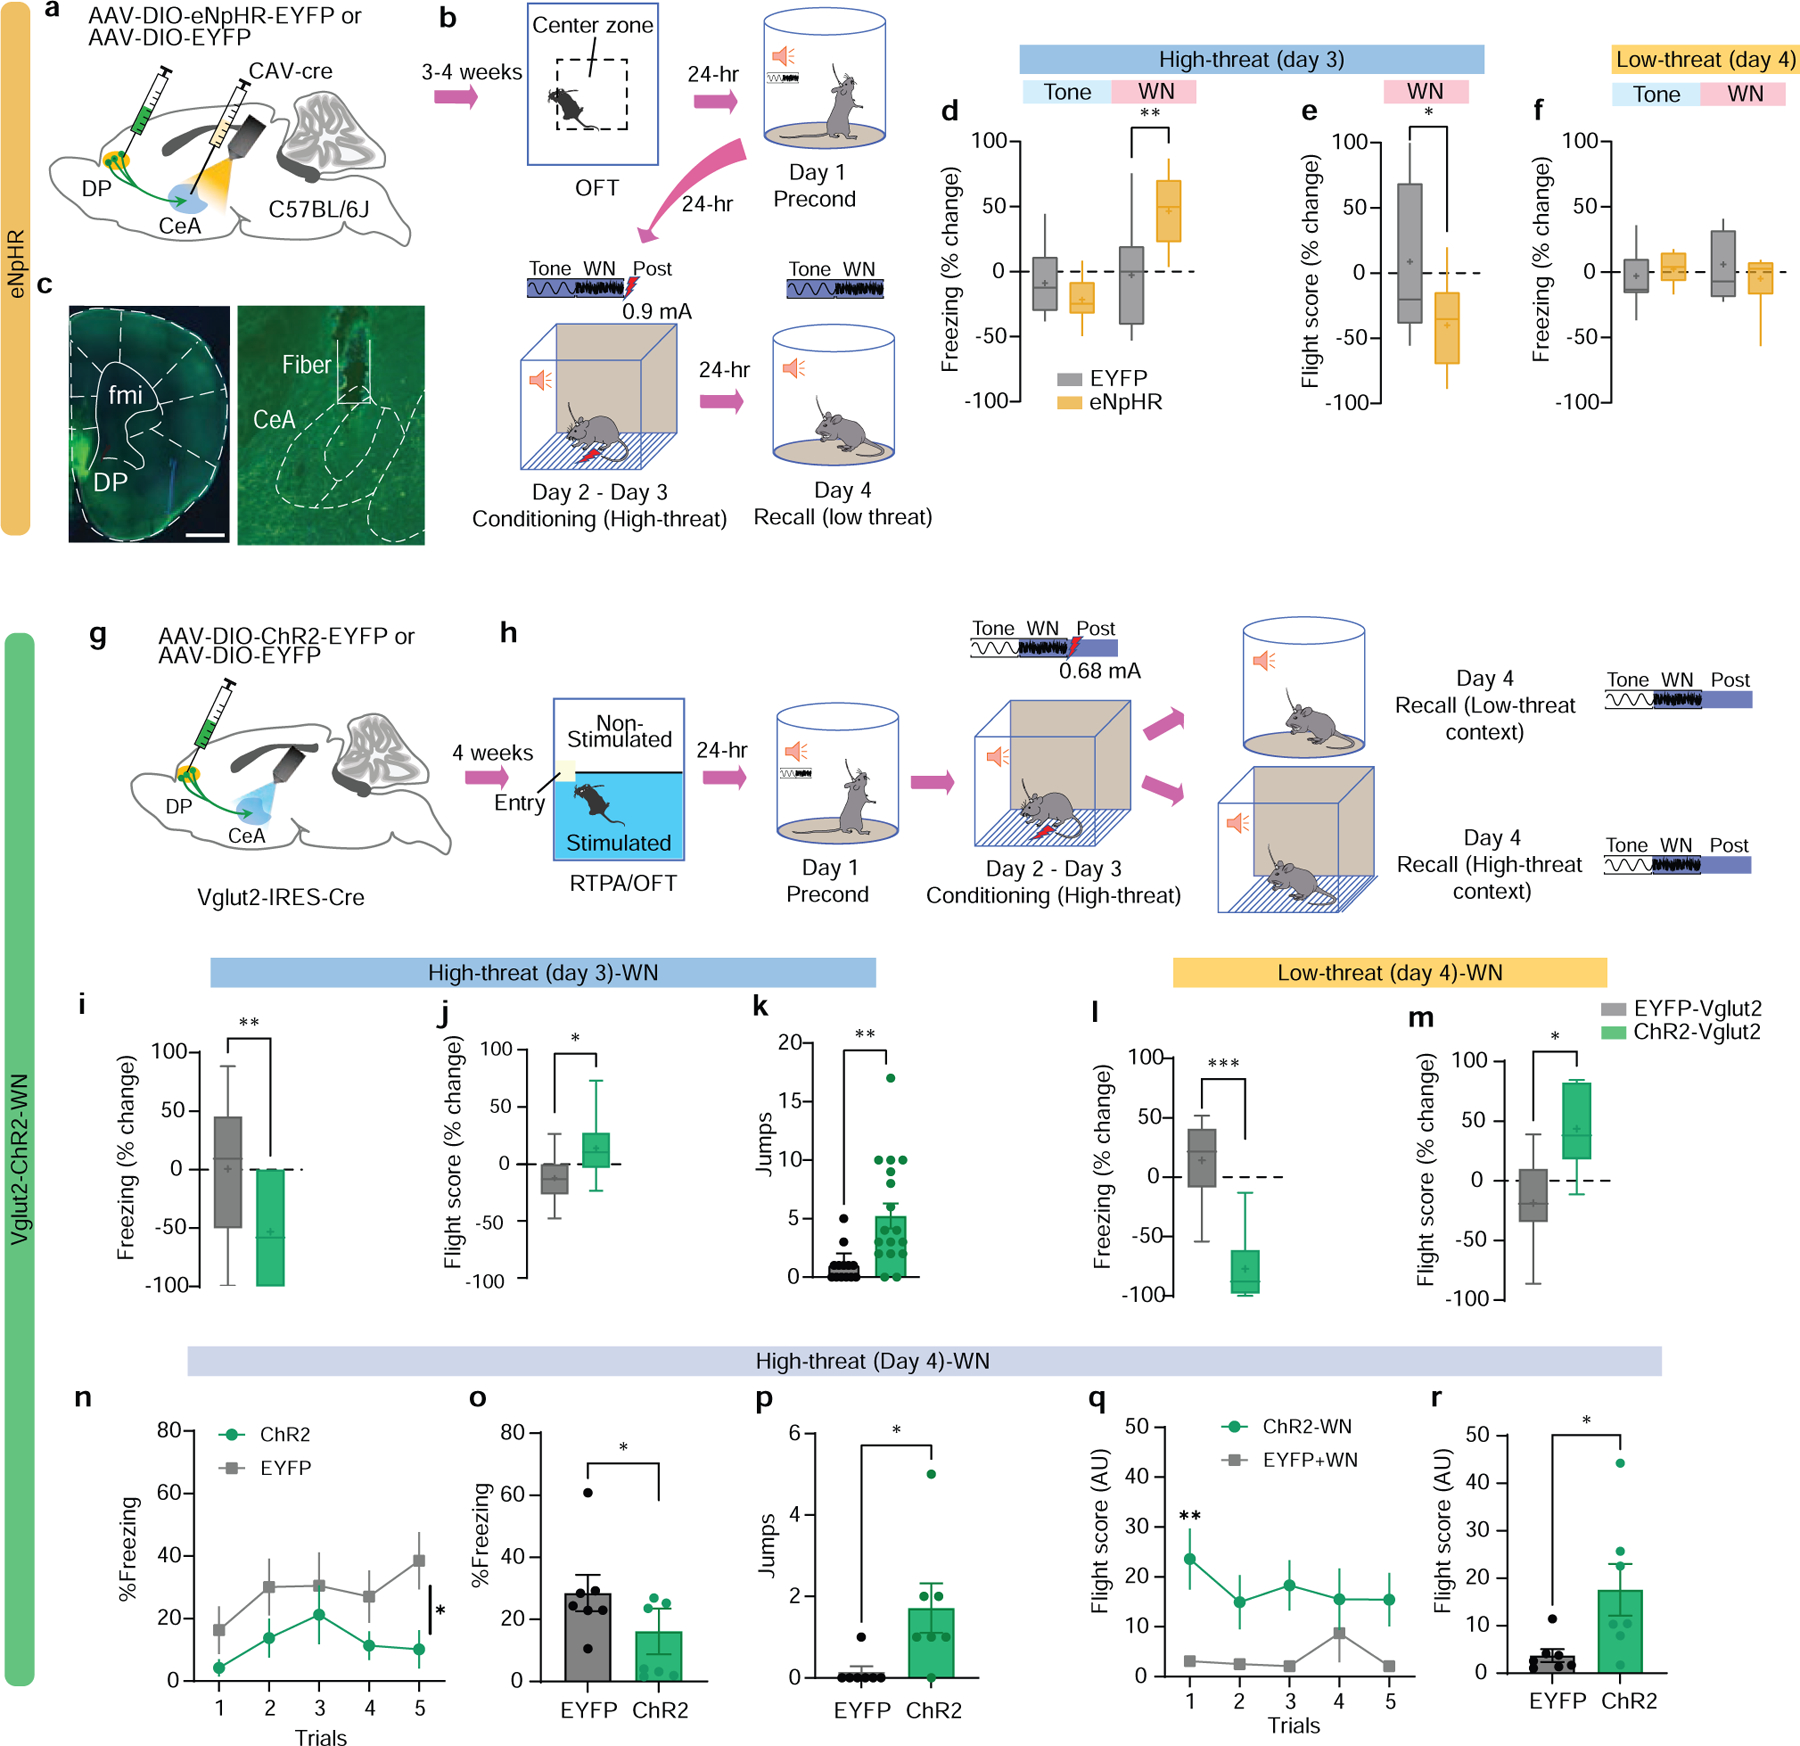
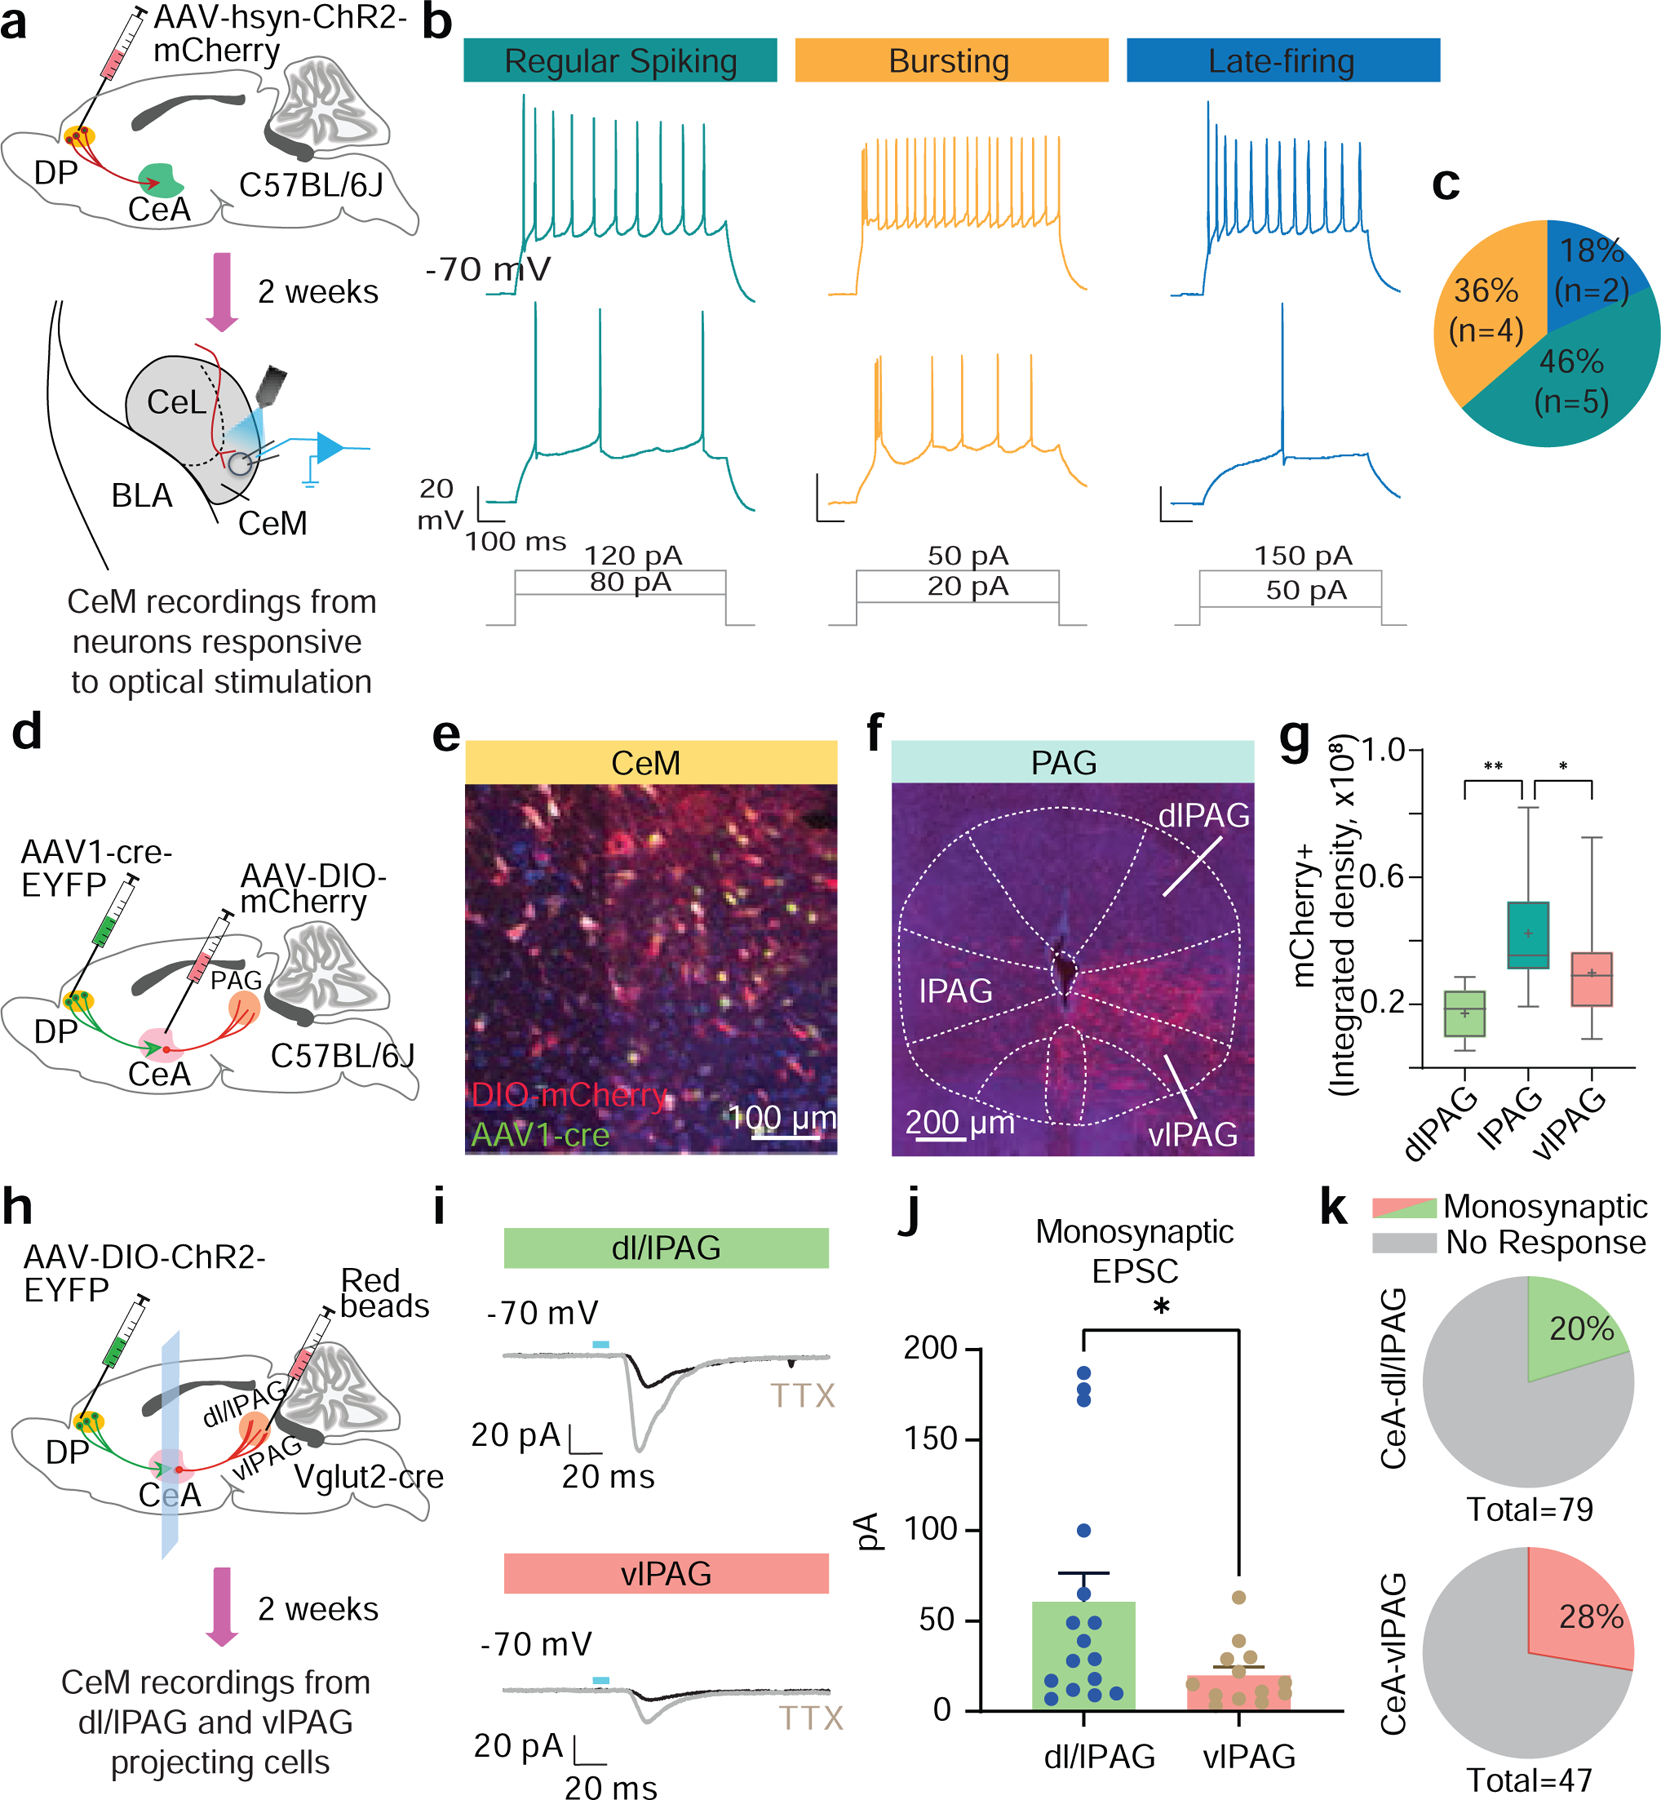
Survival requires the selection of appropriate behaviour in response to threats, and dysregulated defensive reactions are associated with psychiatric illnesses such as post-traumatic stress and panic disorder1. Threat-induced behaviours, including freezing and flight, are controlled by neuronal circuits in the central amygdala (CeA)2; however, the source of neuronal excitation of the CeA that contributes to high-intensity defensive responses is unknown. Here we used a combination of neuroanatomical mapping, in vivo calcium imaging, functional manipulations and electrophysiology to characterize a previously unknown projection from the dorsal peduncular (DP) prefrontal cortex to the CeA. DP-to-CeA neurons are glutamatergic and specifically target the medial CeA, the main amygdalar output nucleus mediating conditioned responses to threat. Using a behavioural paradigm that elicits both conditioned freezing and flight, we found that CeA-projecting DP neurons are activated by high-intensity threats in a context-dependent manner. Functional manipulations revealed that the DP-to-CeA pathway is necessary and sufficient for both avoidance behaviour and flight. Furthermore, we found that DP neurons synapse onto neurons within the medial CeA that project to midbrain flight centres. These results elucidate a non-canonical top-down pathway regulating defensive responses.


Figures

Extended data Figure 1(Data related to Figure 1):
Extended data Figure 1(Data related to Figure 1):. Neuroanatomy of the DP-CeA pathway
a, Top, Number of CeA-projecting mPFC cells across the antero-posterior axis. Bottom, Schematic of coronal sections showing the density of beads in DP on anterio-posterior scale. b, The layer-wise distribution of bead+ cells in the DP that project to CeA and/or DMH (N = 6 mice; two-way ANOVA, layer x group, F(4, 45) = 10.15, p < 0.0001; Bonferroni’s post-hoc test, *p<0.05, *** p <0.001 (DMH vs CeA), ##p <0.01, ###p <0.001 (vs overlay). c, Total number of bead+ cells across groups (N = 6 mice per group; 3–4 slices per group; one-way ANOVA, F(3, 22) = 2.819, p = 0.0626). d, Freezing of cFos groups on FC2 (N = 6 mice per group; one-way ANOVA for tone (F(2, 15) = 9.367, p = 0.0023) and white noise (WN; F(2, 15) = 22.68, p < 0.0001); Bonferroni’s post-hoc test). e, Flight scores of cFos groups on FC2 (N = 6 mice per group; one-way ANOVA for tone (F(2, 15) = 3.60, p = 0.052) and WN (F(2, 15) = 18.52, p < 0.0001); Bonferroni’s post-hoc test). Data in b-e represented as means ± s.e.m. Two-sided statistical tests were used. ***P < 0.001, **P < 0.01.
Extended data Figure 2 (Data related to Figure 2):
Extended data Figure 2 (Data related to Figure 2):. Calcium imaging during pre-conditioning
a-b, Trial-wise and average freezing of mice from calcium imaging experiments during preconditioning session (N = 6 mice; paired t-test, t=0.3051, df=5, p = 0.77). c-d, Trial-wise and average flight score of mice from calcium imaging experiments during preconditioning session (N = 6 mice; paired t-test, t=0.6565, df=5, p = 0.54). e, Speed and neuronal activity during the last trial of preconditioning session (n = 221 cells from 6 mice). f, Average speed and neuronal activity during each trial of preSCS, tone, WN and post-cue periods (n = 221 cells from 6 mice). g, Spearman correlation of speed and neuronal activity from all trials (10 sec each epoch of preSCS, tone, WN and post cue, each point represents one sec; n = 221 cells from 6 mice; r = −0.1232, 95% CI: −0.2774 to 0.03724, p = 0.12). h, Average Z-score of the DP-to-CeA population during the preSCS, tone, WN and post-cue periods (n = 221 cells from 6 mice; ordinary one-way ANOVA, F(3, 20) = 1.965, p = 0.15). i, Average Z-scores of individual mice during preSCS, tone, WN and post-cue periods (N = 6 mice). j, Z-scores of individual neurons during the last trial of preconditioning (n = 221 cells from 6 mice, one-way ANOVA, F(3, 880) = 21.43, P<0.0001; Bonferroni’s multiple comparisons test). Data in a-f and j represented as means ± s.e.m. Violin plots in h indicate median, interquartile range, and the distribution of individual data points. Two-sided statistical tests were used. ****p<0.0001
Extended data Figure 3 (Data related to Figure 2):
Extended data Figure 3 (Data related to Figure 2):. Calcium imaging in the high-threat and low-threat contexts.
a, Freezing behaviour in the high-threat context (N = 6 mice; paired t-test, t=4.744, df=5). b, Flight scores in the high-threat context. (N = 6 mice; paired t-test, t=3.650, df=5). c, left, Average speed and neuronal activity during each trial of the preSCS, tone, WN and post-cue periods in the high-threat context (n = 273 cells from 6 mice). right, Spearman correlation of speed and neuronal activity from the last 3 trials (preSCS, tone, WN and post-cue epochs, each point represents data from 1 sec; n = 273 cells from 6 mice; r = 0.5187, 95% CI: 0.3696 to 0.6417, p<0.0001). d, Speed and neuronal activity aligned to the onset of flight bouts during WN in the high-threat context (n = 273 cells from 6 mice). e, Speed and neuronal activity aligned to the onset of freezing bouts during WN in the high-threat context (n = 273 cells from 6 mice). f, Spearman correlation plot for speed and Z-score from the identified freezing bouts (each dot represents values at each sec of the bouts, r = 0.657, 95% CI = −0.02019 to 0.1662, p = 0.175). g, left Z-scores of individual mice during preSCS, tone, WN and post-cue periods, across all trials (N = 6 mice; one-way ANOVA, F(3, 20) = 9.331, P=0.0005; Bonferroni’s multiple comparisons test). right, Z-scores of individual mice during first versus last 2 footshock periods (paired t-test, t=0.2289, df=11, each dot represents an individual mouse during a single trial). h, The Z-scores of individual neurons during preSCS, tone, WN and post-cue periods, from the last trial in the high-threat context (n = 273 cells from 6 mice, one-way ANOVA, F(3, 1112) = 59.01, P<0.0001; Bonferroni’s multiple comparisons test). i, Freezing in the low-threat context (N = 6 mice; paired t-test, t=3.424, df=5). j, Flight scores in the low-threat context. (N = 6 mice; paired t-test, t=2.889, df=5). k, left, Change in average speed and neuronal activity during preSCS, tone, WN and post-cue periods in the low-threat context over 4 trials (n = 273 cells from 6 mice). right, Spearman correlation of speed and neuronal activity from all recall trials in the low-threat context (preSCS, tone, WN and post cue epochs, each point represents 1 sec of data; n = 273 cells from 6 mice; r = −0.07152, 95% CI: −0.2526 to 0.1144, p = 0.43). l, Speed and neuronal activity aligned to the onset of flight bouts during WN in the low-threat context (n = 273 cells from 6 mice). m, Speed and neuronal activity aligned to the onset of freezing bouts during WN in the low-threat context (n = 273 cells from 6 mice). n, Spearman correlation of speed and neuronal activity from freezing bouts (n = 273 cells from 6 mice; each point represents one sec of data, r = 0.82, 95% CI = 0.02337 to 0.1669, P = 0.058). o, Population activity from individual mice during preSCS, tone, WN and post-cue periods, across all trials (N = 6 mice; one-way ANOVA, F(3,20) = 0.3923, P = 0.75). p, Neuronal activity of individual neurons during preSCS, tone, WN and post-cue periods, from the last trial in the low-threat context (n = 273 cells from 6 mice; one-way ANOVA, F(3,1008) = 5.566, P = 0.0009; Bonferroni’s multiple comparisons test). q, Z-scores of individual mice during context exposure (first 3 min baseline period) in high threat versus low-threat context (N = 6 mice; paired t-test, t=2.705, df=5). Data in a-c, d-e, h-k, l-m, and p represented as means ± s.e.m. Violin plots in g indicate median, interquartile range, and the distribution of individual data points. Two-sided statistical tests were used. ****P<0.0001, ***P < 0.001, **P < 0.01, *P < 0.05.
Extended data Figure 4 (Data related figure 4):
Extended data Figure 4 (Data related figure 4):. Optogenetic inhibition of the DP-CEA pathway
a, Intersectional approach used for optogenetic terminal inhibition of the DP-to-CeA neuronal projections. b, Experimental timeline. c-e, Effect of optogenetic inhibition on centre time (c), centre entries (d), and distance travelled (e) in the OFT (EYFP N = 9 mice, eNpHR N = 9 mice; unpaired t-test, t=2.357, df=16; t=2.813, df=16; and t=0.7250, df=16, respectively). f-h, Effect of optogenetic inhibition on EYFP (N = 9) and eNpHR (N = 9) mice in the high-threat context on f, freezing (LED-on vs LED-off, Mann-Whitney), g, flight (LED-on vs LED-off, Mann-Whitney), and h, speed during WN (Paired t-test t=3.497, df=8, p = 0.0081). i-k, Effect of optogenetic inhibition in EYFP (N = 9) and eNpHR (N = 9) groups in the low-threat context on i, freezing (LED-on vs LED-off, Mann-Whitney, n.s.), j, flight (LED-on vs LED-off, Mann-Whitney) and k, speed during WN in the eNpHR group (Paired t-test, t=2.619, df=8, p = 0.307). Data in c-e represented as mean ± s.e.m. Data in f-k represented as mean with individual data points. Two-sided statistical tests were used. **P < 0.01, *P < 0.05.
Extended data Figure 5 (Data related figure 4):
Extended data Figure 5 (Data related figure 4):. Non-cell type specific stimulation of the DP-CEA pathway
a, Intersectional approach used to target optogenetic stimulation to DP-to-CeA terminals. b-c, Effect of optogenetic stimulation on OFT centre time (b) and centre entries (c) in EYFP (N = 10) and ChR2 (N = 9) groups (Unpaired t-test, n.s., t=0.3950, df=17, and t=1.001, df=17, respectively). d, Effects of optogenetic stimulation on real-time place avoidance in EYFP (10 Hz, N = 5) and ChR2 (10 Hz, N = 5; 20 Hz, N = 4) groups (One-way ANOVA F(2, 11) = 0.73, p = 0.502). e-f, Effect of optogenetic excitation in EYFP (N = 10) and ChR2 (N = 9) groups in the high-threat context on e, freezing (LED-on vs LED-off, Mann-Whitney, n.s.) and f, flight (LED-on vs LED-off, Mann-Whitney, n.s.). g-h, Effect of optogenetic excitation in EYFP (N = 10) and ChR2 (N = 9) groups in the low-threat context on g, freezing (LED-on vs LED-off, Mann-Whitney, n.s.) and h, flight (LED-on vs LED-off, Mann-Whitney, n.s.). i-j, Freezing (i) and flight scores (j) during optogenetic stimulation during day 3 at different stimulation frequencies and shock intensities (at 0.6 mA – 10 Hz, N = 9; 15 Hz, N = 3; at 0.9 mA – 20 Hz, N = 5; two-way ANOVA (for % freezing, Stimulation frequency x Shock intensity, F(6, 56) = 0.76, p = 0.601, Stimulation frequency, F(2, 56) = 1.10, p = 0.339, Shock intensity, F(3, 56) = 8.37, p = 0.0001; for flight, Stimulation frequency x Shock intensity, F(6, 56) = 4.42, p = 0.001, Shock intensity, F(3, 56) = 6.66, p = 0.001; Bonferroni’s post hoc test (tone/WN ON vs OFF non-significant). Data represented as mean (± s.e.m. in b-d and with individual data points in i-j). Two-sided statistical tests were used.
Extended data Figure 6 (Data related figure 4):
Extended data Figure 6 (Data related figure 4):. Stimulation of the DP-CEA pathway using a CaMKII promotor
a, Viral injection strategy for optogenetic terminal stimulation of DP-to-CeA neuronal projections. b-c, Schematic (b) and results (c) of real-time place aversion (RTPA) in EYFP (20 Hz, N = 5) and ChR2 (20 Hz, N = 5) groups (Unpaired t-test, t=3.191, df=8). d-e, Effect of optogenetic excitation in EYFP (N = 5) and ChR2 (N = 5) groups in the high-threat context on d, freezing (LED-on vs LED-off, paired t-test, n.s.) and e, flight scores (LED-on vs LED-off, paired t-test, n.s.). f-g, Effect of optogenetic excitation in EYFP (N = 5) and ChR2 (N = 5) groups in the low-threat context on f, freezing (LED-on vs LED-off, paired t-test, n.s.) and g, flight scores (LED-on vs LED-off, paired t-test, n.s.). Data represented as mean ± s.e.m. in c and with individual data points in d-g. Two-sided statistical tests were used. *P < 0.05
Extended data Figure 7 (Data related figure 4):
Extended data Figure 7 (Data related figure 4):. Optogenetic stimulation of the Vglut1+ DP-CEA pathway
a, Viral injection strategy for optogenetic terminal stimulation of DP-to-CeA neuronal projections. b-c, Schematic (b) and real-time place aversion (RTPA) performance (c) from EYFP (N=6) and ChR2 (N=8) groups (unpaired t-test, EYFP (t=1.974, df=5, P =0.10), ChR2 (t=7.339, df=7). d-e, Effect of optogenetic excitation in EYFP (N = 6) and ChR2 (N = 8) groups in the high-threat context on d, freezing during WN (LED-on vs LED-off, paired t-test, ChR2, t=3.650, df=7) and e, flight during WN (LED-on vs LED-off, paired t-test, ChR2, t=1.077, df=7, P =0.31). f-g, Effect of optogenetic excitation in EYFP (N = 6) and ChR2 (N = 8) groups in the low-threat context on f, freezing during WN (LED-on vs LED-off, paired t-test, ChR2, t=3.748, df=7) and g, flight score during WN (LED-on vs LED-off, paired t-test, ChR2, t=2.211, df=7, P =0.06). h, Example fibre placements over the CeA for the eNpHR groups (N = 9). I, Example fibre placements over the CeA for the ChR2 groups (N = 9). Box and whisker plots in c indicate median, interquartile range, and min. to max. of the distribution, crosses indicate means. Data in d-g represented as mean with individual data points. Two-sided statistical tests were used. ***P < 0.001, **P < 0.01.
Extended data Figure 8 (Data related figure 4):
Extended data Figure 8 (Data related figure 4):. Optogenetic stimulation of the Vglut2+ DP-CEA pathway
a, Viral injection strategy for optogenetic terminal stimulation of DP-to-CeA neuronal projections). b, Experimental timeline. c, Real-time place aversion (RTPA) performance of EYFP (N=13) and ChR2 (N=17) groups (paired t-test, EYFP (t=0.2167, df=12, P =0.83), ChR2 (t=4.713, df=17). d-e, Effect of optogenetic excitation on OFT centre time (d) and number of entries into the centre zoneI) in EYFP (N=11) and ChR2 (N=10) groups (unpaired t-test, t=3.288, df=19). f-g, Effect of optogenetic excitation in EYFP (N = 13) and ChR2 (N = 17) groups in the high-threat context on f, freezing during WN (LED-on vs LED-off, Wilcoxon matched-pairs signed rank test, ChR2) and g, flight during WN (LED-on vs LED-off, Wilcoxon -test, ChR2, P = 0.07). h, Comparison of flight scores in the LED-on condition between EYFP control and ChR2 groups (Mann Whitney test, P = 0. 0.0349). i-j, Effect of optogenetic excitation in EYFP (N = 6) and ChR2 (N = 10) groups in the low-threat context on i, freezing during WN (LED-on vs LED-off, paired t-test, ChR2, t=7.135, df=9) and j, flight scores during WN (LED-on vs LED-off, paired t-test, ChR2, t=t=2.717, df=9). Box and whisker plots in c indicate median, interquartile range, and min. to max. of the distribution, crosses indicate means. Data in d-e and h represented as mean ± s.e.m, and as mean with individual data points in f,g,i,j. Two-sided statistical tests were used. ***P < 0.001, **P < 0.01, *P < 0.05.
Extended data Figure 9: (Data related to Figure 5):
Extended data Figure 9: (Data related to Figure 5):. Optogenetically evoked responses in central amygdala neurons
a, Schematic of targeting strategy. b, DP terminals in CeM near SOM+ (left) and CRH+ (right) cells at 20x and 40x magnification. c, Strategy for recording light-evoked synaptic input from DP to SOM+ or CRH+ neurons from CeM (top) and CeL (bottom) regions. d, Representative evoked synaptic responses in CeM SOM+ and CRH+ cells by photostimulation of DP axonal fibres in voltage-clamp. e, Photostimulation of axonal fibres did not evoke responses in CeL neurons. f, Average amplitude of evoked EPSCs in CRH+ neurons (N = 10 cells from 3 mice) and SOM+ (N = 13 cells from 3 mice) at −70mV (unpaired Student’s t-test, t=0.4879, df=21, p = 0.63). g, Amplitudes of evoked EPSCs in CRH+ (N = 4 cells from 3 mice) and SOM+ (N = 3 cells from 2 mice) neurons at −70 mV, before and after application of DNQX. h, Average amplitude of evoked EPSCs in CeM (N = 23 cells from 6 mice) and CeL neurons (N = 5 cells from 2 mice). i, The amplitude of disynaptic IPSCs evoked by ChR2 stimulation of DP terminals in CRH+ (N = 7 cells from 3 mice) and SOM+ (N = 11 cells from 2 mice; unpaired Student’s t-test, t(16)= 0.055; p = 0.96) neurons at –50 mV. j, The firing properties of DP-targeted CeM neurons. Data in f,h,i represented as mean ± s.e.m. Two-sided statistical tests were used. ***P < 0.001, **P < 0.01, *P < 0.05.
Extended data Figure 10 (Data related to Figure 5):
Extended data Figure 10 (Data related to Figure 5):. Brain regions targeted by CeM neurons receiving DP innervation
a, Representative image showing ChR2 injection targeting in the DP. b-c, Representative images showing targeting of red beads to the b, dorsal (dl/l PAG) and c, ventrolateral (vlPAG) periaqueductal gray regions for electrophysiological recordings of PAG-projecting CeM neurons. d, Representative expression of EYFP in the DP of a C57BL/6J mouse injected with AAV1-cre-EYFP. e, Cre-dependent mCherry expression in the CeM of the same mouse. f-l, mCherry+ terminals of CeM neurons innervated by the DP project to insular cortex (f), nucleus accumbens (Acb, g), substantia innominata (SI, h), periventricular thalamus (PVT, i), lateral hypothalamus (LH, j), ventral tegmental area (VTA, k), and retrorubral field (RRF, l).
Figure 1.
Figure 1.. Neuroanatomical characterization of the DP-to-CeA pathway.
a, Retrograde tracing strategy. b, Representative targeting of red beads in the CeA. c, Representative bead localization in the mPFC (left, 5x, right, 10x). d, Top, Significantly more CeA-projecting neurons are localized in the DP, compared to the IL or PL (One-way ANOVA, F(2,15) = 21.86, p < 0.0001; Bonferroni’s post-hoc test; N = 6 mice). Bottom, Distribution of CeA-projecting neurons along the mPFC antero-posterior axis (N = 6 mice; 4–6 sections/mouse). DP, dorsal peduncular cortex; IL, infralimbic cortex; PL, prelimbic cortex. e, Anterograde tracing strategy. f, Representative image of DP targeting in Vglut1-Cre mice. g, Representative image of DP targeting in Vglut2-Cre mice. h, Representative expression of mCherry+ terminals in the CeA of a VGlut1-Cre mouse. i, Representative expression of mCherry+ terminals in the CeA of a VGlut2-Cre mouse. j, Density of mCherry+ fibres from Vglut1+ (N = 5 mice, 3–4 sections/mouse) and Vglut2+ (N = 6 mice, 2–3 sections/mouse) neurons (unpaired t-test for total CeA, t = 8.89, df = 9, p < 0.0001. Two-way ANOVA, CeM vs CeL, strain X region, F(2,27) = 14.90, p < 0.0001; Bonferroni’s post-hoc test). CeL includes lateral and capsular subregions. k, Dual-target retrograde tracing strategy from CeA and dorsomedial hypothalamus (DMH). l, Representative targeting of CeA. m, Representative targeting of DMH. n, Deposition of green and red beads in the mPFC. Inset, distribution of CeA and DMH projectors in different layers of DP. Red, green, and yellow arrowheads indicate red beads, green beads, and overlay, respectively. o, Number of DP neurons projecting to CeA, DMH, or both (One-way ANOVA, F(2,15) = 62.06, p = 0.0001; Bonferroni’s post-hoc test; N = 6 mice, 3 sections/mouse). p, Strategy for neuronal activation analysis. q, Representative images showing bead+ and/or cFos+ cells in the DP. Left, 10x and Right, 20x. Red arrow, bead+; yellow arrow, bead and cFos+. r, cFos expression in bead+ cells (N = 6 mice for shock only and unpaired, N = 7 mice for cage control and SCS-FC groups; 3–4 sections/mouse; One-way ANOVA, F(3,22) = 22.01, p < 0.0001; Bonferroni’s post-hoc test). Data in d, j, o, r represented as means ± s.e.m. Two-sided statistical tests were used. ****P < 0.0001, ***P < 0.001, **P < 0.01, *P < 0.05.
Figure 2:
Figure 2:. DP-to-CeA projecting cells are activated by high fear states.
a, Intersectional strategy used to record DP-to-CeA projector activity (N = 6 mice for all panels). b, Mice were subjected to a paradigm designed to elicit conditioned freezing and flight. c, Left, Representative GCaMP6f expression and lens placement (scale bar = 500 μm). Right, miniscope field-of-view (raw and post cell extraction). d, Freezing to cues in the high-threat context. (N = 6 mice; two-way ANOVA, Trial x Stimuli, F(4, 20) = 4.354, p = 0.01, followed by Bonferroni’s post-hoc test). e, Cue-induced flight in the high-threat context. (N = 6 mice; two-way ANOVA, Trial x Stimuli, F(4, 20) = 2.08, p = 0.12, Stimuli, F(1, 5) = 13.49, p = 0.014, Trial, F(4, 20) = 0.933, p = 0.46). f, Population activity and speed from the last trial in the high-threat context (n = 273 cells). g, Neuronal activity of individual neurons during the last trial in the high-threat context (n = 273 cells). h, Percentages of neurons activated during different cue periods in the high-threat context. i, Average neuronal activity from all trials in the high-threat context (n = 273 cells; one-way ANOVA, F(3,20) = 9.33, p = 0.005; Bonferroni’s post-hoc test). j, Neuronal activity aligned at onset of freezing and flight in the high-threat context (n = 273 cells). k, Population activity 3 s before and after the onset of freezing and flight (n = 273 cells; paired t-test flight-WN, t=3.28, df=5; Mann-Whitney test, flight-shock; paired t-test freezing-WN, t=1.778, df=5, p=0.13). l, Spearman correlation of neuronal activity and speed aligned to WN-induced flight bouts (n = 273 cells; r = 0.94, 95% CI = 0.003864 to 0.1503, each point = 1 sec). m, Freezing to cues in the low-threat context (N = 6 mice; two-way ANOVA, Trial x Stimuli, F(3, 15) = 0.5806, p = 0.63, Stimuli, F(1, 5) = 11.73, p = 0.018, Trial, F(3, 15) = 0.83, p = 0.490. n, Cue-induced flight in the low-threat context (N = 6 mice; Two-way ANOVA, Trial x Stimuli, F(3, 15) = 1.58, p = 0.23, Stimuli, F(1, 5) = 8.12, p = 0.035, Trial, F(3, 15) = 1.42, p = 0.27). o, Population activity and speed from the last trial in the low-threat context (n = 176 cells). p, Neuronal activity of individual neurons during the last trial in the low-threat context (n = 176 cells). q, Percentages of neurons activated during different cue periods in the low-threat context. r, Average neuronal activity from all trials in the low-threat context (n = 176 cells; one-way ANOVA, effect of stimuli F(3,20) = 0.39, p = 0.75). s, Neuronal activity aligned to the onset of WN-induced freezing and flight in the low-threat context (n = 176 cells). t, Population activity 3 s before and after the onset of freezing and flight (n = 176 cells; paired t-test flight-WN, t=2.58, df=5; flight-post, t=0.8493, df=5, p = 0.43; freezing-WN, t=0.8493, df=5, p=0.43). u, Spearman correlation of neuronal activity and speed aligned to WN-induced flight bouts (n = 176 cells; r = 0.94, 95% CI = 0.04251 to 0.2010. Each point = 1 sec). Data in d-f, j, m-o, s represented as means ± s.e.m. Violin plots in i, k, r, t indicate median, interquartile range, and the distribution of individual data points. Two-sided statistical tests were used. ***P < 0.001, **P < 0.01, *P < 0.05.
Figure 3:
Figure 3:. Chemogenetic inhibition of DP-to-CeA pathway reduces avoidance.
a, Intersectional strategy used for chemogenetic manipulation of the DP-to-CeA pathway. b, Representative mCherry expression in the DP (scalebar = 500 μm). c, Mice from control (DREADD + vehicle, N = 10; mCherry + CNO, N = 10 for f-j) and DREADD groups (hM4Di-mCherry, N = 10; hM3Dq-mCherry, N = 10 for f-j) were subjected to the OFT and EPM 30 min after CNO (5 mg/kg) or vehicle injection. d, Representative OFT activity plots of mCherry + CNO and hM4Di + CNO mice. e, Representative EPM activity plots of mCherry + CNO and hM4Di + CNO mice. f, Inhibition of the DP-to-CeA pathway significantly increased time spent in the centre zone (One-way ANOVA, F(3,36) = 6.06, p = 0.001; Bonferroni’s post-hoc test). g, Inhibition of the DP-to-CeA pathway significantly increased the number of entries in the centre zone (One-way ANOVA, F(3,36) = 7.158, p = 0.0007; Bonferroni’s post-hoc test). h, DREADD manipulations did not alter distance travelled in the OFT (One-way ANOVA, F(3,36) = 1.36, p = 0.270). i, Inhibition of the DP-to-CeA pathway significantly increased open-arm time in the EPM (One-way ANOVA, F(3,36) = 9.22, p = 0.0001; Bonferroni’s post-hoc test). j, Inhibition of the DP-to-CeA pathway significantly increased open-arm entries in the EPM (One-way ANOVA, F(3,36) = 5.47, p = 0.003; Bonferroni’s post-hoc test). Data in f-j represented as mean ± s.e.m. Two-sided statistical tests were used. ***P < 0.001, **P < 0.01, *P < 0.05.
Figure 4.
Figure 4.. Optogenetic modulation of the DP-to-CeA pathway regulates flight.
a, Intersectional targeting strategy for optogenetic inhibition of the DP-to-CeA pathway. b, Experimental timeline for optogenetic inhibition experiments. c, Representative images of eNpHR-EYFP expression in DP and fibre stub placement in CeA (scalebar = 500 μm). d-e, Effect of optogenetic inhibition in EYFP (N = 9) and eNpHR (N = 9) groups on d, freezing (LED-on vs LED-off) in the high-threat context (EYFP vs eNpHR, unpaired t-test) and e, flight scores (LED-on vs LED-off) in the high-threat context (EYFP vs eNpHR, unpaired t-test). f, Effect of optogenetic inhibition in EYFP (N = 9) and eNpHR (N = 9) groups on freezing (LED-on vs LED-off) in the low-threat context (EYFP vs eNpHR, Mann-Whitney, n.s.). g, Viral injection strategy for optogenetic stimulation of the DP-to-CeA pathway. h, Experimental timeline for optogenetic stimulation experiments. i-k, Effect of optogenetic stimulation in EYFP (N = 13) or ChR2 (N = 17) groups on i, freezing (LED-on vs LED-off; Mann-Whitney), j, flight scores (LED-on vs LED-off; unpaired t-test, t=2.262, df=28), and k, escape jumps (Unpaired t-test, t=3.383, df=28) in the high-threat context. l-m, Effect of optogenetic stimulation in EYFP (N = 6) and Vglut2-ChR2 (N = 10) groups on l, freezing (LED-on vs LED-off; unpaired t-test, t=5.046, df=14) and m, flight scores (LED-on vs LED-off; unpaired t-test, t=2.845, df=14) in the low-threat context. n-r, Effects of optogenetic stimulation in EYFP (N = 7) and Vglut2-ChR2 (N = 7) groups during recall in the high-threat context on n, Trial-wise freezing (two-way ANOVA, Group x trial, F(4, 48) = 0.644, P=0.633, main effect of Group, F (1,12) = 4.874, P=0.0475), o, Average freezing (unpaired t-test, t=2.208, df=12), p, Escape jumps (unpaired t-test, t=2.524, df=12), q, Trial-wise flight scores (two-way ANOVA, Trial x Group, F(4, 48) = 2.738, P=0.0393; Bonferroni’s multiple comparisons test), and r, Average flight scores (unpaired t-test, t=2.462, df=12). Box and whisker plots in d-f, i-j, l-m indicate median, interquartile range, and min. to max. of the distribution, crosses indicate means. Data in k, n-r represented as mean ± s.e.m. Two-sided statistical tests were used. ***P < 0.001, **P < 0.01, *P < 0.05.
Figure 5.
Figure 5.. DP-to-CeA neurons exert excitatory control over CeM projections.
a, Injection targeting and recording strategy. b, Representative firing patterns evoked by depolarizing current injection in CeM neurons innervated by DP projections. DP innervation was confirmed by postsynaptic responses to optogenetic stimulation of ChR2+ axons in CeM (data not shown). c, Proportion of DP-excited CeM neurons classified by firing patterns (N = 11 cells from 4 mice). d, Viral targeting strategy used to map the PAG-projecting CeM neurons innervated by DP. e, Representative image showing expression of EYFP (green) and mCherry (red) in the CeM. f, Representative image showing mCherry+ terminals in PAG subregions. g, Morphometric analysis showing that lPAG contains significantly greater mCherry+ terminals (N = 3 mice; RM one way-ANOVA, F(2,36) = 12.50, P = 0.0006; Bonferroni’s multiple comparison test). Box and whisker plots indicate median, interquartile range, and crosses indicate means. h, Schematic of targeting and recording strategy. i, Representative evoked synaptic responses in dl/lPAG- (top) and vlPAG-projecting (bottom) CeM cells by photostimulation of DP axonal fibres and TTX application. j, Amplitude of evoked monosynaptic EPSCs was significantly higher in dl/lPAG (N = 16 cells from 10 mice) as compared to vlPAG (N = 13 cells from 7 mice) projecting CeM neurons (Mann Whitney test, *p = 0.0367). Data represented as mean ± s.e.m. k, Proportion of CeM neurons with evoked EPSCs, classified by their projection target. Two-sided statistical tests were used. **P < 0.01, *P < 0.05.

References

    1. Fonzo GA et al. PTSD Psychotherapy outcome predicted by brain activation during emotional reactivity and regulation. Am. J. Psychiatry 174, 1163–1174 (2017). - PMC - PubMed
    1. Fadok JP et al. A competitive inhibitory circuit for selection of active and passive fear responses. Nature 542, 96–99 (2017). - PubMed
    1. Roelofs K Freeze for action: Neurobiological mechanisms in animal and human freezing. Philosophical Transactions of the Royal Society B: Biological Sciences vol. 372 (2017). - PMC - PubMed
    1. Fanselow MS, Hoffman AN & Zhuravka I Timing and the transition between modes in the defensive behavior system. Behav. Processes 166, 103890 (2019). - PMC - PubMed
    1. Blanchard DC & Blanchard RJ Defensive behaviors, fear, and anxiety. in Handbook of anxiety and fear 63–79 (Elsevier Academic Press, 2008). doi:10.1016/S1569-7339(07)00005-7. - DOI

MeSH terms

LinkOut - more resources