. 2024 Mar;21(3):260-274.
doi: 10.1038/s41423-024-01124-2. Epub 2024 Jan 18.

CD8+ T cell metabolic flexibility elicited by CD28-ARS2 axis-driven alternative splicing of PKM supports antitumor immunity

Affiliations

CD8+ T cell metabolic flexibility elicited by CD28-ARS2 axis-driven alternative splicing of PKM supports antitumor immunity

G Aaron Holling et al. Cell Mol Immunol. 2024 Mar.

Abstract

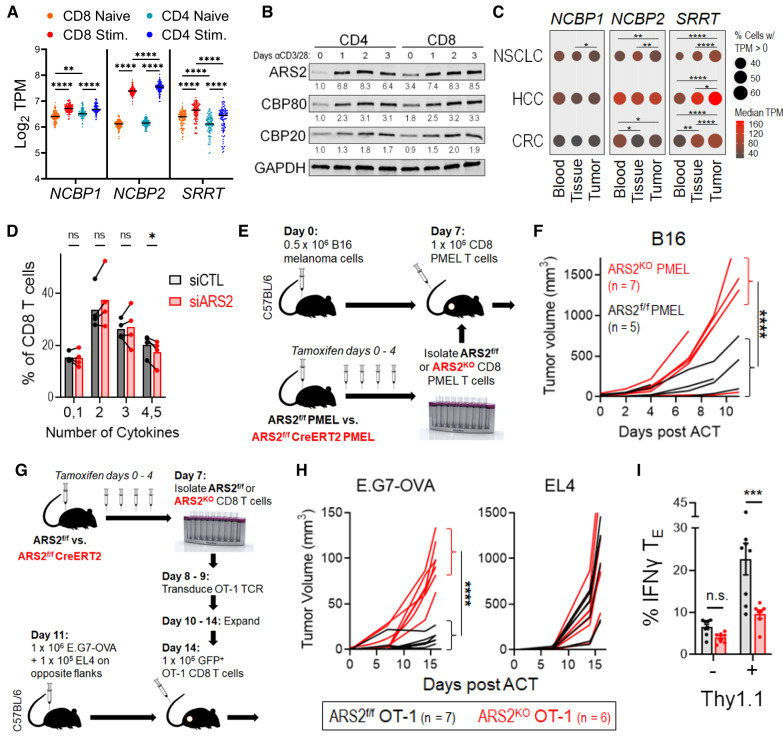
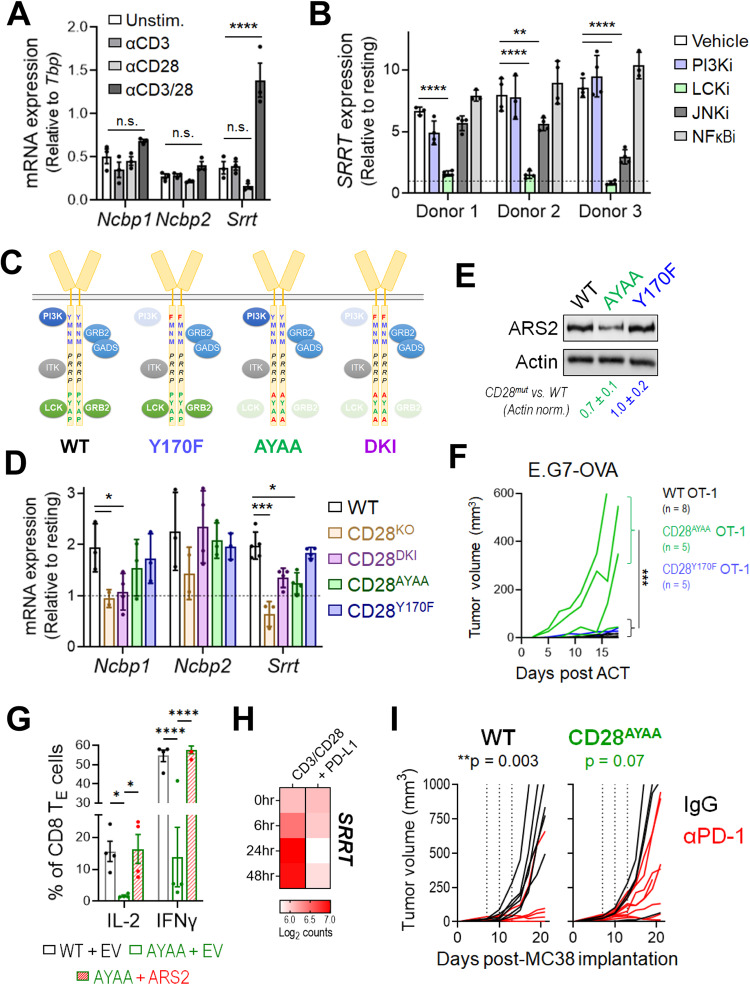
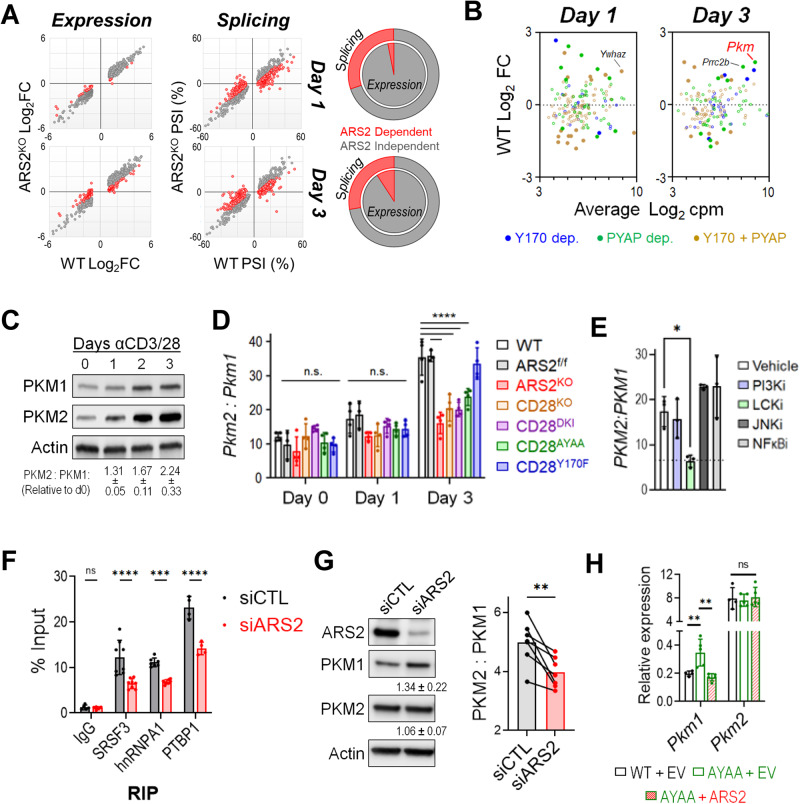
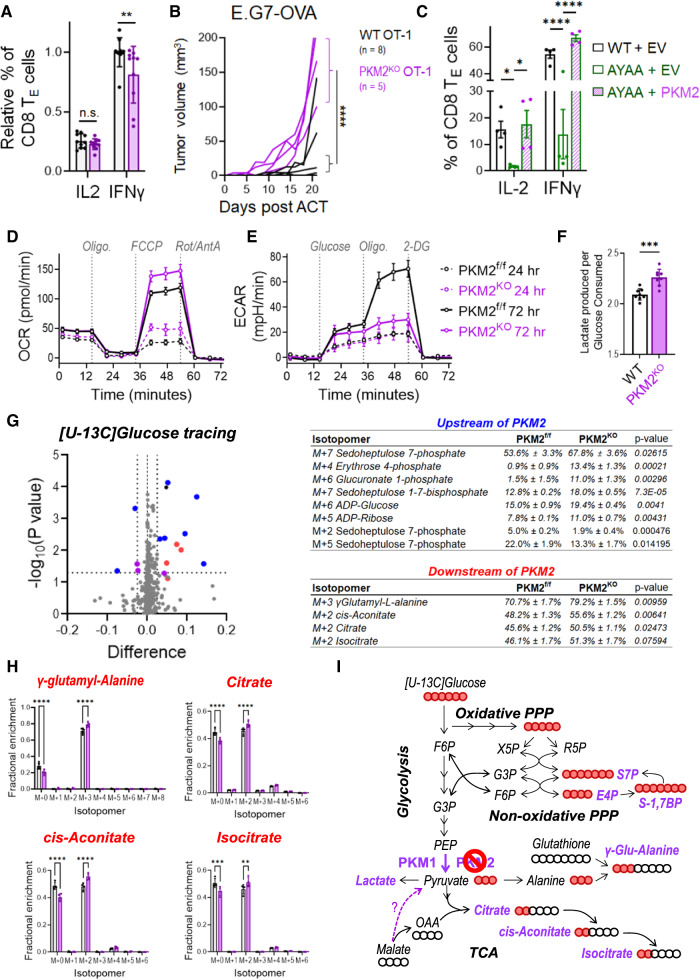
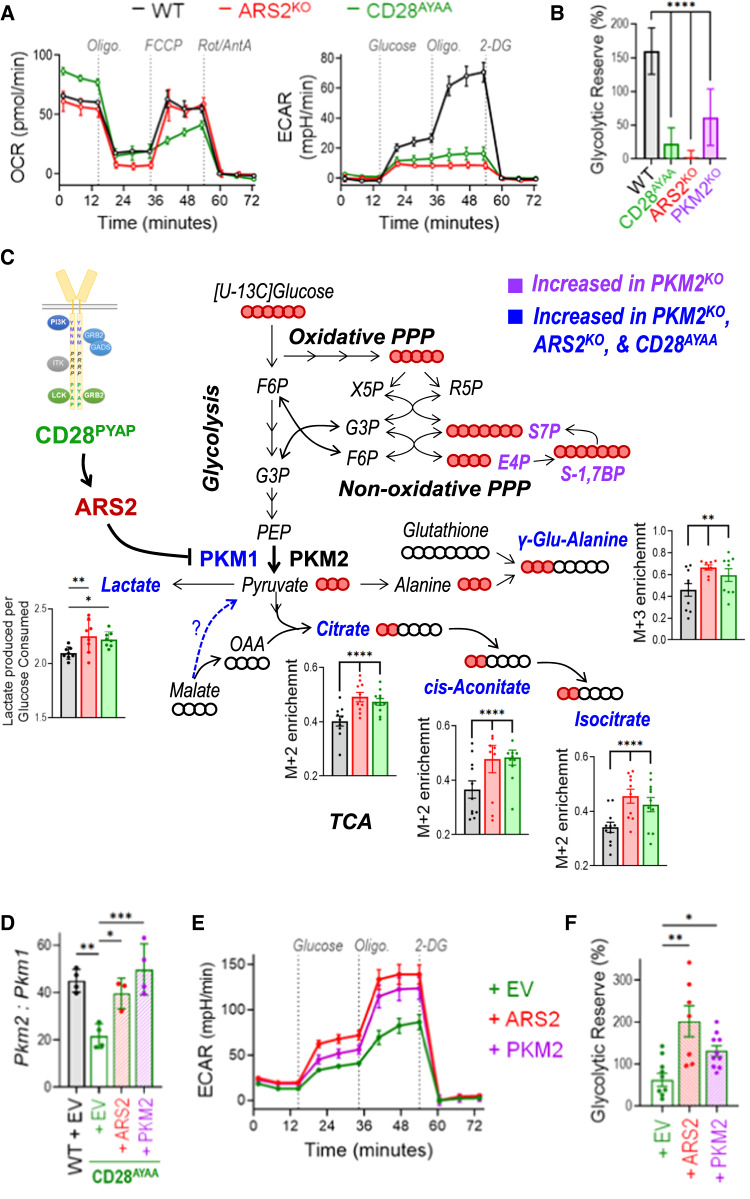
Metabolic flexibility has emerged as a critical determinant of CD8+ T-cell antitumor activity, yet the mechanisms driving the metabolic flexibility of T cells have not been determined. In this study, we investigated the influence of the nuclear cap-binding complex (CBC) adaptor protein ARS2 on mature T cells. In doing so, we discovered a novel signaling axis that endows activated CD8+ T cells with flexibility of glucose catabolism. ARS2 upregulation driven by CD28 signaling reinforced splicing factor recruitment to pre-mRNAs and affected approximately one-third of T-cell activation-induced alternative splicing events. Among these effects, the CD28-ARS2 axis suppressed the expression of the M1 isoform of pyruvate kinase in favor of PKM2, a key determinant of CD8+ T-cell glucose utilization, interferon gamma production, and antitumor effector function. Importantly, PKM alternative splicing occurred independently of CD28-driven PI3K pathway activation, revealing a novel means by which costimulation reprograms glucose metabolism in CD8+ T cells.

Keywords: ARS2; CD8 T cells; Immunometabolism; PKM2; mRNA splicing.


Conflict of interest statement

The authors declare no competing interests.

Figures

Fig. 1
Fig. 1
ARS2 supports CD8+ T-cell-mediated antitumor immunity A Violin plot showing the mRNA expression of the CBCA components CBP80 (NCBP1), CBP20 (NCBP2), and ARS2 (SRRT) in naïve compared with stimulated human CD4+ and CD8+ T cells; the data are from the DICE database (https://dice-database.org/). B Western blots showing the expression of CBCA components in separately isolated CD4+ or CD8+ human T cells stimulated with αCD3/αCD28 microbeads for the indicated number of days. The blots are representative of two healthy human donors. C Frequency (circle size) and magnitude (color) of CBCA component mRNA expression in single CD8+ T cells isolated from blood, adjacent normal tissue, or tumor tissue of patients with non-small cell lung cancer (NSCLC, data from GSE99254), hepatocellular carcinoma (HCC, data from GSE98638), or colorectal carcinoma (CRC, data from GSE108989). D Frequency of control compared with ARS2 siRNA-transfected healthy human donor CD8+ T cells expressing the indicated number of cytokines 3 days post transfection and stimulation with αCD3/αCD28 beads. Prior to intracellular staining for the cytokines shown in Supplementary Fig. 1J, T cells were restimulated for 4 h with PMA + ionomycin in the presence of brefeldin A. The bars indicate the means of 4 healthy human donors, and the connected points represent individual donors. E Schematic depicting the PMEL adoptive cell therapy (ACT) model used to compare antigen-specific antitumor immunity between ARS2f/f and ARS2KO CD8+ T cells. F Growth of subcutaneous B16 tumors following ACT with ARS2f/f (black line) or ARS2KO (red line) CD8+ T cells isolated from PMEL TCR transgenic mice. G Schematic depicting the ACT model used to compare antigen-specific antitumor immunity between ARS2f/f and ARS2KO CD8+ T cells following transduction with the OT-1 TCR transgene. H Growth of subcutaneous tumors following ACT with ARS2f/f (black line) or ARS2KO (red line) OT-1 TCR-transduced T cells. Isogenic E.G7-OVA OT-1 target and EL4 control tumor cells were implanted into opposite flanks. I IFNγ expression in E.G7-OVA tumor-infiltrating OT-1-transduced (Thy1.1+) and bystander (Thy1.1) ARS2f/f (gray bars) or ARS2KO (red bars) TE cells. The bars indicate the means ± SDs, and the dots represent biological replicates. The lines in (F) and (H) represent individual tumors. Differences between groups were determined by ANOVA (A, C, D, I) or mixed effects analysis (F, H). ns = not significant, *p < 0.05, **p < 0.01, ***p < 0.001, ****p < 0.0001
Fig. 2
Fig. 2
CD28 PYAP domain signaling regulates ARS2 expression and antitumor immunity A Expression of the mRNAs encoding the CBCA components CBP80 (Ncbp1), CBP20 (Ncbp2), and ARS2 (Srrt) in C57BL/6 J T cells stimulated with αCD3, αCD28, or αCD3 + αCD28 for 24 h. B Expression of the mRNA coding for ARS2 (SRRT) in CD8+ T cells isolated from healthy human donors (n = 3) and stimulated with αCD3 + αCD28 in the presence of the PI3K (1 μM LY294002), LCK (0.5 μM RK-24466), JNK (10 μM SP600125), or NFκB (4 μM BAY 11-7082) inhibitor. C Schematic depicting the CD28 intracellular signaling domain and associated signaling proteins in WT mice and CD28 mutant knock-in mice. D Expression of mRNAs encoding CBCA components in isolated WT C57BL/6 J, CD28 knockout, and CD28 mutant knock-in T cells stimulated with αCD3/αCD28 + rIL-2 for 24 h. E Representative Western blot showing ARS2 expression in isolated WT C57BL/6 J and CD28 mutant knock-in T cells stimulated with αCD3/αCD28 + rIL-2 for 72 h. The means ± SDs of the ARS2 band densities were quantified and normalized to the Actin band densities from three independent replicates (shown below the blots). F Growth of subcutaneous E.G7-OVA tumors following ACT with WT (black line), CD28Y170F knock-in (blue line) or CD28AYAA knock-in (green line) OT-1 TCR-transduced CD8+ T cells. The growth of isogenic EL4 control tumors from cells implanted into opposite flanks is shown in Supplementary Fig. 3D. G Rescue of IFNγ and IL-2 expression in activated CD28AYAA TE cells by ectopic expression of ARS2. H Expression of the mRNA coding for ARS2 (SRRT) in CD8+ T cells isolated from healthy human donors and stimulated with αCD3 + αCD28 ± recombinant PD-L1; the data are from GSE122149. I Growth of subcutaneous MC38 tumors in WT and CD28AYAA knock-in mice treated with either 200 μg of control rat IgG2a (black lines) or αPD-1 (clone 29 F.1A12, red lines) on Days 7, 10, and 13 following tumor implantation. The bars in (A, B, D, G) indicate the means ± SDs; the dots represent biological replicates. The lines in (F, I) represent individual tumors. Differences between groups were determined by ANOVA (A, B, D, G) or mixed effects analysis (F, I). ns = not significant, *p < 0.05, **p < 0.01, ***p < 0.001, ****p < 0.0001
Fig. 3
Fig. 3
T-cell activation-induced alternative splicing of PKM is regulated by the CD28-ARS2 axis. A Effect of ARS2 deletion on T-cell activation-induced gene expression (left) or alternative splicing (right) on Day 1 (top) and Day 3 (bottom) following stimulation with αCD3/αCD28 + rIL-2. The red dots indicate significant differences between activated WT and ARS2KO T cells. The pie charts depict the contribution of ARS2 to differential gene expression (inner pie) and alternative splicing (outer pie) induced by T-cell activation. B Dot plot showing fold changes in the expression of genes whose alternative splicing was found to be ARS2 and CD28 dependent on Day 1 (left) or Day 3 (right) of T-cell activation in activated T cells compared with resting T cells. The dots are color coded based on CD28 signaling domain dependence. The filled dots represent DEGs in activated cells relative to resting cells. C Western blot analysis of PKM1 and PKM2 protein expression in human T cells stimulated with αCD3/αCD28-coated microbeads; representative of four normal donors. D Pkm2-to-Pkm1 ratio, as determined by qRT‒PCR, in WT, ARS2f/f, ARS2KO, CD28KO, CD28DKI knock-in, CD28AYAA knock-in, and CD28Y170F knock-in T cells following activation with αCD3/αCD28 + rIL-2 for the indicated number of days. Total Pkm expression is shown in Supplementary Fig. 4E. E PKM2-to-PKM1 ratio, as determined by qRT‒PCR, in human T cells activated for 3 days with αCD3/αCD28-coated microbeads in the presence of the indicated inhibitors, as described in Fig. 2B. F Binding of splicing factors to PKM pre-mRNA, as determined by RNA immunoprecipitation (RIP) followed by qRT‒PCR, in control siRNA- or ARS2 siRNA-transfected human T cells activated with αCD3/αCD28-coated microbeads for 3 days. G Western blot showing the expression of PKM1 and PKM2 in control compared with ARS2-knockdown human T cells on Day 3 of activation. The values below the blots are the mean expression levels in cells with ARS2 knockdown relative to those in control cells ± the SD values from 7 healthy donors. The bar graph on the right shows the average PKM2-to-PKM1 protein ratio, with the connected dots representing individual donors. Differences between groups were determined by paired t tests. H Expression of Pkm1 and Pkm2 on Day 3 of activation in empty vector (EV)-transfected WT T cells compared to CD28AYAA knock-in T cells transfected with either EV or ARS2. The bars in (D, E, F, H) indicate the means ± SDs; the dots represent biological replicates. Differences between groups were determined by ANOVA. ns = not significant, *p < 0.05, **p < 0.01, ***p < 0.001, ****p < 0.0001
Fig. 4
Fig. 4
Influence of PKM2 on CD8+ T-cell antitumor function and metabolic reprogramming. A IFNγ and IL-2 expression in activated PKM2f/f and PKM2KO TE cells (CD8+CD44+CD62L) after 72 h of ex vivo activation. B Growth of subcutaneous E.G7-OVA tumors following ACT with WT (black line) or PKM2KO (purple line) OT-1 TCR-transduced CD8+ T cells. The growth of isogenic EL4 control tumors from cells implanted into opposite flanks is shown in Supplementary Fig. 5G. C Rescue of IFNγ and IL-2 expression in activated CD28AYAA TE cells by ectopic expression of PKM2. D Seahorse Mito Stress Tests were performed on PKM2f/f (black lines) and PKM2KO (purple lines) T cells 24 h (dashed lines) and 72 h (solid lines) after activation with αCD3/αCD28-coated microbeads + rIL-2. E Seahorse Glycolysis Stress Tests were performed as described in (D). F The ratio of lactate produced to glucose consumed was measured in the culture medium of WT and PKM2KO T cells on day three of activation. G Volcano plot depicting differences in the fractional enrichment of metabolite isotopomers labeled with [U-13C] glucose in Day 3 activated PKM2KO compared with PKM2f/f CD8+ T cells. The blue dots represent differentially labeled metabolites upstream of PKM2, the red dots represent metabolites downstream of PKM2, and the purple dots represent differentially labeled nucleotides. The tables on the right show the fractional enrichment of differentially labeled metabolite isotopomers upstream and downstream of PKM2. H Increased 13C-glucose labeling of isotopomers of metabolites downstream of PKM2 in Day 3 activated PKM2KO CD8+ T cells. I Diagram of metabolic pathways altered in Day 3 activated PKM2KO CD8+ T cells. The abundances of the indicated isotopomers of the metabolites shown in purple were significantly increased in Day 3 activated PKM2KO CD8+ T cells. The solid red balls represent 13C carbons, and the empty balls represent 12C carbons. The bars in (A, C, F, H) indicate the means ± SDs; the dots represent biological replicates. The lines in (B) represent individual tumors. The Seahorse plots in (D, E) show representative results from experiments repeated at least 3 times. Differences between groups were determined by ANOVA (A, C, F, H) or mixed effects analysis (B). ns = not significant, *p < 0.05, **p < 0.01, ***p < 0.001, ****p < 0.0001
Fig. 5
Fig. 5
The CD28-ARS2-PKM2 axis imparts CD8+ T cells with metabolic flexibility. A Seahorse Mito (left) and Glycolysis (right) Stress Tests were performed on WT (black lines), ARS2KO (red lines), and CD28AYAA knock-in (green lines) T cells 72 h after activation with αCD3/αCD28-coated microbeads + rIL-2. B Quantification of the glycolytic reserve (maximum ECAR ÷ glucose-induced ECAR) in Day 3 activated T cells of the indicated genotypes. C Diagram of metabolic pathways influenced by the CD28-ARS2-PKM2 axis in Day 3 activated CD8+ T cells; the bar graphs show significant changes in ARS2KO (red bars) and CD28AYAA knock-in (green bars) cells. The abundances of the indicated isotopomers of the metabolites shown in blue were significantly increased in Day 3 activated CD28AYAA knock-in, ARS2KO, and PKM2KO CD8+ T cells, while those in purple were only increased in PKM2KO CD8+ T cells. The solid red balls represent 13C carbons, and the empty balls represent 12C carbons. D Pkm2-to-Pkm1 ratio on Day 3 after activation in WT T cells transfected with empty vector (EV) compared to CD28AYAA knock-in T cells transfected with EV, ARS2, or PKM2. E Seahorse Glycolysis Stress Tests were performed on Day 3 activated CD28AYAA knock-in T cells transfected with EV, ARS2, or PKM2. F Quantification of the glycolytic reserve in Day 3 activated CD28AYAA knock-in T cells transfected with EV, ARS2, or PKM2. The bars in (B, C, D, F) indicate the means ± SDs; the dots represent biological replicates. The Seahorse plots in (A, E) show representative results of experiments repeated at least 3 times. Differences between groups were determined by ANOVA. ns = not significant, *p < 0.05, **p < 0.01, ***p < 0.001, ****p < 0.0001

References

    1. Chen Y, Zander R, Khatun A, Schauder DM, Cui W. Transcriptional and Epigenetic Regulation of Effector and Memory CD8 T Cell Differentiation. Frontiers in immunology. 2018;9:2826. doi: 10.3389/fimmu.2018.02826. - DOI - PMC - PubMed
    1. Reina-Campos M, Scharping NE, Goldrath AW. CD8+ T cell metabolism in infection and cancer. Nature Reviews Immunology. 2021;21:718–38. - PMC - PubMed
    1. Menk AV, Scharping NE, Moreci RS, Zeng X, Guy C, Salvatore S, et al. Early TCR Signaling Induces Rapid Aerobic Glycolysis Enabling Distinct Acute T Cell Effector Functions. Cell Rep. 2018;22:1509–21. doi: 10.1016/j.celrep.2018.01.040. - DOI - PMC - PubMed
    1. Jacobs SR, Herman CE, Maciver NJ, Wofford JA, Wieman HL, Hammen JJ, et al. Glucose uptake is limiting in T cell activation and requires CD28-mediated Akt-dependent and independent pathways. J Immunol. 2008;180:4476–86. doi: 10.4049/jimmunol.180.7.4476. - DOI - PMC - PubMed
    1. Chang CH, Curtis JD, Maggi LB, Jr., Faubert B, Villarino AV, O’Sullivan D, et al. Posttranscriptional control of T cell effector function by aerobic glycolysis. Cell. 2013;153:1239–51. doi: 10.1016/j.cell.2013.05.016. - DOI - PMC - PubMed

MeSH terms