. 2024 Feb;30(2):507-518.
doi: 10.1038/s41591-023-02754-1. Epub 2024 Jan 17.

Impact of tumor microenvironment on efficacy of anti-CD19 CAR T cell therapy or chemotherapy and transplant in large B cell lymphoma

Affiliations

Impact of tumor microenvironment on efficacy of anti-CD19 CAR T cell therapy or chemotherapy and transplant in large B cell lymphoma

Frederick L Locke et al. Nat Med. 2024 Feb.

Abstract

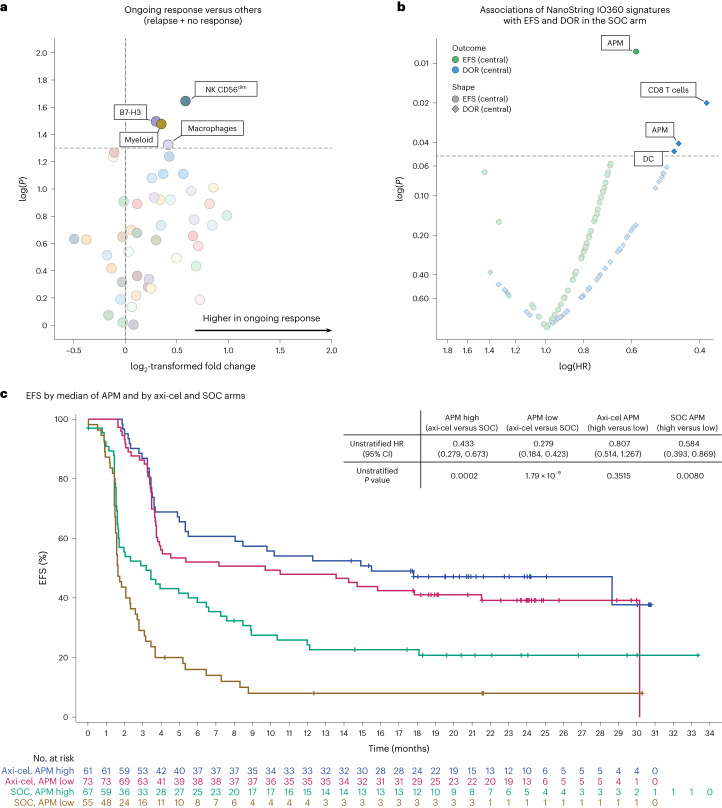
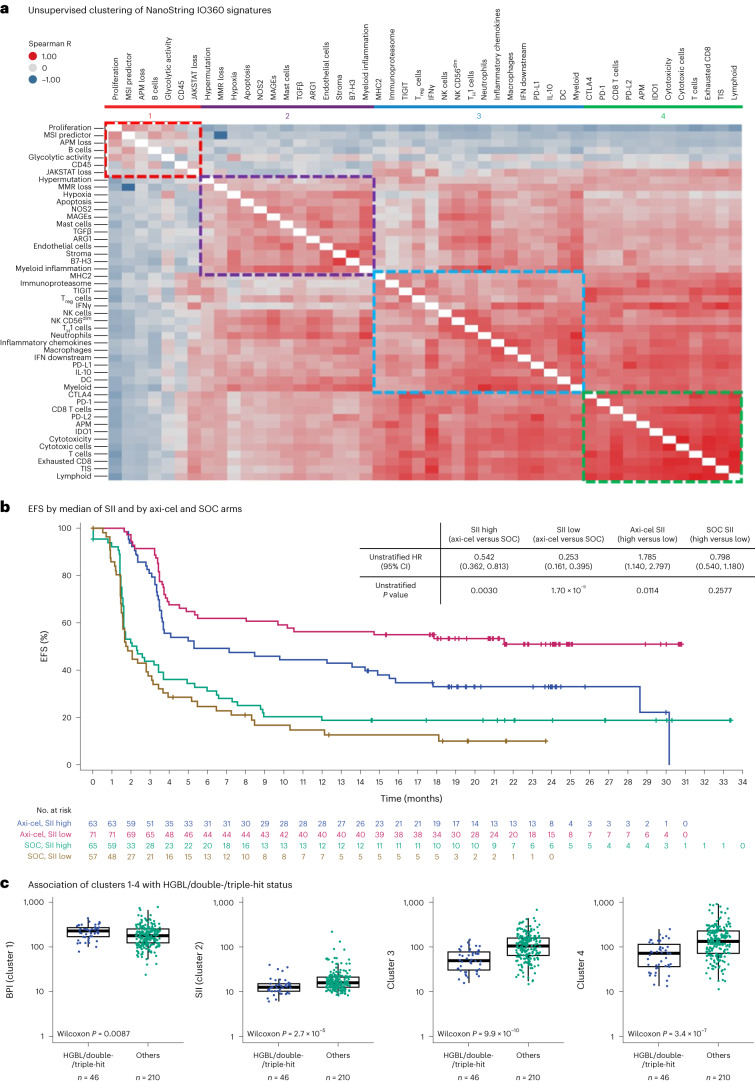
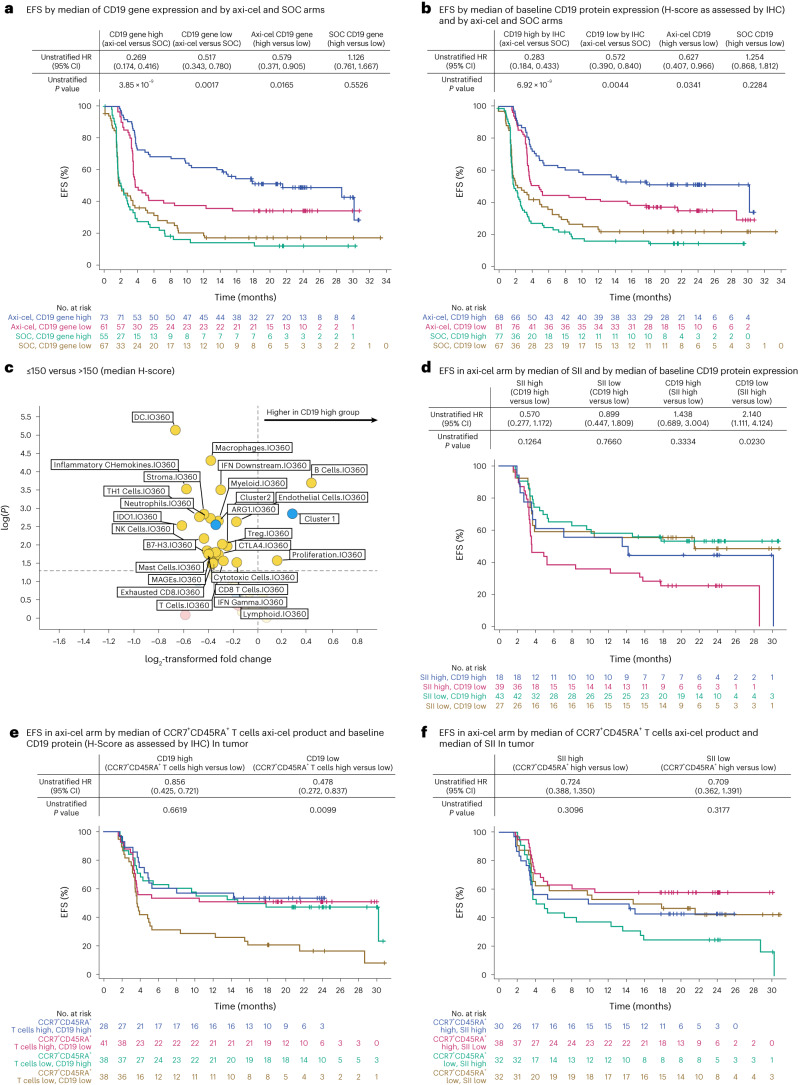
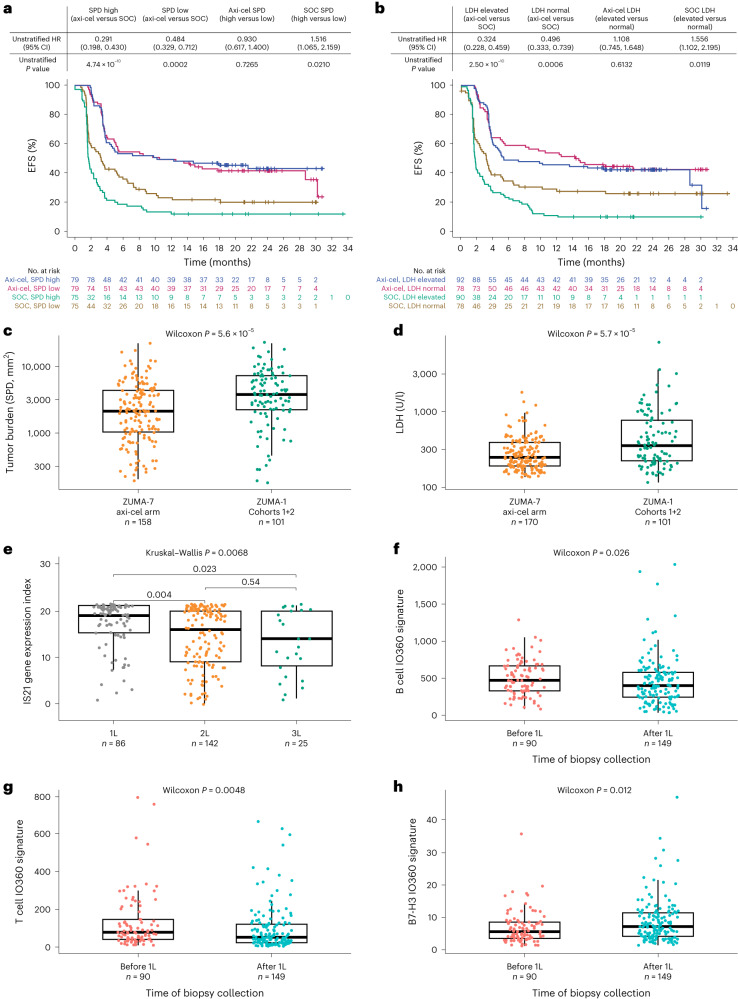
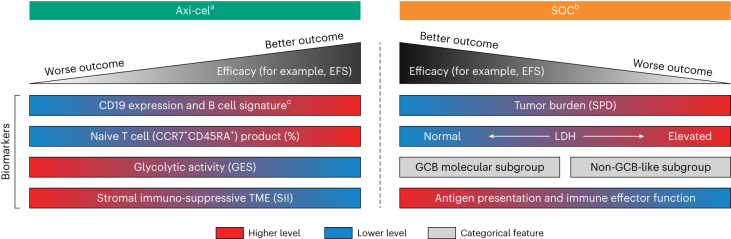
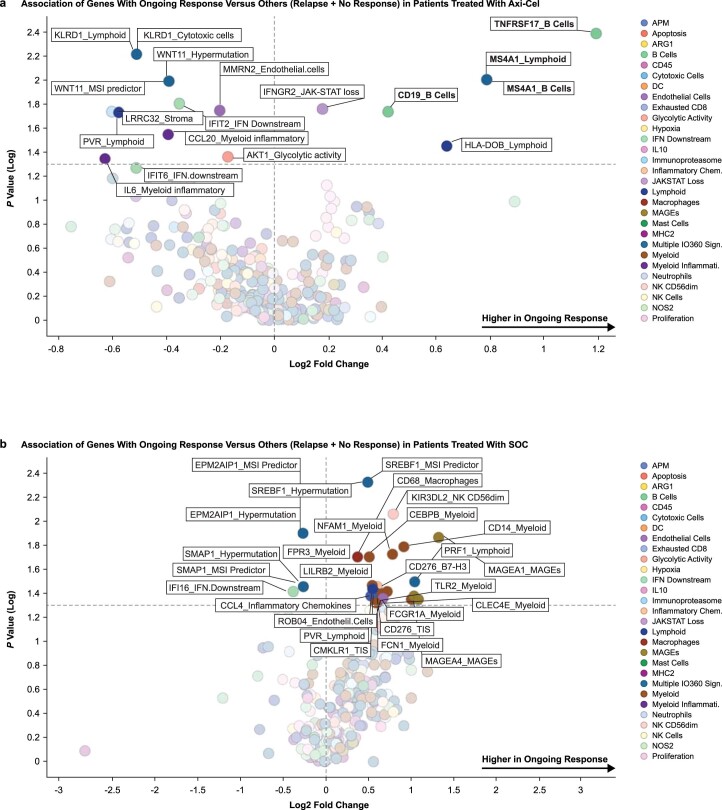
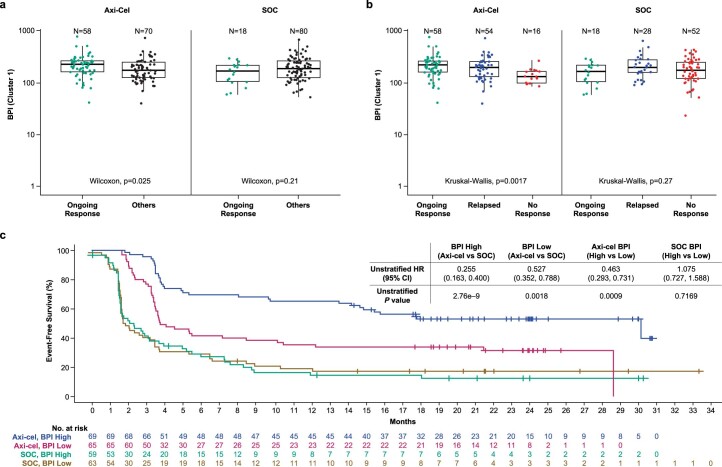
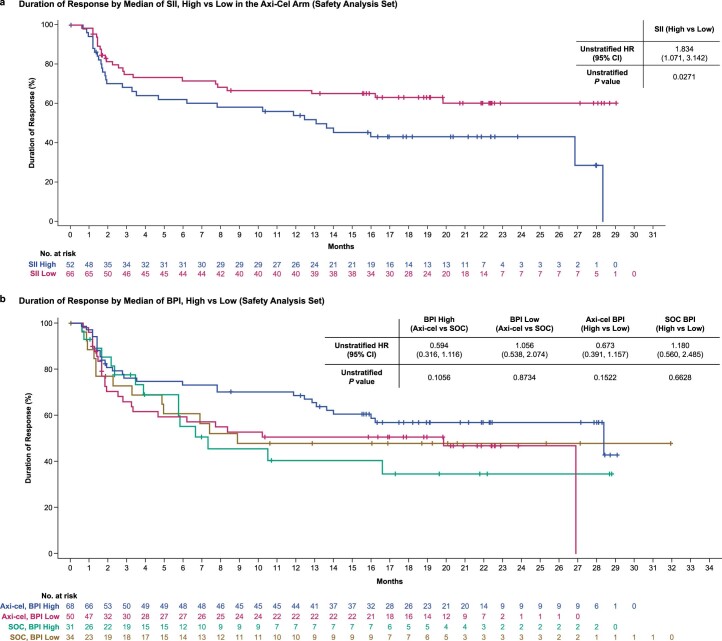
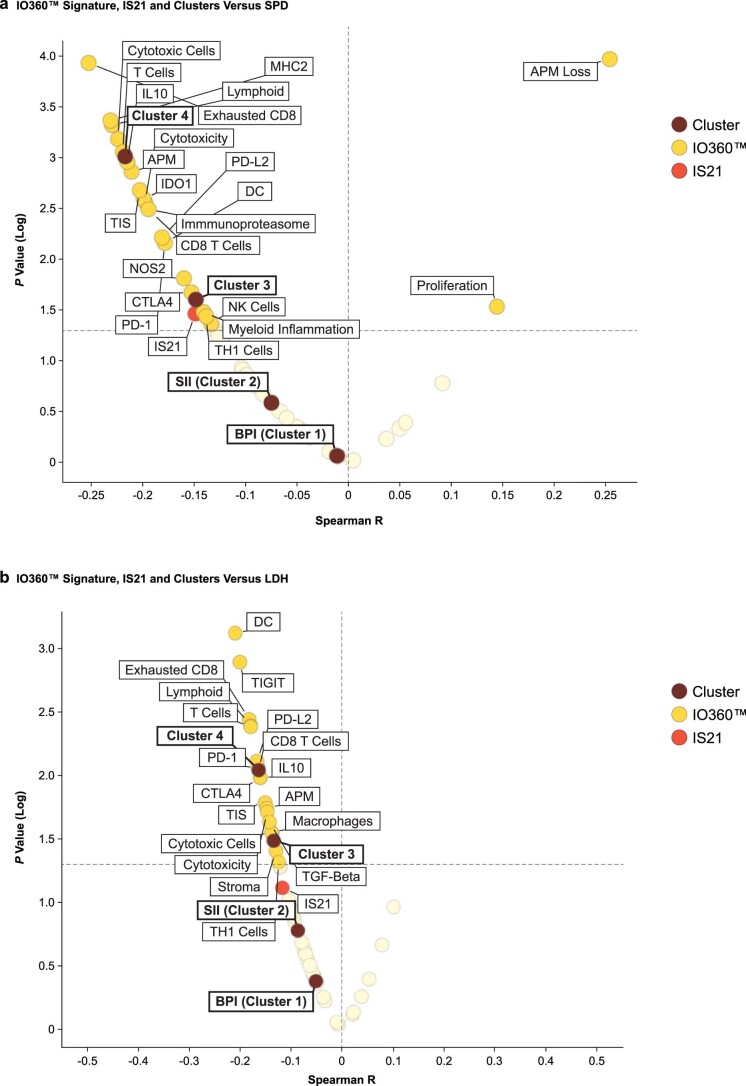
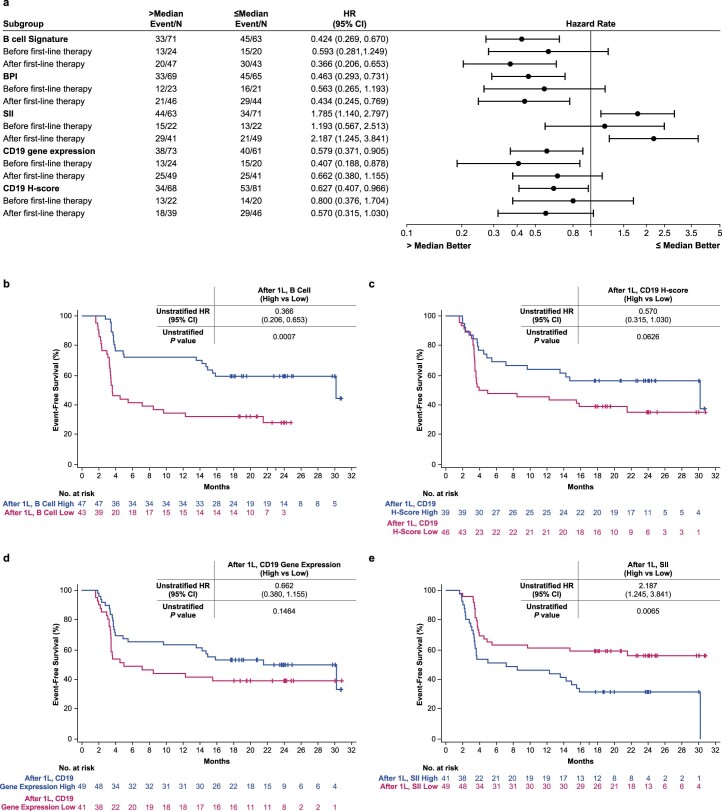
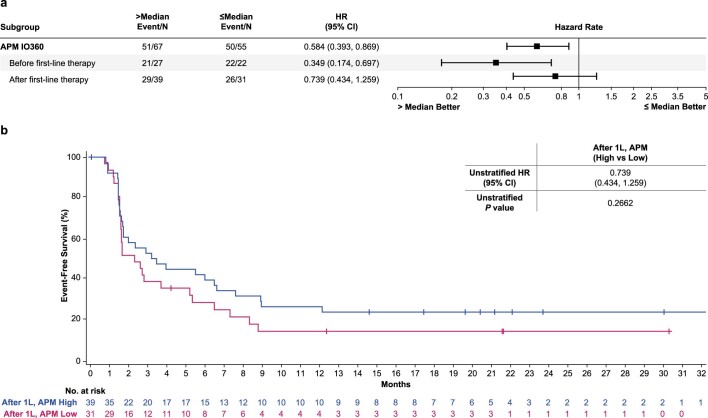
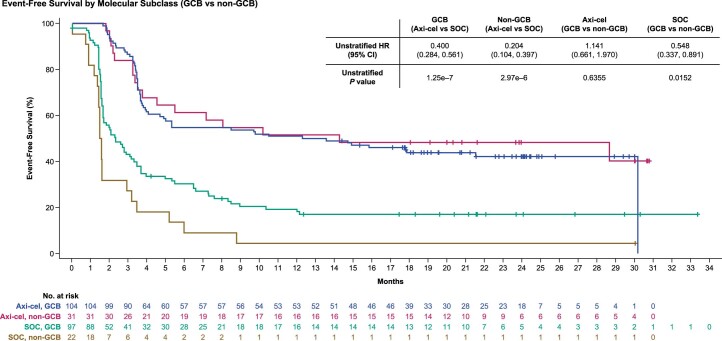
The phase 3 ZUMA-7 trial in second-line large B cell lymphoma demonstrated superiority of anti-CD19 CAR T cell therapy (axicabtagene ciloleucel (axi-cel)) over standard of care (SOC; salvage chemotherapy followed by hematopoietic transplantation) ( NCT03391466 ). Here, we present a prespecified exploratory analysis examining the association between pretreatment tumor characteristics and the efficacy of axi-cel versus SOC. B cell gene expression signature (GES) and CD19 expression associated significantly with improved event-free survival for axi-cel (P = 0.0002 for B cell GES; P = 0.0165 for CD19 expression) but not SOC (P = 0.9374 for B cell GES; P = 0.5526 for CD19 expression). Axi-cel showed superior event-free survival over SOC irrespective of B cell GES and CD19 expression (P = 8.56 × 10⁻⁹ for B cell GES high; P = 0.0019 for B cell GES low; P = 3.85 × 10⁻⁹ for CD19 gene high; P = 0.0017 for CD19 gene low). Low CD19 expression in malignant cells correlated with a tumor GES consisting of immune-suppressive stromal and myeloid genes, highlighting the inter-relation between malignant cell features and immune contexture substantially impacting axi-cel outcomes. Tumor burden, lactate dehydrogenase and cell-of-origin impacted SOC more than axi-cel outcomes. T cell activation and B cell GES, which are associated with improved axi-cel outcome, decreased with increasing lines of therapy. These data highlight differences in resistance mechanisms to axi-cel and SOC and support earlier intervention with axi-cel.


Conflict of interest statement

The authors declare the following competing interests: F.L.L. reports a consulting or advisory role for Allogene, Amgen, Bluebird Bio, BMS/Celgene, Calibr, Cellular Biomedicine Group, Cowen, ecoR1, Emerging Therapy Solutions Gerson Lehman Group, GammaDelta Therapeutics, Iovance, Janssen, Kite, a Gilead Company, Legend Biotech, Novartis, Umoja and Wugen; research funding from Allogene, Kite and Novartis; and patents, royalties and other intellectual property in the field of cellular immunotherapy. S.F. reports employment and stock or ownership with Kite, a Gilead Company, and patents, royalties and other intellectual property from Tusk Therapeutics. J.C. reports employment with, leadership role in and travel support from Kyverna and Kite, a Gilead Company; stock or other ownership in Gilead Sciences; and research funding, patents, royalties and other intellectual property from Kite. S.V. reports employment with and research funding from Kite, a Gilead Company; and stock or other ownership in Gilead Sciences. R.P. reports employment and stock or other ownership with Veracyte. P.D. reports a consulting or advisory role for, honoraria from and speakers’ bureau participation for Bristol-Myers Squibb, Gilead Sciences and Novartis. B.T.H reports honoraria from, a consulting or advisory role for, research funding from and travel support from Kite, a Gilead Company. C.L. reports stock in Kadmon; honoraria from CareDX, Jazz, Kadmon and Kite, a Gilead Company; a consulting or advisory role for Fresenius Kabi; and research funding from Incyte. P.L.Z. reports a consultant role for MSD, Eusa Pharma and Novartis; speakers’ bureau participation for Celltrion, Gilead Sciences, Janssen-Cilag, Bristol-Myers Squibb, Servier, MSD, TG Therapeutics, Takeda, Roche, Eusa Pharma, Kyowa Kirin, Novartis, Incyte, and Beigene; and advisory board participation for Secura Bio, Celltrion, Gilead Sciences, Janssen-Cilag, Bristol-Myers Squibb, Servier, Sandoz, MSD, TG Therapeutics, Takeda, Roche, Eusa Pharma, Kyowa Kirin, Novartis, ADC Therapeutics, Incyte and Beigene. N.K. reports honoraria from and a consulting or advisory role for Kite, a Gilead Company; and research funding from Neovii, Novartis and Riemser. A.L.-G. reports a consulting or advisory role for Celgene, Incyte, Kite, a Gilead company, Novartis, Roche and Takeda; research funding from Celgene, Kite and Roche; and travel, accommodation and expenses from Kite. H.G. and W.Z. have no relevant financial relationships to disclose. G.T. and F.M.M. report employment with Kite, a Gilead Company. J.B., C.T., M.S. and H.M. report employment with Kite, a Gilead Company; and stock or other ownership in Gilead Sciences. M.M. and P.C. report employment with Kite, a Gilead Company, and patents, royalties and other intellectual property, and travel support from Kite; and stock or other ownership with Gilead Sciences. A.B. reports former employment with Kite, a Gilead Company; current employment and a leadership role with Capstan Therapeutics; stock or other ownership with Capstan Therapeutics and Gilead Sciences; a consulting or advisory role for Cero Therapeutics and Elicio; and expert testimony for Gilead Sciences. R.S. reports employment with and stock or other ownership in Kite, a Gilead Company; and patents, royalties and other intellectual property from Atara and Kite. D.B. reports employment with Kite, a Gilead Company. J.G. reports employment with Veracyte; a leadership role and consulting or advisory role in Northwest Biotherapeutics and Lunaphore; stock or other ownership in and travel support from Veracyte; research funding from Imcheck Therapeutics and Veracyte; and patents, royalties or other intellectual property from Inserm.

Figures

Fig. 1
Fig. 1. High B cell gene signature was associated with improved EFS and higher probability of durable response after axi-cel.
a, Association of ongoing response with IO360 signatures as a volcano plot. The plot presents descriptive P value and fold change of IO360 signatures in ongoing response versus others (response followed by progressive diseases and no response) in the axi-cel arm. The fold change is presented as log2((group one)/(group two)). Statistical analyses were conducted using Kruskal–Wallis test (numerical versus categorical). b, NanoString IO360 GES associated with DOR (blue data points) and EFS (green data points) in the axi-cel arm. Two-sided P values were calculated via a Cox proportional hazards model. c, B cell gene signature by response (where n reflects the number of independent patients with each response type) in the axi-cel (left; n = 58, ongoing response; n = 54, relapsed; n = 16, no response) and SOC (right; n = 18, ongoing response; n = 28, relapsed; n = 52, no response) arms. The box plots show quartile 1 (Q1), median and Q3, and the lower and upper whiskers show Q1 – 1.5 × interquartile range (IQR) and Q3 + 1.5 × IQR, respectively. d, Kaplan–Meier estimate of EFS by B cell gene signature and treatment arm (axi-cel versus SOC). Patients who did not meet the criteria for an event had their data censored (tick marks). Unstratified Cox proportional hazards P values (two-sided) are presented. CI, confidence interval.
Fig. 2
Fig. 2. Association of NanoString IO360 signatures with ongoing response, EFS and DOR in the SOC arm.
a, Association of ongoing response with IO360 signatures as a volcano plot. The plot presents descriptive P value and fold change of IO360 signatures in ongoing response versus others (response followed by progressive disease and no response) in the SOC arm. The fold change is presented as log2((group one)/(group two)). Statistical analyses were conducted using Kruskal–Wallis test (numerical versus categorical). b, NanoString IO360 GES associated with DOR (blue data points) and EFS (green data points) in the SOC arm. Two-sided P values were calculated via Cox proportional hazards model. c, Kaplan–Meier estimate of EFS by median APM and treatment arm (axi-cel versus SOC). Patients who did not meet the criteria for an event had their data censored (tick marks). Unstratified Cox proportional hazards P values (two-sided) are presented. DC, dendritic cells.
Fig. 3
Fig. 3. NanoString IO360 signature clustering and their association with EFS and HGBL status in the axi-cel arm.
a, Unsupervised clustering of NanoString IO360 GES by Spearman rank-order correlation. Group 1 (red) represents BPI, which includes relatively low non B cell infiltration genes. Group 2 (purple) represents SII, which includes stromal and immune-suppressive genes. Group 3 (blue) represents mostly NK and myeloid cells (immune infiltration genes). Group 4 (green) represents mostly T lymphocytes (immune infiltration genes). Indices were calculated by the room mean square method. b, Kaplan–Meier estimate of EFS by SII and treatment arm (axi-cel versus SOC). Patients who did not meet the criteria for an event had their data censored (tick marks). Unstratified Cox proportional hazards P values (two-sided) are presented. c Association between HGBL/double-/triple-hit status (n = 46) versus other disease type (n = 210), where n reflects the number of independent patients with each disease type, with the four clusters. HGBL status correlated positively with BPI. The box plots show Q1, median and Q3, and the lower and upper whiskers show Q1 – 1.5 × IQR and Q3 + 1.5 × IQR, respectively. Two-sided P values were calculated per Wilcoxon test and are reported. IFN, interferon; IL-10, interleukin-10; JAKSTAT, Janus kinase signal transducer and activator of transcription; MAGE, melanoma antigen gene; MHC, major histocompatibility complex; MMR, mismatch repair; MSI, microsatellite instability; PD-1, programmed cell death protein 1; PD-L1, programmed death-ligand 1; TH1, T helper type 1; TIS, tumor inflammation signature; Treg cell, regulatory T cell.
Fig. 4
Fig. 4. Patients treated with axi-cel who demonstrated improved EFS harbor higher CD19 gene expression and protein in the tumor.
For all panels, patients who did not meet the criteria for an event had their data censored (tick marks). a, Kaplan–Meier estimate of EFS by CD19 gene expression and treatment arm (axi-cel versus SOC). b, Kaplan–Meier estimate of EFS by CD19 protein expression (H-score as assessed by IHC) and treatment arm (axi-cel versus SOC). c, Association between CD19 H-score and GES as a volcano plot. The plot presents descriptive P value and fold change of GES in patients with a median CD19 H-score ≤150 versus >150. Clusters 1 and 2 are shown in blue. The fold change is presented as log2((group one(/(group two)). Statistical analyses were conducted using Kruskal–Wallis test (numerical versus categorical). d, Kaplan–Meier estimate of EFS in the axi-cel group by SII and CD19 protein expression. e, Kaplan–Meier estimate of EFS in the axi-cel group by median of CCR7+CD45RA+ T cells in axi-cel product and CD19 protein (H-score) in tumor. f, Kaplan–Meier estimate of EFS in the axi-cel group by median of CCR7+CD45RA+ T cells in axi-cel product and SII in tumor. For panels a, b and df, unstratified Cox proportional hazards P values (two-sided) are presented.
Fig. 5
Fig. 5. Axi-cel EFS was superior to SOC irrespective of SPD or LDH.
a, Kaplan–Meier estimate of EFS by SPD and treatment arm (axi-cel versus SOC). b, Kaplan–Meier estimate of EFS by LDH and treatment arm (axi-cel versus SOC). For a and b, patients who did not meet the criteria for an event had their data censored (tick marks); unstratified Cox proportional hazards P values (two-sided) are presented. c,d, Tumor burden (SPD; c) and LDH (d) of ZUMA-7 (axi-cel arm; n = 158, tumor burden; n = 170, LDH) and ZUMA-1 phase 2 cohorts 1 + 2 patients (n = 101 for tumor burden and LDH). e, IS21 gene expression indices by line of therapy (n = 86, 1 L; n = 142, 2 L; n = 25, 3 L. f, B cell IO360 GES at initial diagnosis (n = 90) and after first-line therapy (n = 149). g, T cell IO360 GES at initial diagnosis (n = 90) and after first-line therapy (n = 149). h, B7-H3 IO360 GES at initial diagnosis (n = 90) and after first-line therapy (n = 149). For panels ch, box plots show Q1, median and Q3, and the lower and upper whiskers show Q1 – 1.5 × IQR and Q3 + 1.5 × IQR, respectively; n values reflect the number of independent patients in each respective group. Two-sided P values were calculated per Wilcoxon test and are reported. 1L, first-line; 2L, second-line; 3L, third-line; IS, ImmunoSign.
Fig. 6
Fig. 6. Summary of second-line biomarkers associated with efficacy.
Biomarkers associated with efficacy in the axi-cel (left) and SOC (right) arms. Red represents higher levels and blue represents lower levels. Antigen presentation and immune effector function includes possible associations with macrophages, myeloid, APM, NK or CD8 T cells. aTumor burden (by SPD), LDH and GCB subgroup did not impact outcomes in the axi-cel arm. bCD19 expression did not impact outcomes in the SOC arm. cCD19 protein expression was measured by IHC, and B cell signature and CD19 mRNA by NanoString.
Extended Data Fig. 1
Extended Data Fig. 1. Elevation of select B-cell genes was associated with ongoing response.
Panel a shows the association of ongoing response with genes included in Nanostring IO360™ GES as a volcano plot in axi-cel treated patients. The corresponding Nanostring IO360™ GES for each gene is appended to the gene name in the label. The plot presents the descriptive two-sided P value and fold change of each gene in ongoing responders versus others (response followed by progressive disease and no response) in the axi-cel arm. The fold change is presented as Log2([median Ongoing]/[median Others]). Statistical analyses were conducted using the Wilcoxon rank sum test (numerical vs categorical). Panel b shows the association of ongoing response with genes included in Nanostring IO360™ GES as a volcano plot in SOC-treated patients. The corresponding Nanostring IO360™ GES for each gene is appended to the gene name in the label. The plot presents the descriptive two-sided P value and fold change of each gene in ongoing responders versus others (response followed by progressive disease and no response) in the SOC arm. The fold change is presented as Log2([median Ongoing]/[median Others]). Statistical analyses were conducted using the Wilcoxon rank sum test (numerical vs categorical). axi-cel, axicabtagene ciloleucel; SOC, standard of care.
Extended Data Fig. 2
Extended Data Fig. 2. BPI correlated with responses to axi-cel.
Panels a and b show association between cluster 1 (BPI) and ongoing response in the axi-cel (left) and SOC (right) arm. Panel a includes ongoing responders (n = 58, axi-cel; n = 18, SOC) versus others (combined progression after response and no response; n = 70, axi-cel; n = 80, SOC), whereas Panel b includes ongoing responders (n = 58, axi-cel; n = 18, SOC) versus progression after response (n = 54, axi-cel; n = 28, SOC) versus no response (n = 16, axi-cel; n = 52, SOC). For panels a-b, box plots show Q1, median, and Q3, and the lower and upper whiskers show Q1-1.5(IR) and Q3 + 1.5(IR), respectively; n values reflect the number of independent patients in each respective group. For panels a-b, two-sided P values were calculated per Wilcoxon test and Kruskal-Wallis test, respectively, and are reported. Panel c shows the Kaplan-Meier estimate of EFS by BPI and treatment arm (axi-cel vs SOC). Patients who did not meet the criteria for an event had their data censored (tick marks). Unstratified Cox proportional hazards P values (two-sided) are presented. Axi-cel, axicabtagene ciloleucel; BPI, B-Cell Lineage and Proliferation Index; CI, confidence interval; EFS, event-free survival; HR, hazard ratio; IR, interquartile; Q, quartile; SOC, standard of care.
Extended Data Fig. 3
Extended Data Fig. 3. SII and BPI clusters negatively and positively, respectively, associated with DOR following axi-cel treatment.
a,b, Kaplan-Meier estimate of DOR by SII (a) and by BPI (b) in the axi-cel treatment arm (SII High versus SII Low; BPI High vs BPI Low). Patients who did not meet the criteria for an event had their data censored (tick marks). Unstratified Cox proportional hazards P value (two-sided) is presented. Axi-cel, axicabtagene ciloleucel; BPI, B-cell lineage and proliferation index; SII, stromal and immunosuppressive index; axi-cel, axicabtagene ciloleucel.
Extended Data Fig. 4
Extended Data Fig. 4. Gene expression clusters did not associate with cell of origin by molecular subgroup.
The relation between cell of origin (GCB [n = 191] versus non-GCB [n = 52]) with the 4 clusters is depicted. Due to the limited number of unclassified subtypes in ZUMA-7, ABC (activated B-cell) subgroup and unclassified were grouped together as non–GCB-like. Box plots show Q1, median, and Q3, and the lower and upper whiskers show Q1-1.5(IR) and Q3 + 1.5(IR), respectively; n values reflect the number of independent patients in each respective group. Two-sided P values were calculated per Wilcoxon test and are reported. BPI, B-Cell Lineage and Proliferation Index; GCB, germinal center B-cell subgroup; IR, interquartile; Q, quartile; SII, Stromal and Immunosuppressive Index.
Extended Data Fig. 5
Extended Data Fig. 5. Failure to achieve durable response in patients with high CD19 H-score may be driven by a high glycolytic activity.
Panel a shows association between ongoing response and IO360™ signatures as a volcano plot. Descriptive P value is reported over GES signature fold change in patients with ongoing response versus others. The fold change is shown as Log2([group one]/[group two]). Statistical analyses were conducted using Kruskal–Wallis test (numerical vs categorical). Panel b shows glycolytic activity (IO360) by response in the axi-cel arm for patients with high CD19 H-score (>median; left; n = 31, ongoing response; n = 20, relapsed; n = 7, no response) and low CD19 H-score ( ≤ median; right; n = 24, ongoing response; n = 31, relapsed; n = 8, no response). Box plots show Q1, median, and Q3, and the lower and upper whiskers show Q1-1.5(IR) and Q3 + 1.5(IR), respectively; n values reflect the number of independent patients in each respective group. Two-sided P values were calculated per Kruskal-Wallis test and are reported. Axi-cel, axicabtagene ciloleucel; GES, gene expression signature; IR, interquartile range; Q, quartile.
Extended Data Fig. 6
Extended Data Fig. 6. High SPD or LDH tumors were less immune infiltrated.
Panels a and b show the relation of SPD (Panel a) or LDH (Panel b) with GES, as indicated. The volcano plots present descriptive two-sided P value over Spearman’s R. APM, antigen presentation machinery; DC, dendritic cell; LDH, lactate dehydrogenase; IDO1, indoleamine 2,3-dioxygenase 1; IFN, interferon; IS, ImmunoSign; JAKSTAT, Janus kinase signal transducer and activator of transcription; MHC, major histocompatibility complex; NK, natural killer; NOS, nitric oxide synthase; PD, programmed death; PD-L, programmed death-ligand; SPD, sum of product diameters; TGF, transforming growth factor; Th1, T helper type 1; TIS, tumor inflammation signature.
Extended Data Fig. 7
Extended Data Fig. 7. B-cell signature, BPI, CD19 expression and SII association with EFS following axi-cel treatment by timing of biopsy collection.
Panel a shows the association of B-cell signature, BPI, CD19 expression as mRNA or H-score, or SII with EFS following axi-cel treatment, stratified by tumor biopsy collection timing: either before (initial diagnosis) or after 1 L treatment versus overall. For each subgroup, the number of independent patients with an event >median or ≤median are reported within the figure out of the total number of patients in each respective subgroup (ie, n with event/N total for the subgroup). Panel b-e show the Kaplan-Meier estimates of EFS for select biomarkers (as indicated), limited to patients with biopsy collected after 1 L treatment, before lymphodepletion chemotherapy (proximal to axi-cel treatment). Unstratified Cox proportional hazards P values (two-sided) are presented. For panels b-e, patients who did not meet the criteria for an event had their data censored (tick marks). axi-cel, axicabtagene ciloleucel; CI, confidence interval; EFS, event-free survival; HR, hazard ratio.
Extended Data Fig. 8
Extended Data Fig. 8. APM IO360™ signature association with EFS following SOC treatment by timing of biopsy collection.
Panel a shows the association of APM IO360™ signature with EFS following SOC treatment stratified by tumor biopsy collection timing: either before (initial diagnosis) or after 1 L treatment versus overall. For each subgroup, the number of independent patients with an event >median or ≤median are reported within the figure out of the total number of patients in each respective subgroup (ie, n with event/N total for the subgroup). Panel b shows the Kaplan-Meier estimate of EFS by APM, limited to patients with biopsy collected after 1 L treatment. Unstratified Cox proportional hazards P value (two-sided) is presented. Patients who did not meet the criteria for an event had their data censored (tick marks). CI, confidence interval; EFS, event-free survival; HR, hazard ratio; SOC, standard of care.
Extended Data Fig. 9
Extended Data Fig. 9. CD19 association with TME inflammation by timing of biopsy collection.
Panels a and b show the fold change and descriptive two-sided P value (assessed via Wilcoxon test) for each GES that was significantly (P < 0.05) associated with CD19 H-score in at least one of the subgroups based on timing of biopsy collection, overall, before first-line therapy (initial diagnosis), or after first-line therapy. Panel c shows a venn diagram for the overlap of the significant associations across the 3 groups.
Extended Data Fig. 10
Extended Data Fig. 10. Axi-cel was not impacted by COO molecular subclass.
Figure shows the Kaplan-Meier estimate of EFS by GCB status and treatment arm (axi-cel versus SOC). Patients who do not meet the criteria for an event had their data censored (tick marks). Unstratified Cox proportional hazards P values (two-sided) are presented. axi-cel, axicabtagene ciloleucel; CI, confidence interval; EFS, event-free survival; GCB, germinal center B cell-like; HR, hazard ratio; SOC, standard of care.

Similar articles

Cited by

References

    1. Locke FL, et al. Axicabtagene ciloleucel as second-line therapy for large B-cell lymphoma. N. Engl. J. Med. 2022;386:640–654. - PubMed
    1. Chan A, Dogan A. Prognostic and predictive biomarkers in diffuse large B-cell lymphoma. Surg. Pathol. Clin. 2019;12:699–707. - PMC - PubMed
    1. Park JH, et al. The highest prognostic impact of LDH among International Prognostic Indices (IPIs): an explorative study of five IPI factors among patients with DLBCL in the era of rituximab. Ann. Hematol. 2014;93:1755–1764. - PubMed
    1. Hashwah H, et al. The IL-6 signaling complex is a critical driver, negative prognostic factor, and therapeutic target in diffuse large B-cell lymphoma. EMBO Mol. Med. 2019;11:e10576. - PMC - PubMed
    1. Troppan KT, et al. C-reactive protein level is a prognostic indicator for survival and improves the predictive ability of the R-IPI score in diffuse large B-cell lymphoma patients. Br. J. Cancer. 2014;111:55–60. - PMC - PubMed

Substances