

COVID-19 detection from chest X-ray images using CLAHE-YCrCb, LBP, and machine learning algorithms
- PMID: 38233764
- PMCID: PMC10792799
- DOI: 10.1186/s12859-023-05427-5
COVID-19 detection from chest X-ray images using CLAHE-YCrCb, LBP, and machine learning algorithms
Abstract
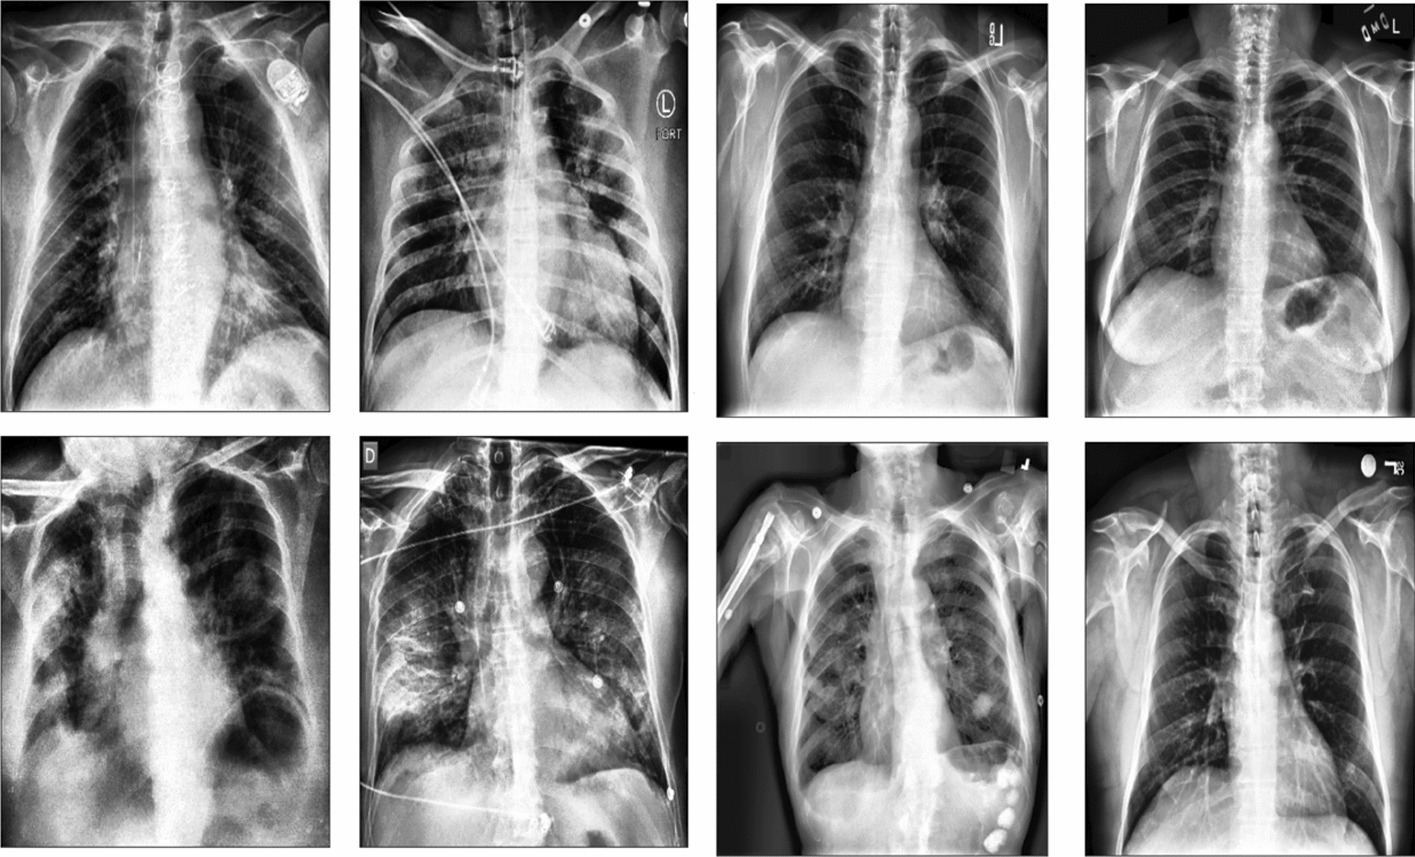
Background: COVID-19 is a disease that caused a contagious respiratory ailment that killed and infected hundreds of millions. It is necessary to develop a computer-based tool that is fast, precise, and inexpensive to detect COVID-19 efficiently. Recent studies revealed that machine learning and deep learning models accurately detect COVID-19 using chest X-ray (CXR) images. However, they exhibit notable limitations, such as a large amount of data to train, larger feature vector sizes, enormous trainable parameters, expensive computational resources (GPUs), and longer run-time.
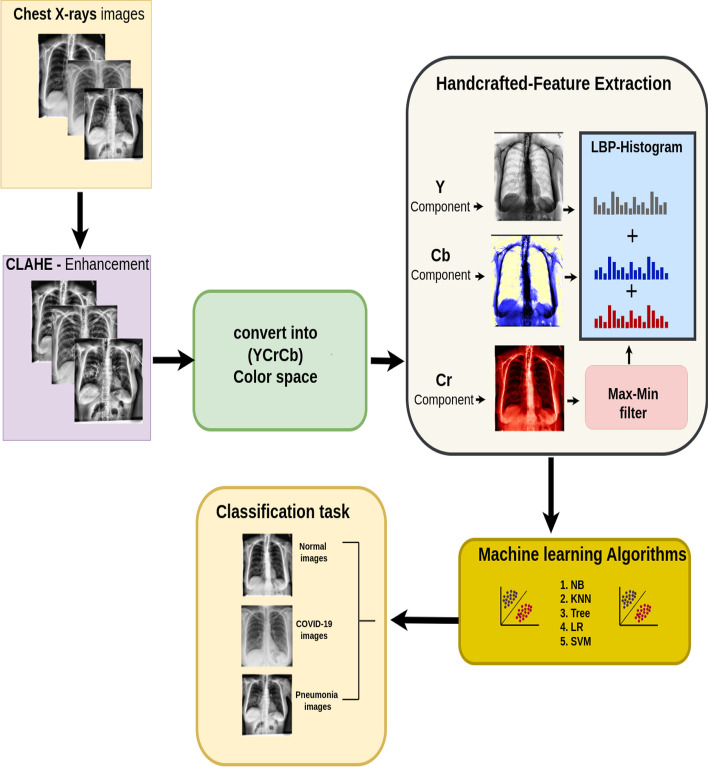
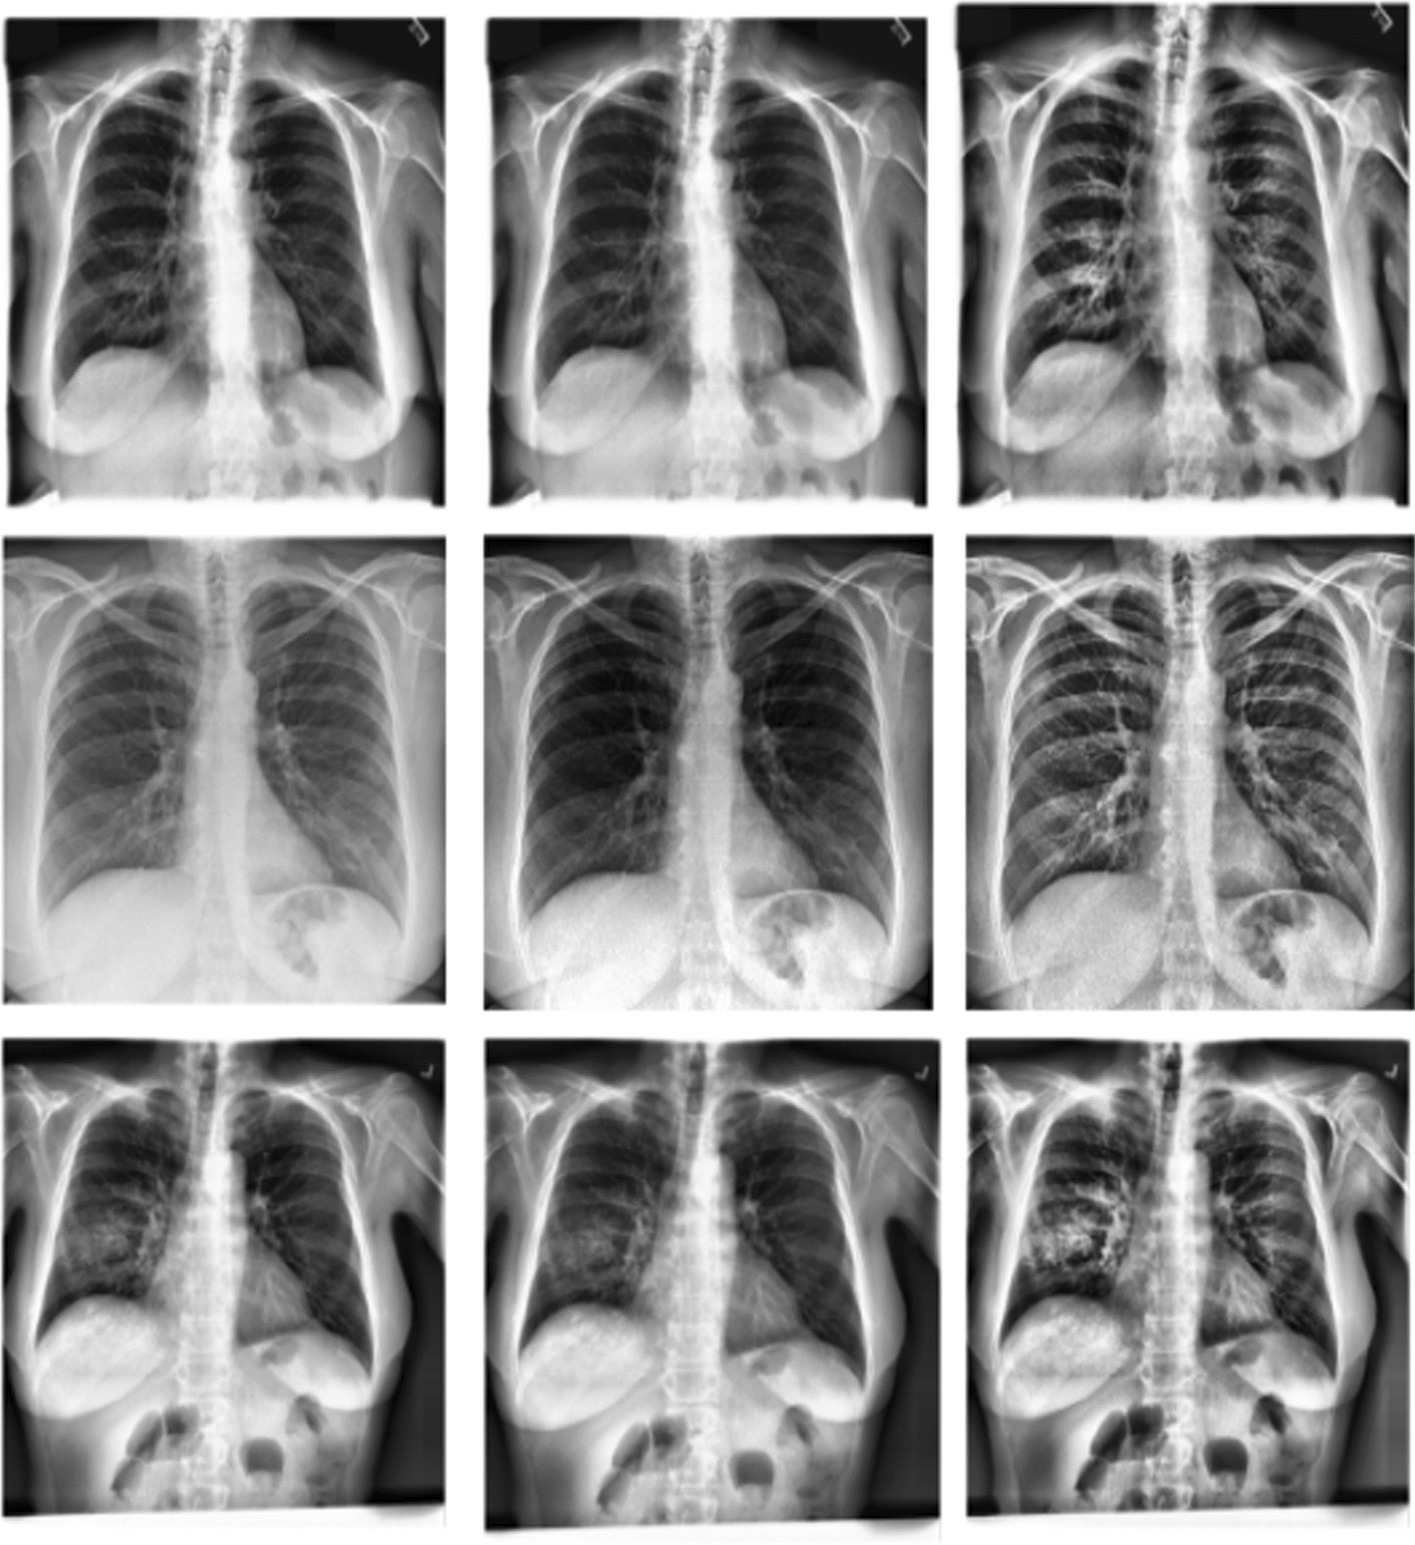
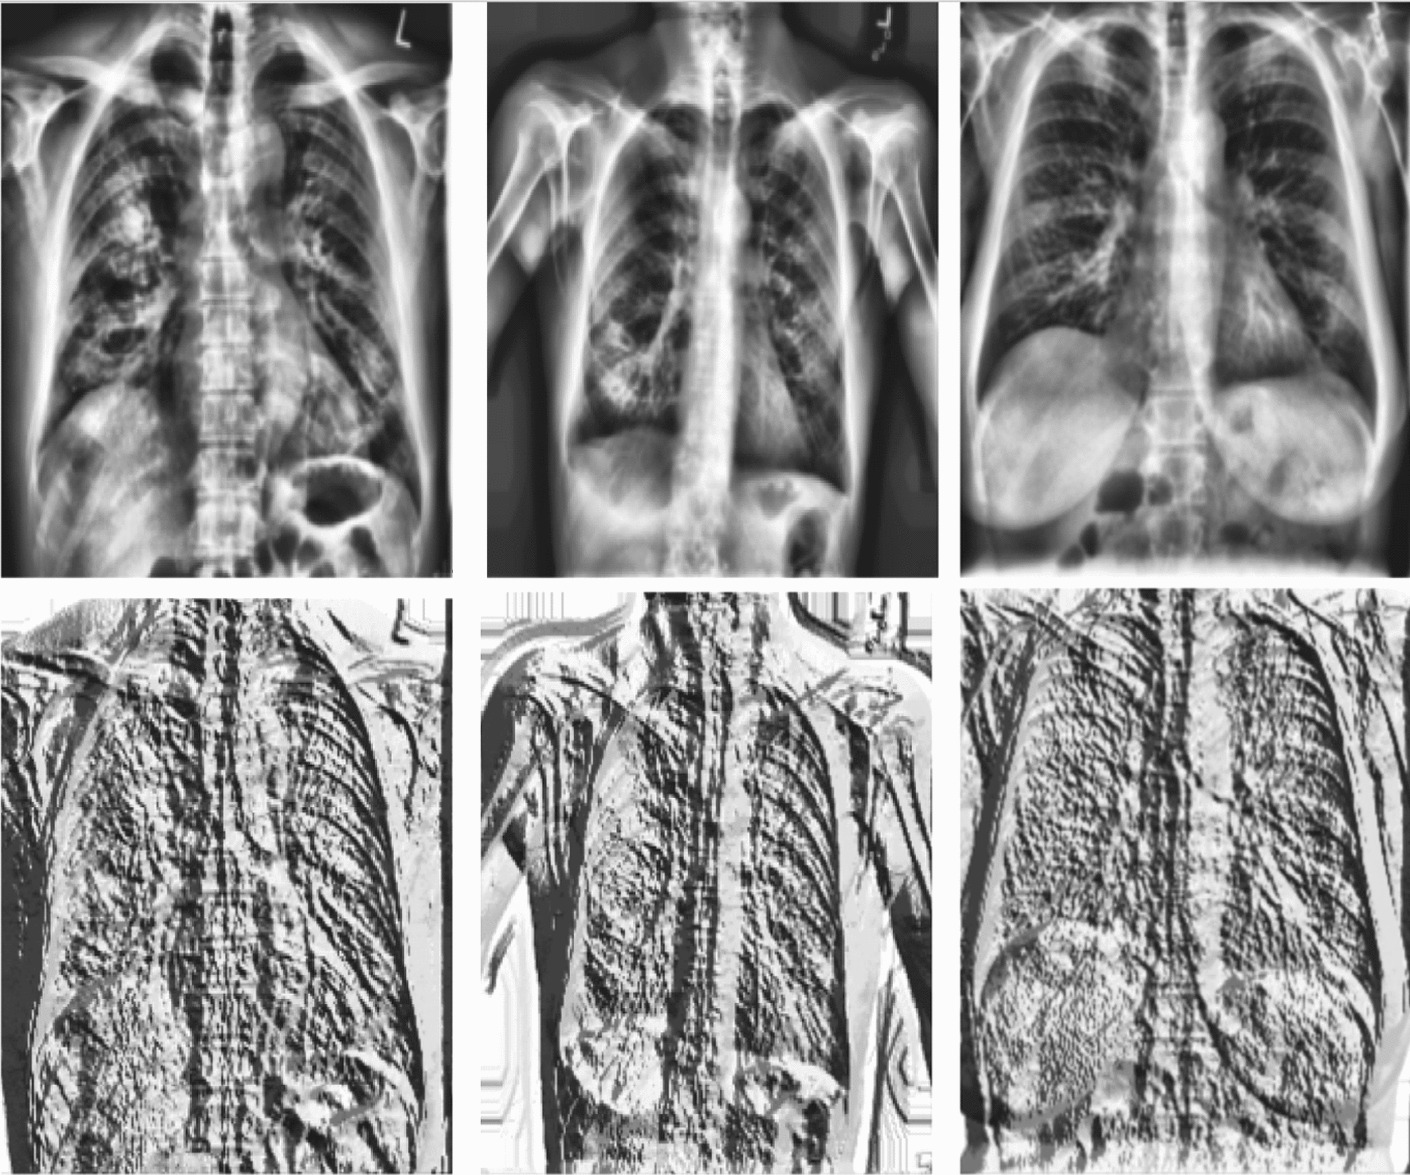
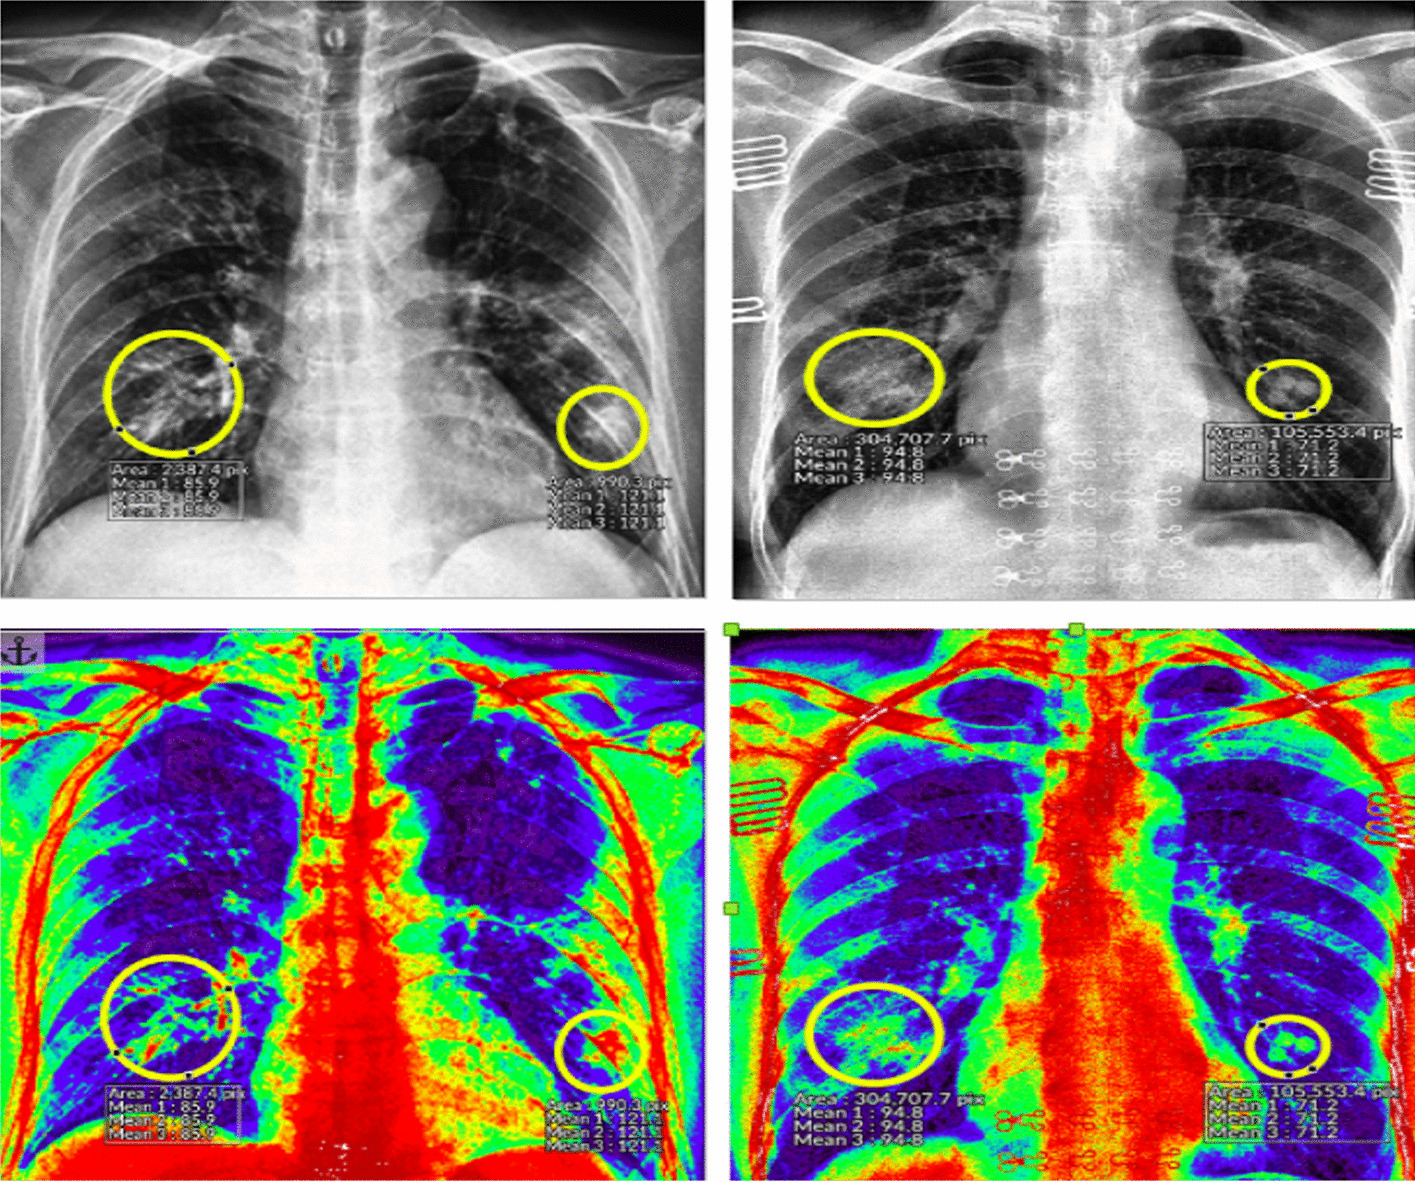
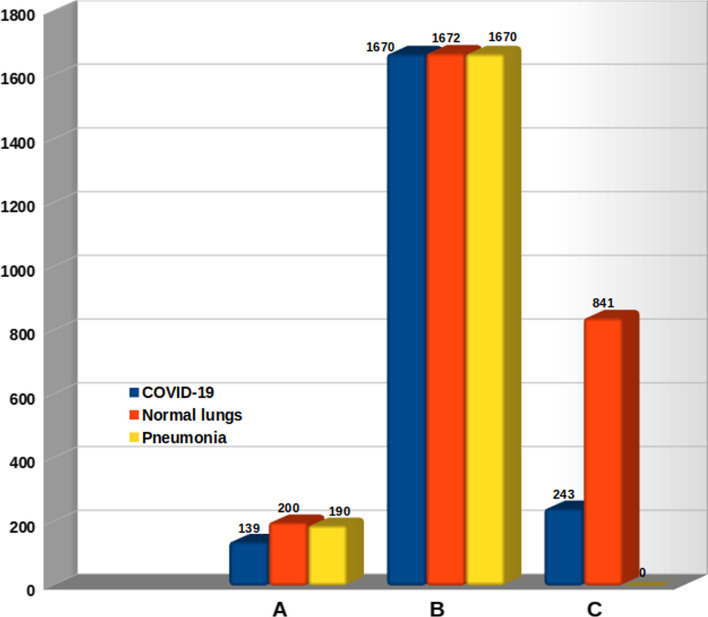
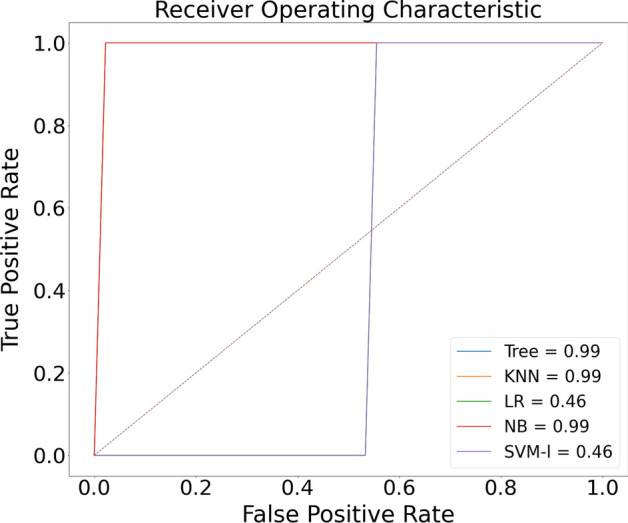
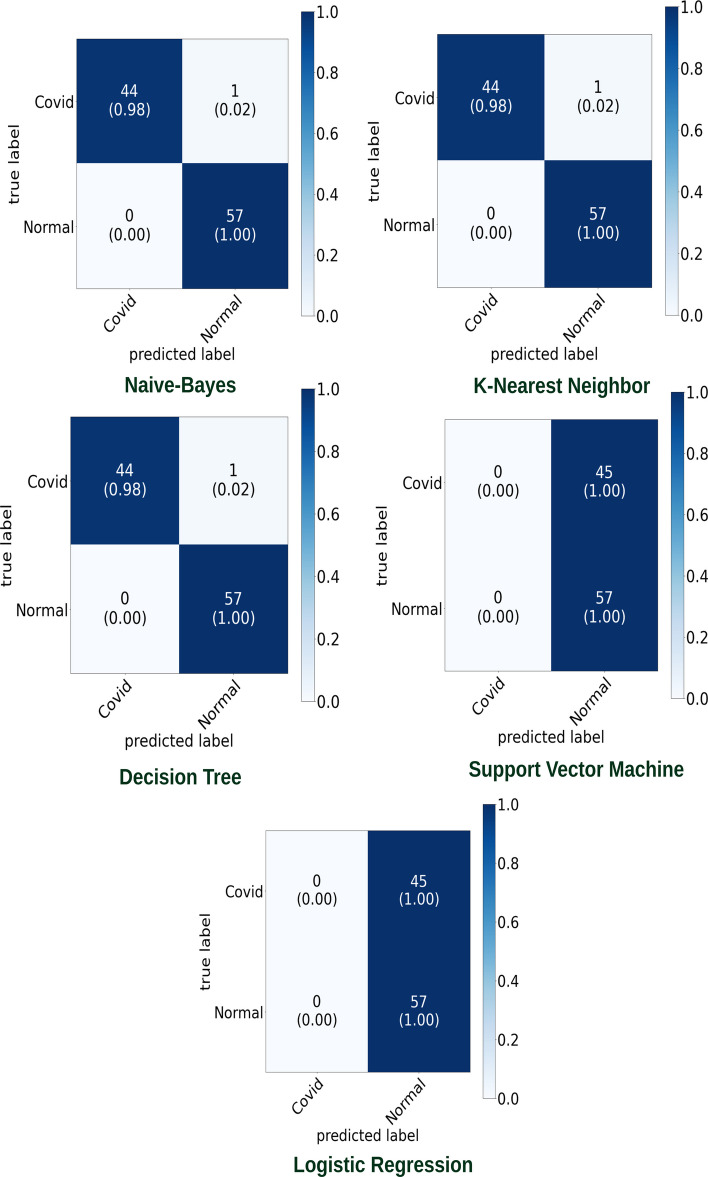
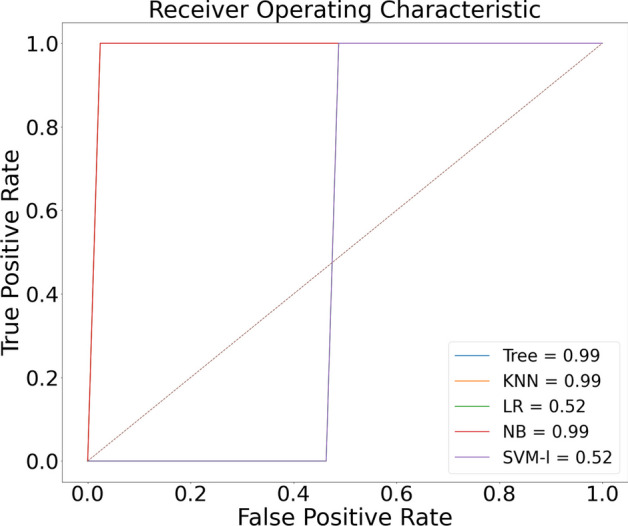
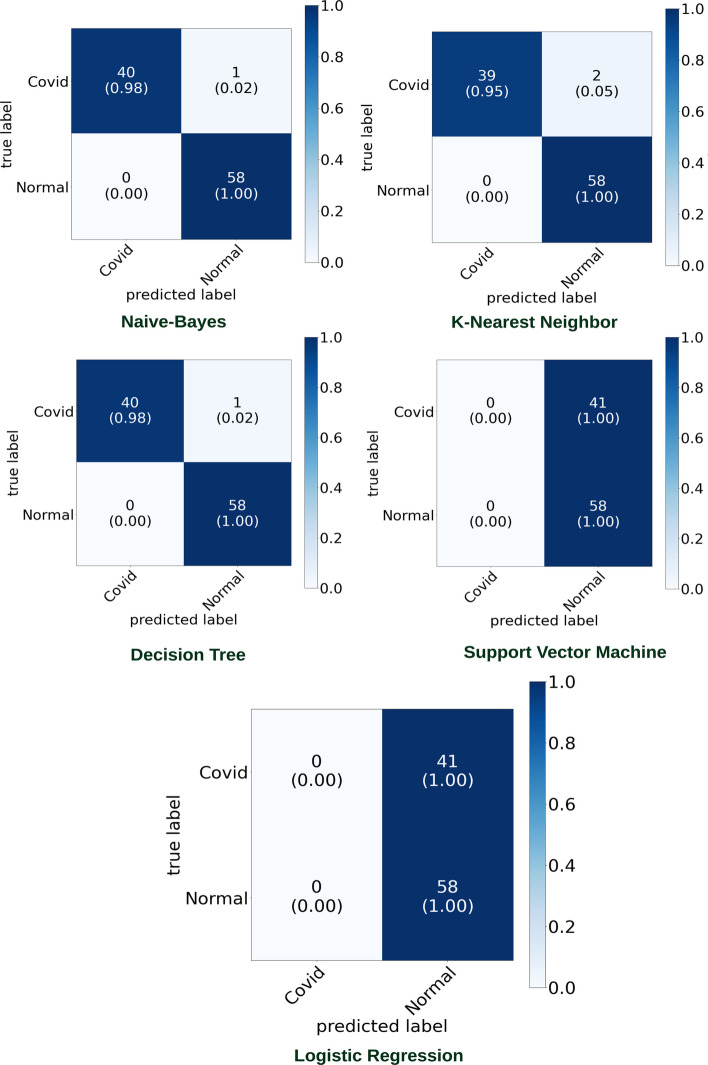
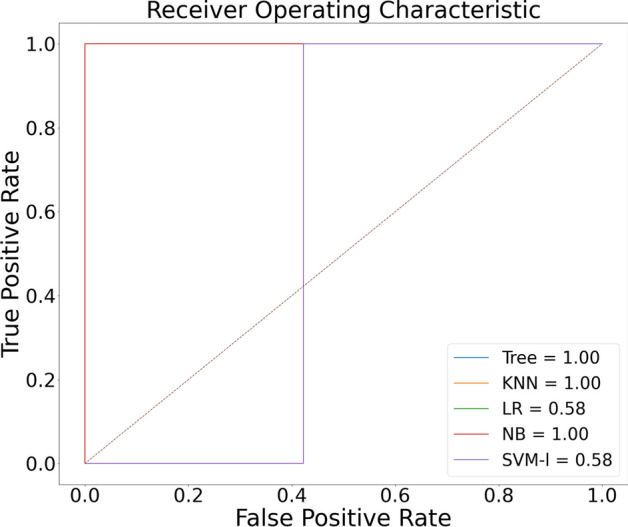
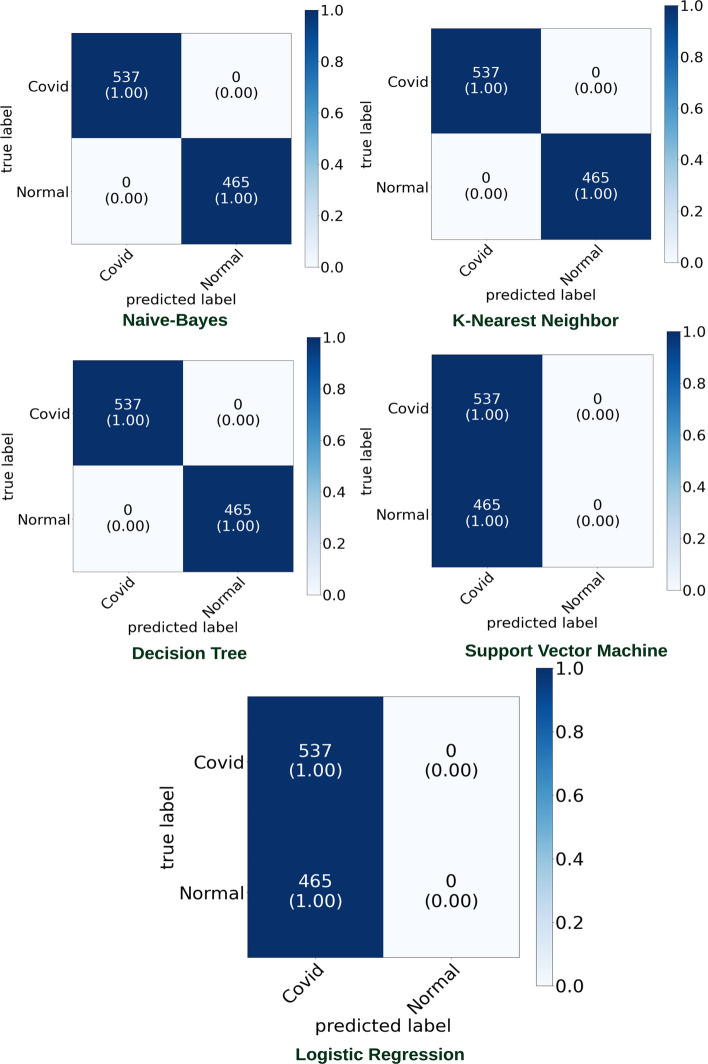
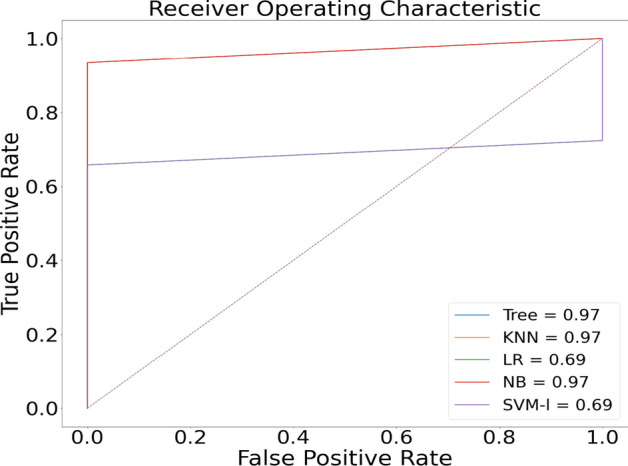
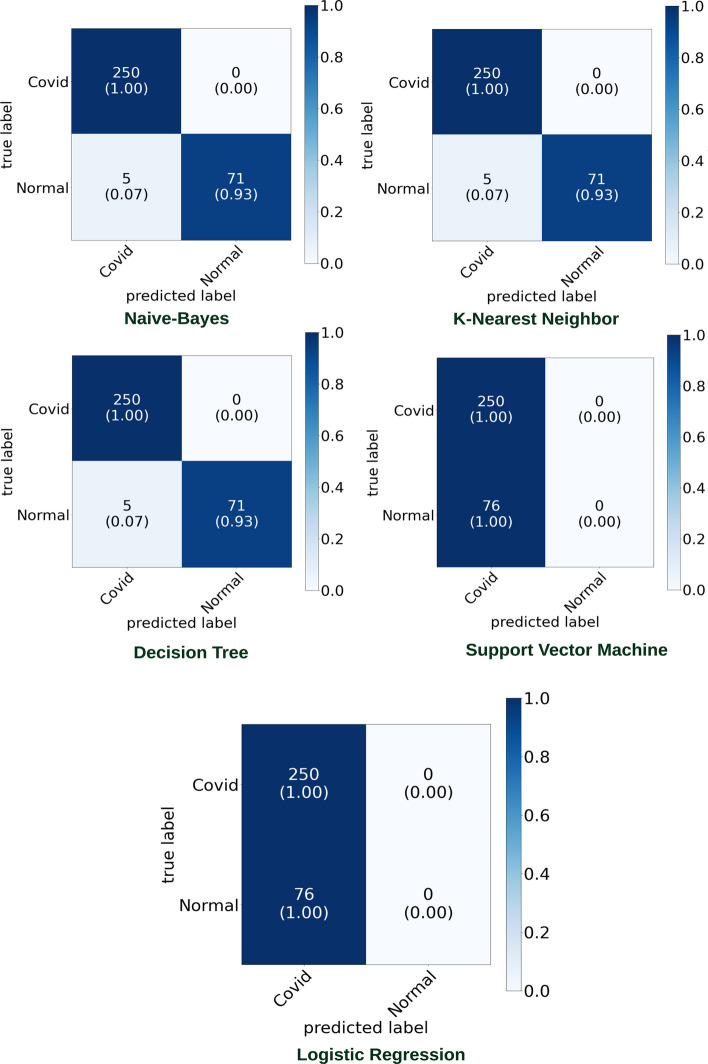
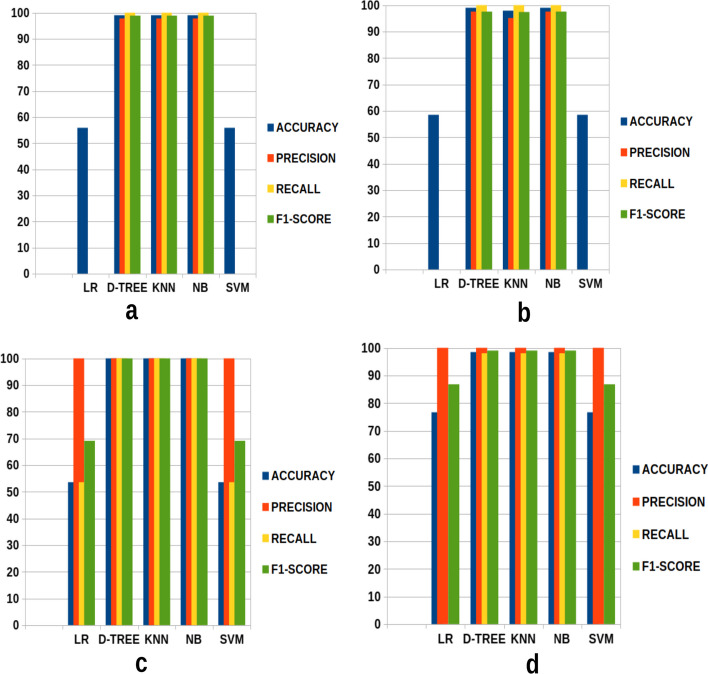
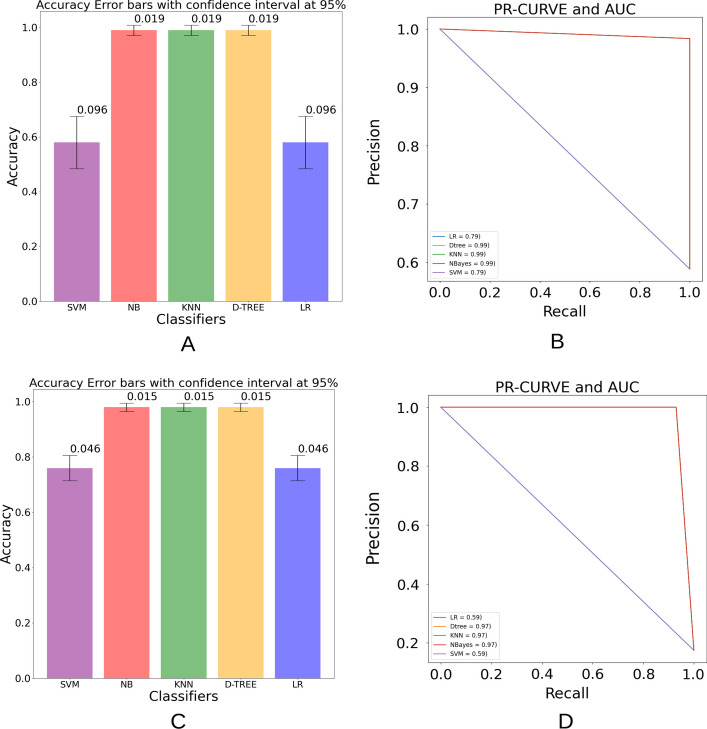
Results: In this study, we proposed a new approach to address some of the above-mentioned limitations. The proposed model involves the following steps: First, we use contrast limited adaptive histogram equalization (CLAHE) to enhance the contrast of CXR images. The resulting images are converted from CLAHE to YCrCb color space. We estimate reflectance from chrominance using the Illumination-Reflectance model. Finally, we use a normalized local binary patterns histogram generated from reflectance (Cr) and YCb as the classification feature vector. Decision tree, Naive Bayes, support vector machine, K-nearest neighbor, and logistic regression were used as the classification algorithms. The performance evaluation on the test set indicates that the proposed approach is superior, with accuracy rates of 99.01%, 100%, and 98.46% across three different datasets, respectively. Naive Bayes, a probabilistic machine learning algorithm, emerged as the most resilient.
Conclusion: Our proposed method uses fewer handcrafted features, affordable computational resources, and less runtime than existing state-of-the-art approaches. Emerging nations where radiologists are in short supply can adopt this prototype. We made both coding materials and datasets accessible to the general public for further improvement. Check the manuscript's availability of the data and materials under the declaration section for access.
Keywords: CLAHE; COVID-19; HE; LBP; Max–Min filter; YCrCb.
© 2024. The Author(s).
Conflict of interest statement
The authors declare that they have no competing interests.
Figures
Similar articles
-
SVD-CLAHE boosting and balanced loss function for Covid-19 detection from an imbalanced Chest X-Ray dataset.Comput Biol Med. 2022 Nov;150:106092. doi: 10.1016/j.compbiomed.2022.106092. Epub 2022 Sep 28. Comput Biol Med. 2022. PMID: 36208598 Free PMC article.
-
LCSB-inception: Reliable and effective light-chroma separated branches for Covid-19 detection from chest X-ray images.Comput Biol Med. 2022 Nov;150:106195. doi: 10.1016/j.compbiomed.2022.106195. Epub 2022 Oct 14. Comput Biol Med. 2022. PMID: 37859288 Free PMC article.
-
An Analysis of New Feature Extraction Methods Based on Machine Learning Methods for Classification Radiological Images.Comput Intell Neurosci. 2022 May 25;2022:3035426. doi: 10.1155/2022/3035426. eCollection 2022. Comput Intell Neurosci. 2022. PMID: 35634075 Free PMC article.
-
Machine and Deep Learning for Tuberculosis Detection on Chest X-Rays: Systematic Literature Review.J Med Internet Res. 2023 Jul 3;25:e43154. doi: 10.2196/43154. J Med Internet Res. 2023. PMID: 37399055 Free PMC article.
-
COVID-19: A Comprehensive Review of Learning Models.Arch Comput Methods Eng. 2022;29(3):1915-1940. doi: 10.1007/s11831-021-09641-3. Epub 2021 Sep 18. Arch Comput Methods Eng. 2022. PMID: 34566404 Free PMC article. Review.
References
-
- Worldometer. COVID-19 corona virus pandemic: coronavirus cases. https://www.worldometers.info/coronavirus/. Accessed 28 March 2022.
-
- Aggarwal S, Gupta S, Alhudhaif A, Koundal D, Gupta R, Polat K. Automated COVID-19 detection in chest X-ray images using fine-tuned deep learning architectures. Expert Syst. 2022;39(3):12749. doi: 10.1111/exsy.12749. - DOI
-
- Kameswari S, Brundha M, Ezhilarasan D. Advantages and disadvantages of RT-PCR in COVID 19. Eur J Mol Clin Med. 2020;7:1174–1181.
-
- Purohit K, Kesarwani A, Ranjan Kisku D, Dalui M. Covid-19 detection on chest X-ray and CT scan images using multi-image augmented deep learning model. In: Proceedings of the seventh international conference on mathematics and computing. Springer; 2022. p. 395–413.
-
- Jones JL. Reverse transcription polymerase chain reaction. https://www.sciencedirect.com/topics/agricultural-and-biological-science.... Accessed 20 June 2022.
MeSH terms
Grants and funding
LinkOut - more resources
Full Text Sources
Medical
Miscellaneous
