[Preprint]. 2023 Dec 27:2023.12.22.23300468.
doi: 10.1101/2023.12.22.23300468.

A cell type-aware framework for nominating non-coding variants in Mendelian regulatory disorders

Affiliations

A cell type-aware framework for nominating non-coding variants in Mendelian regulatory disorders

Arthur S Lee et al. medRxiv. .

Update in

  • A cell type-aware framework for nominating non-coding variants in Mendelian regulatory disorders.
    Lee AS, Ayers LJ, Kosicki M, Chan WM, Fozo LN, Pratt BM, Collins TE, Zhao B, Rose MF, Sanchis-Juan A, Fu JM, Wong I, Zhao X, Tenney AP, Lee C, Laricchia KM, Barry BJ, Bradford VR, Jurgens JA, England EM, Lek M, MacArthur DG, Lee EA, Talkowski ME, Brand H, Pennacchio LA, Engle EC. Lee AS, et al. Nat Commun. 2024 Sep 27;15(1):8268. doi: 10.1038/s41467-024-52463-7. Nat Commun. 2024. PMID: 39333082 Free PMC article.

Abstract

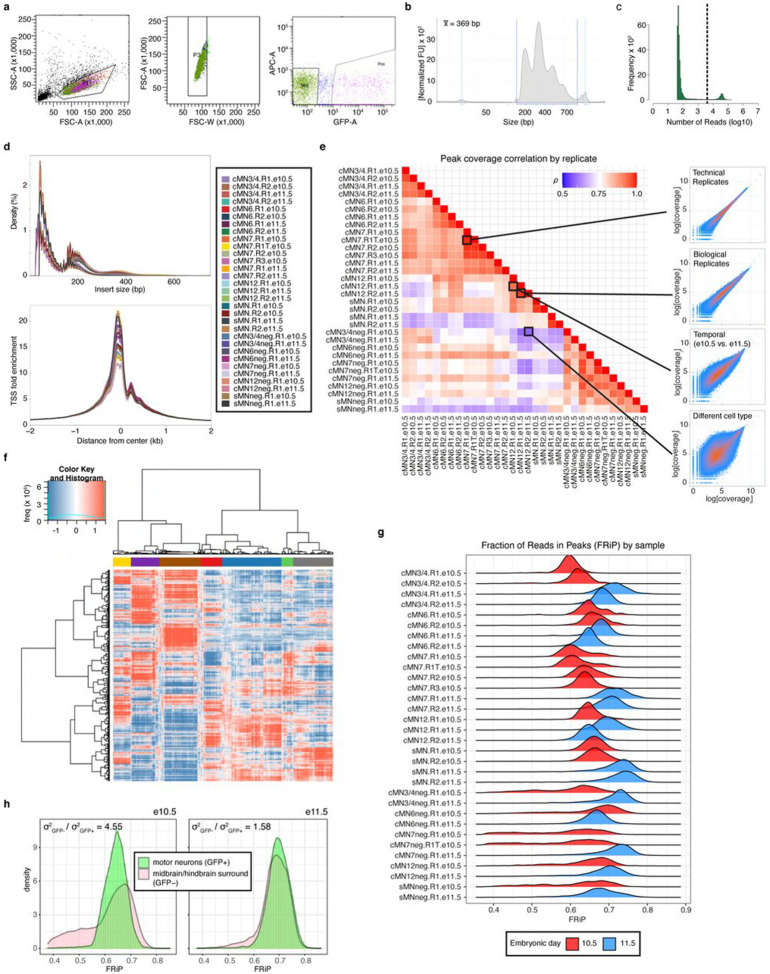
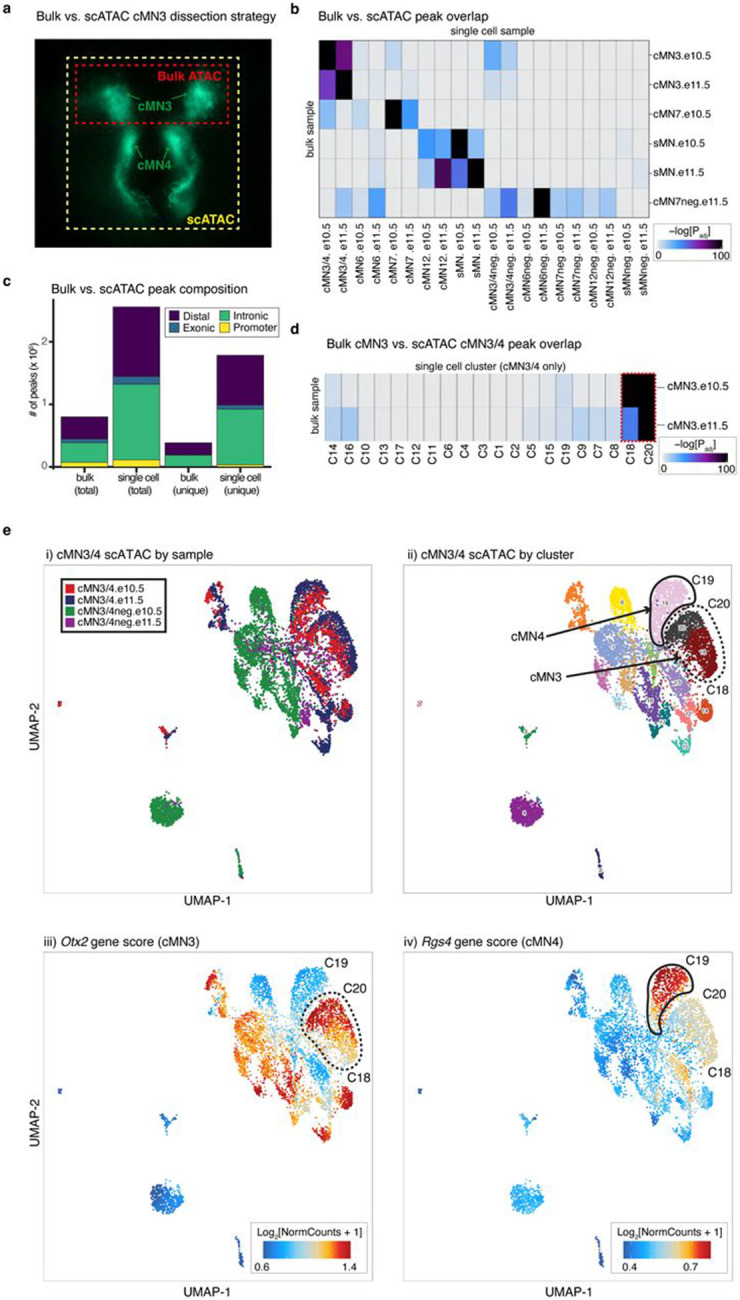
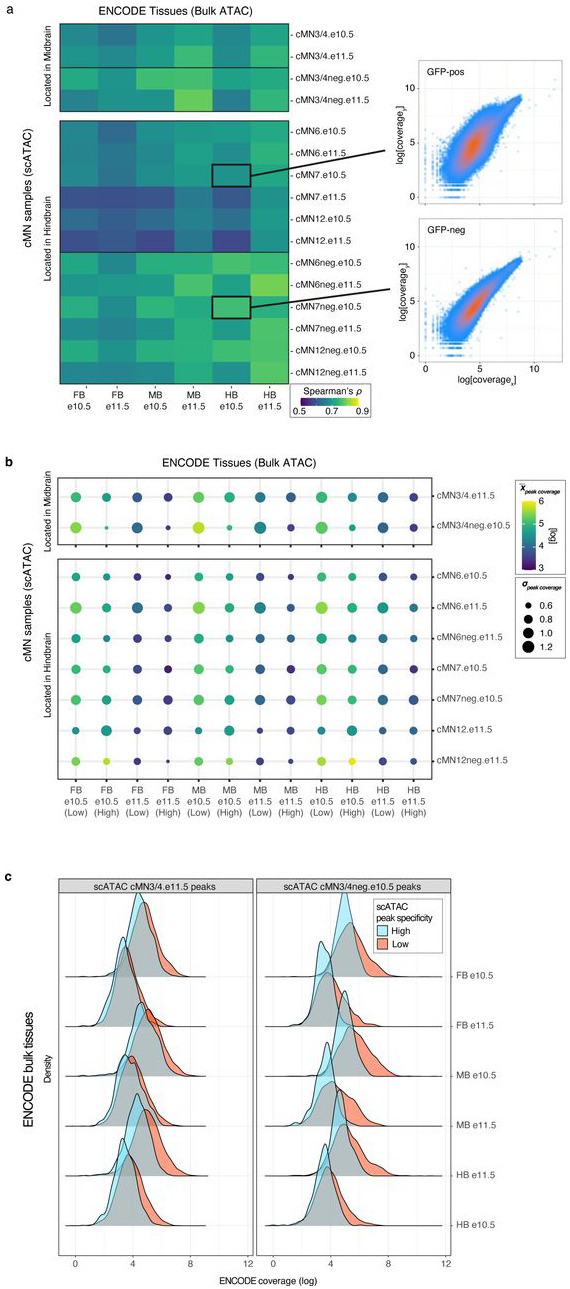
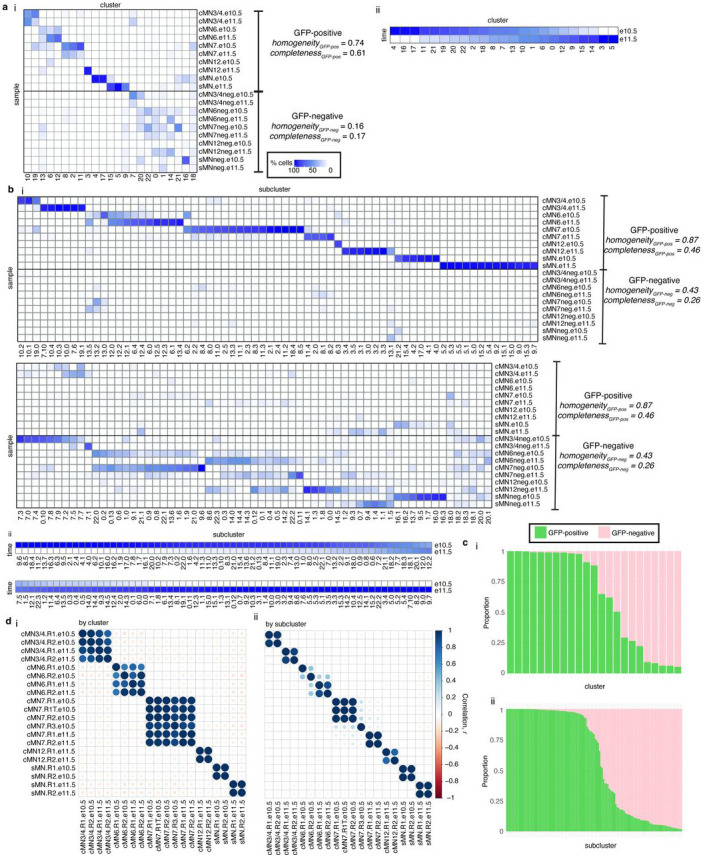
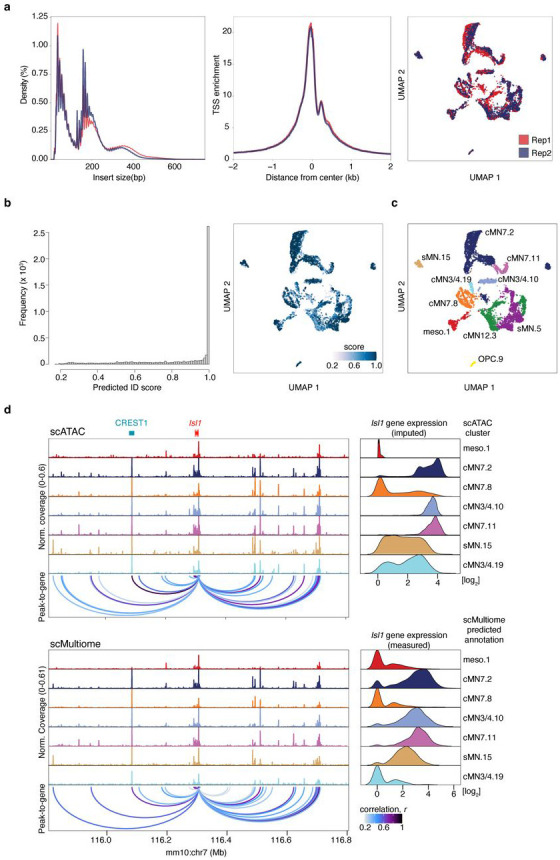
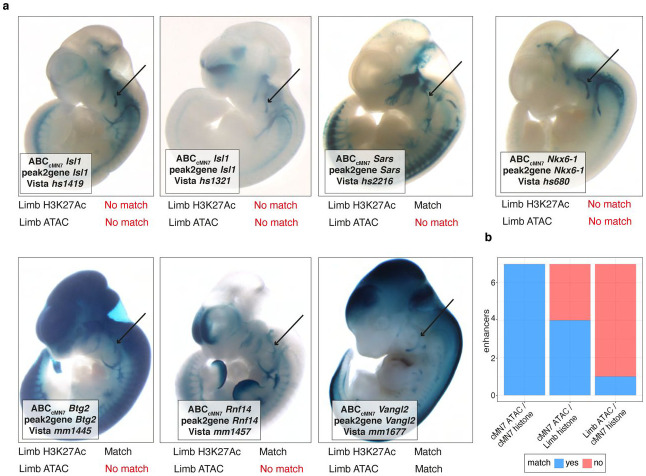
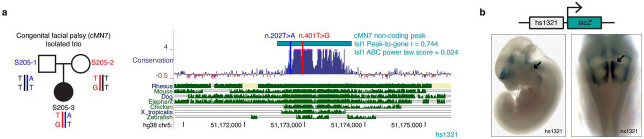
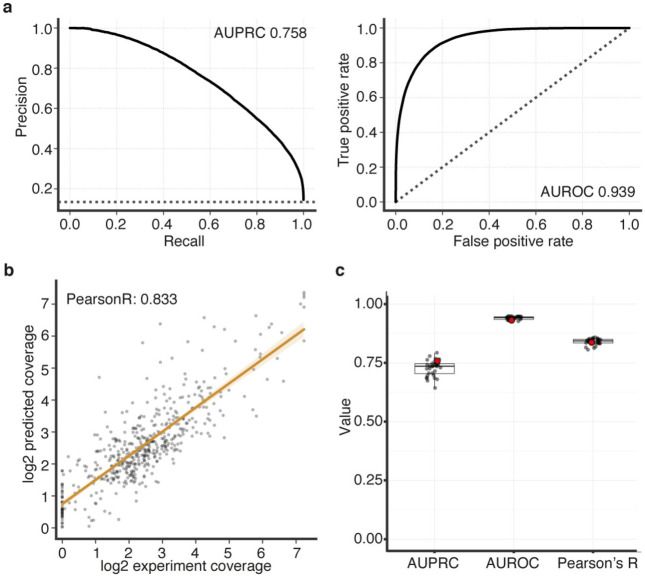
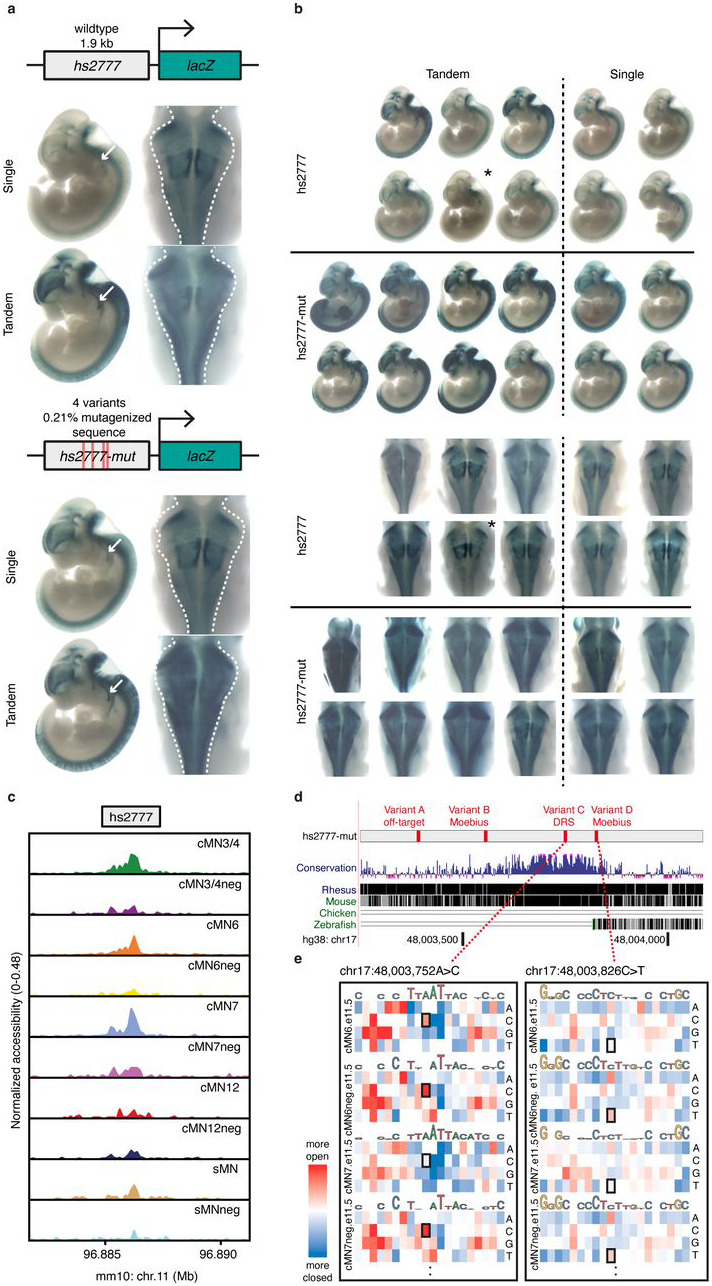
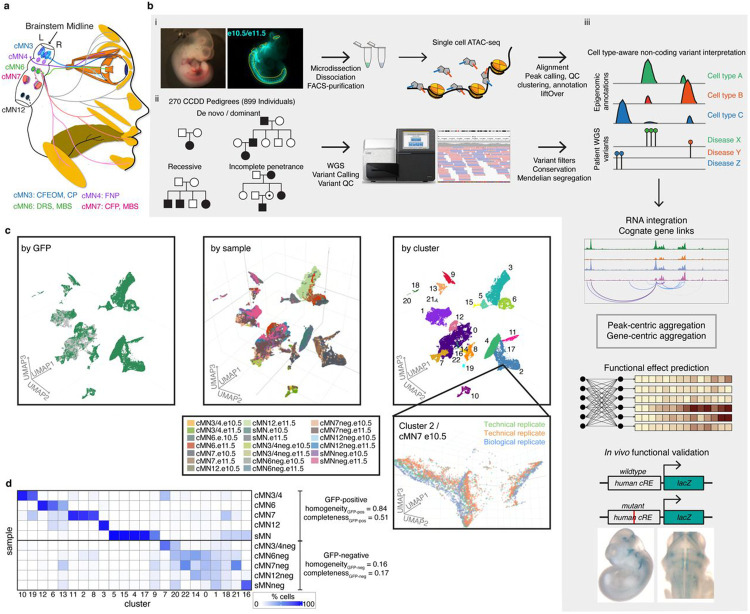
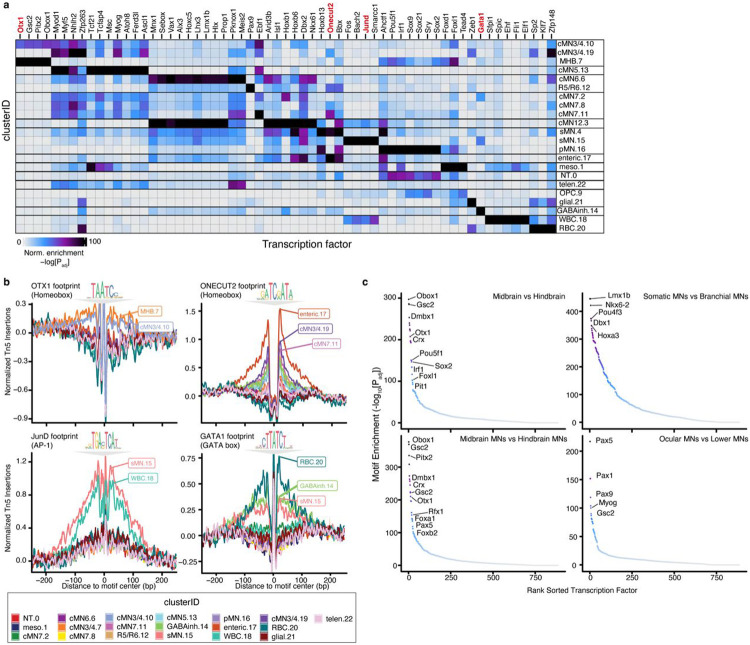
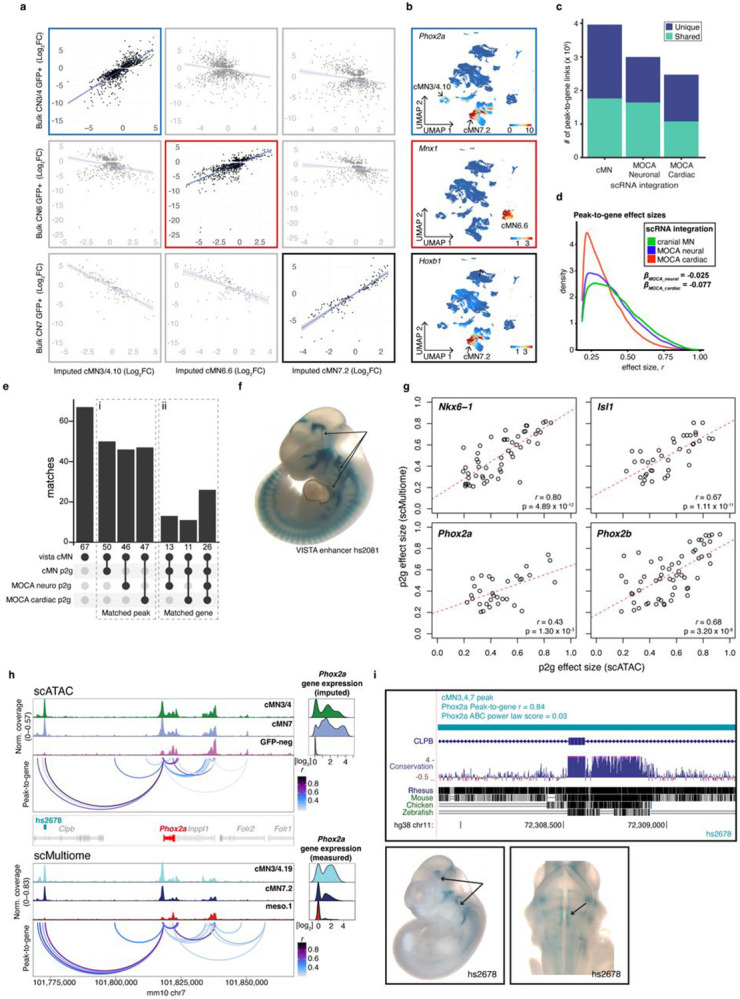
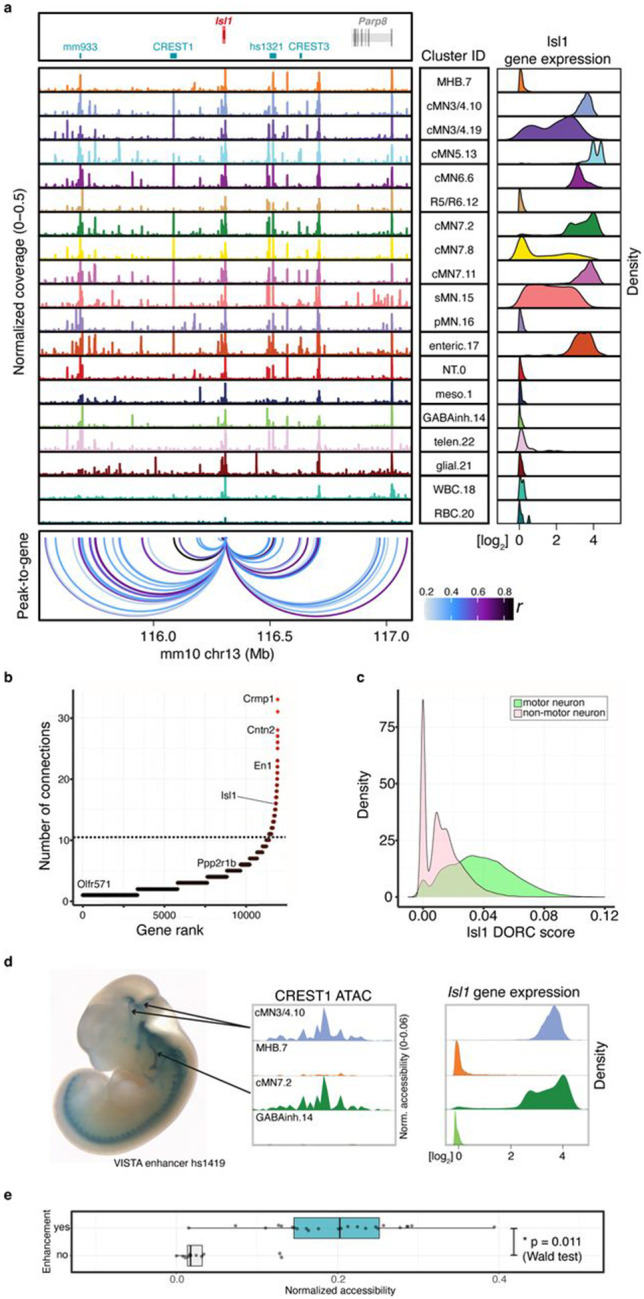
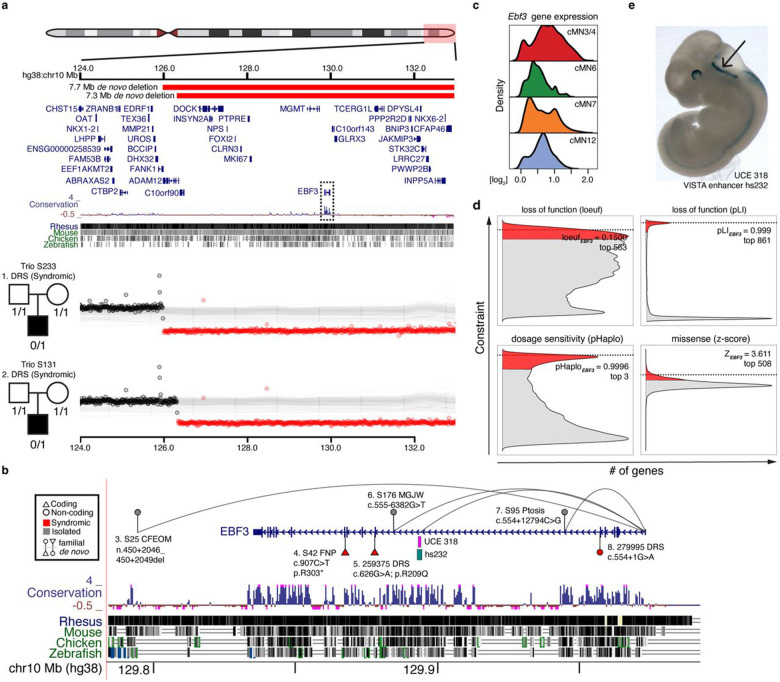
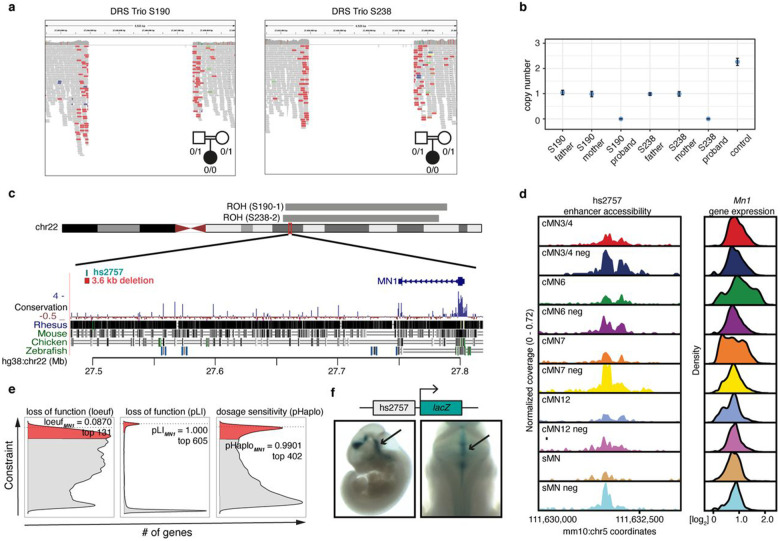
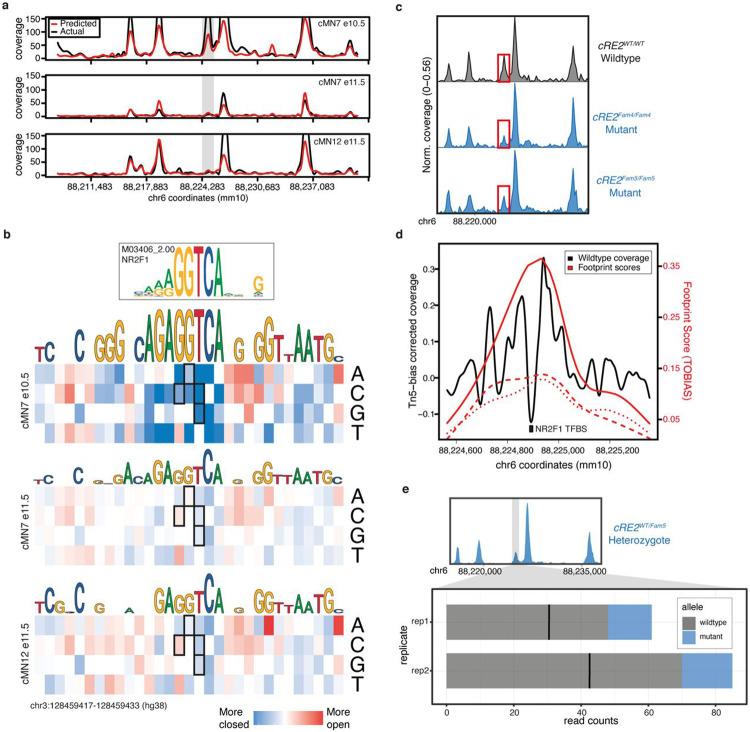
Unsolved Mendelian cases often lack obvious pathogenic coding variants, suggesting potential non-coding etiologies. Here, we present a single cell multi-omic framework integrating embryonic mouse chromatin accessibility, histone modification, and gene expression assays to discover cranial motor neuron (cMN) cis-regulatory elements and subsequently nominate candidate non-coding variants in the congenital cranial dysinnervation disorders (CCDDs), a set of Mendelian disorders altering cMN development. We generated single cell epigenomic profiles for ~86,000 cMNs and related cell types, identifying ~250,000 accessible regulatory elements with cognate gene predictions for ~145,000 putative enhancers. Seventy-five percent of elements (44 of 59) validated in an in vivo transgenic reporter assay, demonstrating that single cell accessibility is a strong predictor of enhancer activity. Applying our cMN atlas to 899 whole genome sequences from 270 genetically unsolved CCDD pedigrees, we achieved significant reduction in our variant search space and nominated candidate variants predicted to regulate known CCDD disease genes MAFB, PHOX2A, CHN1, and EBF3 - as well as new candidates in recurrently mutated enhancers through peak- and gene-centric allelic aggregation. This work provides novel non-coding variant discoveries of relevance to CCDDs and a generalizable framework for nominating non-coding variants of potentially high functional impact in other Mendelian disorders.


Figures

Extended Data Figure 1.
Extended Data Figure 1.. Per-cell and -sample quality metrics for scATAC data.
a. Representative FACS gating strategy for WT GFP-positive and GFP-negative cMN7 at e10.5. Left: Forward scatter area (FSC-A) and side scatter area (SSC-A), corresponding to cell size and granularity/complexity, are used to enrich for intact cells and exclude debris. Middle: forward scatter width (FSC-W) and FSC-A are used to exclude doublets. Right: Green fluorescent protein area (GFP-A) and 633 nm-excitation (APC-A) are used to enrich for GFP-positive and GFP-negative cells. GFP-negative gates are calibrated by dissociated limb buds prior to collection as a negative control. All samples are fresh, live cells without fixative or nuclear staining. b. Representative TapeStation trace showing tagmented DNA fragment sizes prior to library preparation. c. Representative histogram of per-cell scATAC reads in a single sample. Read cutoff is shown by a dotted line and determined heuristically for each sample. d. Insert size distributions (top) and transcriptional start site (TSS) enrichment (bottom) for all samples and replicates. Insert sizes consistently show a characteristic nucleosome banding pattern (~147 bp wavelength). Samples IDs are shown in Supplementary Table 2. e. Correlation matrix depicting all possible pairwise sample correlations (Spearman’s rho) for scATAC coverage in all rank-ordered peaks. Scatterplots for selected sample pairs from the four highlighted boxes within the matrix are shown on the right. Correlations decrease with increasing biological distance (top to bottom). f. Representative clade diagram depicting the relative accessibility (red is positive, blue is negative) of 5kb genomic windows (rows) across individual cells within a given sample (columns). Distinct clades (colored bars) were determined heuristically for each sample for downstream peak calling. The number of clades per sample were selected to maximize representation of common and rare cell types. g. Ridgeplot depicting density of per-cell fraction of reads in peaks (FRiP) for each dissected sample and replicate at e10.5 (red) and e11.5 (blue). Samples IDs are shown in Supplementary Table 2. Mean FRiP values are consistently higher for e11.5 samples (p-value = 4 x 10⁻⁵, binomial test). h. Distribution of FRiP values for GFP-positive motor neurons (green) versus GFP-negative surrounding brain tissue (pink). GFP-negative cells display significantly greater dispersion compared to GFP-positive cells, particularly at e10.5. (p-value = 1.1x10−286, Brown-Forsythe Test). See Supplementary Note 1 for additional information.
Extended Data Figure 2.
Extended Data Figure 2.. Comparing and contrasting bulk versus single cell ATAC profiles.
a. Fluorescence microscopy image illustrating cMN3 and cMN4 microdissection strategies. For scATAC experiments, cMN3 and cMN4 were microdissected en bloc (yellow box). For bulk ATAC microdissections, only cMN3 was excised (red box). All other cMN microdissection strategies were identical across bulk and scATAC. b. Heatmap depicting enrichment of sample-specific bulk ATAC versus scATAC peaks. Color scale represents hypergeometric test p-values using the peakAnnoEnrichment() function in ArchR. Samples marked with “neg” are GFP-negative cells surrounding the motor neurons of interest. All other samples are GFP-positive motor neurons. c. Stacked barplot depicting relative proportions of different classes of accessible chromatin (“distal”, “exonic”, “intronic”, and “promoter”). scATAC peaks are enriched for total number of peaks, total number of unique peaks, and cell type-specific peak annotations (distal and intronic). d. Heatmap depicting enrichment of overlapping peaks for bulk cMN3 dissections versus ad hoc clusters (C1-C20) generated from scATAC cMN3/4 dissections only. Color scale represents hypergeometric test p-values. Ad hoc clusters C18 and C20 with the highest peak enrichment for bulk cMN3 are outlined by dashed red lines. e. In silico microdissection of scATAC cMN3/4 clusters corroborates physical microdissections. Left to right, UMAP embeddings of scATAC cMN3/4 dissections colored by i) dissected sample; ii) ad hoc clusters; and gene scores for iii) cMN3 marker gene Otx2; and iv) cMN4 marker gene Rgs4. Putative cMN3 (C18 and C20) and cMN4 (C19) clusters inferred from dissection origin, marker genes, and GFP status are denoted by dashed and solid red lines, respectively.
Extended Data Figure 3.
Extended Data Figure 3.. Cranial motor neuron scATAC peaks are underrepresented in regional bulk datasets.
a. (Left) Heatmap depicting correlation coefficients (Spearman’s ρ) between scATAC peaks from cMN microdissections versus bulk ATAC peaks from ENCODE e10.5 and e11.5 mouse developing forebrain (FB), midbrain (MB), and hindbrain (HB) dissections. Anatomically concordant bulk brain regions are more highly correlated with scATAC non-motor neuron samples (‘−neg’) than scATAC cranial motor neuron samples. (Right) Scatterplots depicting rank-ordered per-peak sequencing coverage for bulk vs. scATAC samples. b. Bubble chart depicting ENCODE bulk ATAC coverage in scATAC cMN peaks from a subset of samples, stratified by cell type specificity scores (‘High’ vs. ‘Low’). Colors reflect mean peak coverage (with lighter color reflecting higher coverage), while area reflects standard deviation. Bulk tissues tend to have higher coverage in low specificity peaks when compared to highly cell type specific peaks. c. Density plots depicting distribution of ENCODE bulk peak coverage within cMN3/4 scATAC peaks from (b), stratified by specificity scores. High specificity scATAC peaks (blue) have consistently lower bulk coverage compared to low specificity peaks (red).
Extended Data Figure 4.
Extended Data Figure 4.. scATAC cluster purity across major clusters and subclusters.
a. Heatmaps depicting purity of the 23 major scATAC clusters, stratified by i) sample and ii) embryonic age. cMN7 cells migrate past cMN6, are in close spatial proximity at these developmental ages, and are commonly co-dissected. Samples are GFP-positive unless otherwise marked (‘neg’). Clusters with higher membership from GFP-positive samples have higher purity than clusters with higher membership from GFP-negative samples. Most clusters feature cells from both e10.5 and e11.5 dissections, consistent with ongoing cell birth and proliferation. Homogeneity/completeness metrics calculated for GFP-positive versus GFP-negative samples are shown. b. Heatmaps depicting purity of the 132 scATAC subclusters, stratified by i) sample and ii) embryonic age. As observed with the major clusters in (a), subclusters with high GFP-positive membership have greater purity than high GFP-negative subclusters. In contrast to the major clusters, a greater proportion of subclusters have skewed temporal membership (e10.5 vs. e11.5), potentially reflecting transient cell states. c. Stacked barplots depicting proportion of GFP-positive and -negative cells within each i) cluster and ii) subcluster. Most clusters and subclusters are skewed towards pure (i.e., > 90%) GFP-positive or −negative membership. Here Cluster/subcluster IDs are not shown for ease of visualization. Detailed cluster annotations are available in Supplementary Table 3. d. Correlation matrix depicting pairwise correlations between all biological replicates among i) major clusters and ii) subclusters. Cluster/subcluster membership is highly correlated across biological replicates from different batches, particularly for subclusters.
Extended Data Figure 5.
Extended Data Figure 5.. Single cell multiome reproducibility and quality control.
a. Chromatin fragment length distribution (left), transcription start site (TSS) enrichment (middle), and joint UMAP embedding (right) comparing scMultiome biological replicates (red and blue). Replicates are highly concordant. b. Histogram (left) and UMAP embedding (right) depicting distribution of scMultiome prediction ID scores of annotations transferred from the scATAC reference set to the scMultiome query set using the TransferData() function in Seurat. The distribution is heavily skewed towards higher scores. c. scMultiome annotations based on prediction IDs. Most predicted annotations correspond to Isl1MN:GFP-positive cell types, consistent with scMultiome dissection strategy. d. Direct comparison of peak-to-gene links from scATAC versus scMultiome for motor neuron master regulator Isl1. scATAC peak-to-gene links are generated from imputed gene expression values (“GeneIntegrationMatrix”) whereas scMultiome links are generated from direct gene expression measurements (“GeneExpressionMatrix”). Ground truth enhancer CREST1 is highly accessible in Isl1-positive clusters with strong peak-to-gene links across both modalities.
Extended Data Figure 6.
Extended Data Figure 6.. Toggling input data for Activity-by-Contact enhancer prediction.
a. Whole mount in vivo enhancer reporter expression for the seven VISTA Enhancers that are annotated for cranial nerve (CN) expression, inspected for and have CN7 expression, and have positive Activity-by-Contact (ABC) enhancer predictions for CN7 at e11.5. Peak-to-gene predictions match ABC predictions in all cases (7/7). Replacing CN7 e11.5 H3K27Ac or ATAC data with these data from a distantly related cell type (mouse embryonic limb e11.5) results in either a matching or a non-matching cognate gene prediction. Substituting cMN7 e11.5 histone modification data with “Limb H3K27Ac” histone modification data alters predictions for 3 out of 7 enhancers. Substituting cMN7 scATAC data with “Limb ATAC” data alters predictions for 6 out of 7 enhancers. Neither substituted input correctly identifies the CREST1 enhancer (VISTA enhancer hs1419). Positive evidence of CN7 enhancement is depicted by arrows. b. Stacked barplot summarizing consequences of toggled input data.
Extended Data Figure 7.
Extended Data Figure 7.. Compound heterozygous non-coding candidate variants in an ISL1 enhancer.
a. An affected trio with isolated congenital facial palsy, a CCDD affecting cMN7 (left), in which the affected offspring harbors compound heterozygous non-coding candidate SNVs (depicted by blue and red bars) affecting highly conserved nucleotides in enhancer hs2757 (right). The enhancer is predicted to regulate Isl1 (peak-to-gene r = 0.744, ABC power law = 0.024). Variant coordinates are in NG_023040.1. b. In vivo reporter assay testing hs2757 enhancer activity. Enhancement is present in cranial nerve 7 (arrows), an Isl1 positive cell type. Reporter expression views are shown as lateral (left) and dorsal through the 4th ventricle (right).
Extended Data Figure 8.
Extended Data Figure 8.. Quality metrics for Basenji convolutional neural network accessibility predictions.
a. Precision-recall (PRC, left) and receiver-operating characteristic (ROC, right) curves measuring favorable performance (as measured by positive predictive value, sensitivity, true positive rate, and false positive rate) of Basenji accessibility predictions for cMN7 e10.5. AU denotes area under curve. Dotted lines represent the baseline classification rate. b. Scatterplot depicting Basenji accessibility predictions vs. true scATAC sequencing coverage for cMN7 e10.5. Each point represents a 128 bp test bin whose sequence was excluded from training. Measured and predicted coverage are positively correlated (Pearson’s R = 0.833). c. Boxplot summarizing area under PRC (AUPRC) and ROC (AUROC), and Pearson’s R for all samples and replicates. Quality metrics are consistent across samples. Data points depicted in (a) and (b) are highlighted in red. Centre line – median; box limits – upper and lower quartiles; whiskers – 1.5 x interquartile range.
Extended Data Figure 9.
Extended Data Figure 9.. Cell type-aware candidate variants alter reporter expression in vivo.
a. Representative whole mount in vivo enhancer reporter expression for (top) hs2777 wildtype and (bottom) hs2777-mut enhancer constructs. For each reporter insertion, dosage is labelled (“single”, “tandem”). Reporter expression views are shown as lateral (left) and dorsal through the 4th ventricle (right). Cranial nerve 7 (white arrows) and surrounding hindbrain tissue (dashed lines) show visible gain of reporter expression. b. Additional replicates as in (a), matched by injection batch (top and bottom). hs2777-mut constructs reproducibly show increased reporter expression across midbrain, hindbrain, and neural tube. Random insertions are denoted by an asterisk. c. hs2777 chromatin accessibility profiles in the cranial motor neurons and surrounding cell types. The wildtype element is accessible across multiple cMNs and surrounding cells. d. UCSC screenshot depicting location of hs2777-mut variants: “Variant A” (chr17:48003393G>A, off-target), “Variant B” (chr17:48003557C>G, Moebius), “Variant C” (chr17:48003752A>C, DRS), and “Variant D” (chr17:48003826C>T, Moebius). hs2777-mut overlaps conserved non-coding sequence, particularly for Variants C and D. e. Neural net-trained in silico saturation mutagenesis predictions for all possible nucleotide changes in hs2777 for selected samples cMN6 e11.5, cMN6neg e11.5, cMN7 e11.5, and cMN7neg e11.5. Predicted loss-of-function nucleotide changes are colored in blue and gain-of-function in red. Specific nucleotide changes corresponding to in vivo Variants C and D are boxed. Samples marked with “neg” are GFP-negative cells surrounding the motor neurons of interest. All other samples are GFP-positive motor neurons. Variants C and D are predicted to increase accessibility in relevant samples consistent with their corresponding phenotypes; DRS alters cMN6 but not cMN7 development (Variant C), while MBS alters both (Variant D).
Figure 1.
Figure 1.. Integrating Mendelian pedigrees with single cell epigenomic data.
a. Schematic depicting subset of human cMNs and their targeted muscles. cMN3 (blue) = oculomotor nucleus which innervates the inferior rectus, medial rectus, superior rectus, inferior oblique, and levator palpebrae superior muscles; cMN4 (purple) = trochlear nucleus which innervates the superior oblique muscle; cMN6 (green) = abducens nucleus which innervates the lateral rectus muscle (bisected); cMN7 (pink) = facial nucleus which innervate muscles of facial expression; cMN12 (black) = hypoglossal nucleus which innervates tongue muscles. Corresponding CCDDs for each cMN are listed under diagram and color coded. CFEOM: congenital fibrosis of the extraocular muscles; CP: congenital ptosis; FNP: fourth nerve palsy; DRS: Duane retraction syndrome; MBS: Moebius syndrome; CFP: congenital facial palsy. b. Overview of the experimental and computational approach. i) Generating cell type-specific chromatin accessibility profiles. Brightfield and fluorescent images of e10.5 Isl1MN:GFP embryo (left) from which cMNs are microdissected (yellow dotted lines, dissociated, FACS-purified (middle), followed by scATAC and data processing (right; red and blue lines represent adapters, black line represents DNA, orange cylinders represent nucleosomes, grey pentagons represent Tn5). ii) WGS of 270 CCDD pedigrees (left; 899 individuals; sporadic and inherited cases) followed by joint variant calling, QC, and Mendelian variant filtering (right). iii) Integrating genome-wide non-coding variant calls with epigenomic annotations for variant nomination (top). To aid in variant interpretation, we identify cognate genes (2nd row), aggregate candidate variants, generate functional variant effect predictions (3rd row), and validate top predictions in vivo (bottom). c. UMAP embedding of single cell chromatin accessibility profiles from 86,089 GFP-positive cMNs, sMNs, and their surrounding GFP-negative neuronal tissue colored based on GFP reporter status (left, GFP-positive green, GFP-negative grey), sample (middle, with sample key under UMAP) and cluster (right, with cluster annotations in Supplementary Table 3). Gridlines in middle UMAP apply to left and right UMAPs as well. The inset shows the relative proximity of Cluster 2 cells dissected from the same cell type (cMN7 e10.5) from different technical and biological replicates. d. Heatmap depicting the proportions of dissected cells within each of the 23 major clusters. Homogeneity/completeness metrics are shown for GFP-positive versus GFP-negative clusters. cMN6 and cMN7 are in close spatial proximity and are commonly co-dissected.
Figure 2.
Figure 2.. Motif enrichment and aggregate footprint analyses distinguish cell type specific TF binding motifs.
a. Heatmap depicting enriched transcription factor binding motifs within differentially accessible peaks by cluster. Each entry is defined by its cluster identity (“clusterID.clusterNumber”). Corresponding cluster IDs and annotations are depicted. Color scale represents hypergeometric test p-values for each cluster and motif. Specific motifs and motif families vary significantly amongst clusters. Cluster annotations are defined in Supplementary Table 3. b. Aggregated subtraction-normalized footprinting profiles for a subset of cluster-enriched transcription factors (OTX1, ONECUT2, JunD, and GATA1) from (a), centered on their respective binding motifs. Specific clusters display positive evidence for TF motif binding for each motif. Corresponding motif position weight matrices from the CIS-BP database are depicted above each profile. Cluster IDs with corresponding color are below. c. Motif enrichment comparing broad classes of neuronal subtypes. Midbrain subtype contains motifs from cMN3/4neg cells; hindbrain from cMN6neg, cMN7neg, and cMN12neg cells; somatic MN from cMN3/4, cMN6, and cMN12 GFP-positive cells; branchial MN are from cMN7 GFP-positive cells; midbrain MN are cMN3/4 GFP-positive cells; hindbrain MN are cMN6, cMN7, and cMN12 GFP-positive cells; ocular MN are cMN3/4 and cMN6 GFP-positive cells; lower MN are cMN7, cMN12, and sMN GFP-positive cells. For each graph, the first listed subtype is enriched relative to the second listed subtype.
Figure 3.
Figure 3.. Effects of RNA input data on peak-to-gene accuracy.
a. Scatterplots depicting imputed gene expression values projected onto scATAC clusters cMN3/4.10, cMN6.6, and cMN7.2 (x axis) versus measured gene expression values from independently collected bulk RNA-seq samples (y axis). Imputed gene expression shows a significant positive relationship when compared with corresponding bulk samples (cMN3/4, cMN6, and cMN7, respectively). b. Feature plots depicting imputed gene expression for three classic cMN marker genes (Phox2a (top, boxed in blue), Mnx1 (middle, boxed in red), and Hoxb1 (bottom, boxed in black)). Expression is restricted to corresponding clusters cMN3/4.10 (Phox2a), cMN6.6 (Mnx1), and cMN7.2 (Phox2a, Hoxb1) as expected. c. Stacked barplot depicting total number of unique and shared peak-to-gene links using three distinct scRNA integration datasets against the common scATAC cMN peakset. cMN: scRNA-seq data from age- and dissection-matched, oversampled cranial motor neurons (this work). MOCA Neuro: age-matched, uniformly sampled embryonic neural tissue from the MOCA database. MOCA Cardiac: non-age-matched, uniformly sampled embryonic cardiac tissue from the MOCA dataset. d. Distribution of peak-to-gene effect sizes using different scRNA integration datasets (shared links only). Estimated effect sizes are significantly stronger using cMN scRNA integration when compared to MOCA neuro and MOCA cardiac integration. e. Barplot depicting peak-to-gene elements from the three scRNA integrations overlapping 67 experimentally validated cMN enhancers (“vista cMN”, left). i. “Matched peak” indicates overlapping peaks irrespective of predicted cognate gene (middle). ii. “Matched gene” indicates both overlapping peaks and identical cognate gene within the VISTA cMN enhancers (right, note that the vista cMN enhancers to not have defined target genes). Toggling between scRNA integrations can alter or eliminate target gene predictions. i and ii represent intersect and distinct peaks, respectively. f. In vivo enhancer assay for cMN VISTA enhancer hs2081 (lateral view). This enhancer overlaps a predicted peak-to-gene link using both cMN and MOCA cardiac scRNA input. However, enhancer activity is positive in cranial nerves 3, 7, and 12 (arrows) and negative in embryonic heart (dotted lines). g. Comparing scATAC versus scMultiome peak-to-gene effect sizes for four motor neuron transcription factors (Nkx6-1, Isl1, Phox2a, and Phox2b). Each circle represents a peak. All four genes show a positive linear relationship across both assays. h. scATAC (top) and scMultiome (bottom) accessibility profiles with peak-to-gene connections for a 100kb window centered around Phox2a. scATAC profiles are parsed by sample while scMultiome profiles are parsed by predicted cluster label. Peak-to-gene predictions are highly concordant across both assays. Novel cMN enhancer hs2678 is accessible in cMN3/4 and cMN7 and is predicted to enhance Phox2a by both scATAC (r = 0.84) and scMultiome (r = 0.69) peak-to-gene estimates. i. (Top) hs2678 orthologous region in the human genome. hs2678 is 70.3 kb distal to human PHOX2A and is embedded in coding and intronic sequence of CLPB. (Bottom) In vivo enhancer assay using human hs2678 sequence is positive in cMN3 and cMN7 (arrows), recapitulating known Phox2a gene expression patterns. Reporter expression views are shown as lateral (left) and dorsal through the 4th ventricle (right).
Figure 4.
Figure 4.. Exceptional gene regulation of cranial motor neuron master regulator Isl1.
a. Pseudobulked chromatin accessibility profiles for all annotated clusters over a 1.5 Mb window centered about Isl1. Imputed gene expression profiles for each cluster are shown to the right. Isl1 is located within a gene desert with the nearest up- and downstream flanking genes 1.2 and 0.7 Mb away, respectively. Peak-to-gene predictions match known Isl1 enhancers (CREST1 in motor neurons and CREST3 in sensory neurons; mm933 in multiple cranial motor nerves, dorsal root ganglion, and nose; hs1321 in multiple cranial motor nerves and forebrain) and identify additional putative enhancers surrounding Isl1. b. The number of normalized regulatory connections for each rank ordered gene. Isl1 ranks in the top 1% of all genes with at least one regulatory connection. The inflection point of the plotted function is demarcated with a dotted line. c. Per-cell Domain of Regulatory Chromatin (DORC) scores for Isl1 gene. DORC scores are significantly higher for cells from motor neuron clusters relative to non-motor neuron clusters (p-value < 1 x 10⁻¹⁵, ANOVA). d. (Left) Lateral whole mount In vivo reporter assay testing CREST1 (VISTA enhancer hs1419) enhancer activity. CREST1 drives expression in cranial nerves 3, 4, and 7 (black lines; there is also expression in trigeminal motor nerve). (Right) Single cell ATAC profiles and imputed gene expression for a subset of corresponding clusters. CREST1 accessibility and Isl1 gene expression are positively correlated with in vivo expression patterns. e. Boxplot depicting normalized accessibility levels for enhancers CREST1, CREST3, mm933, and hs1321 within nine scATAC clusters corresponding to distinct anatomic regions. Manually scored enhancer activity (“enhancement”) is significantly correlated with normalized accessibility (p-value = 0.011, Wald test). Center line: median; box limits: upper and lower quartiles; whiskers – 1.5 x interquartile range.
Figure 5.
Figure 5.. An integrated coding/non-coding candidate allelic series for EBF3.
a. Window depicting the terminal arm of chr10q (top). Large de novo deletions in two trios (middle, bottom) with simplex syndromic DRS (S233, S131) overlap multiple coding genes including EBF3 (boxed), an exceptionally conserved gene at the coding and non-coding level. b. Nominated coding and non-coding SNVs and indels connected to EBF3. For each variant, the subject’s WGS ID code, CCDD phenotype (and if isolated or syndromic), the variant coordinate in NG_030038.1 (and if coding or noncoding and if familial or de novo) is indicated. Variants 5 and 8 are reported previously in DECIPHER and elsewhere,. Peak-to-gene links containing variants connected to EBF3 are depicted by curved lines. EBF3 contains highly conserved non-coding intronic elements, including ultra-conserved element UCE 318 in intron 6, whose sequence drives strong expression in the embryonic hindbrain (VISTA enhancer hs232, see (e) below). c. Imputed gene expression profiles for Ebf3. Ebf3 is broadly expressed among the cMNs. d. EBF3 is exceptionally intolerant to loss-of-function, gene dosage, and missense variation. Density plots depict genome-wide distribution of loss-of-function constraint (“loeuf”, “pLI”),, probability of haploinsufficiency (“pHaplo”)101, and missense constraint (“z-score”). Respective scores exceeding thresholds of 0.35, 0.9, 0.84, and 2.0 are colored red. EBF3 (dotted lines) ranks as the 563rd, 861st, 3rd, and 508th most constrained gene in the genome, respectively. Distributions are rescaled for consistent sign and ease of visualization. e. Lateral view of in vivo reporter assay testing UCE 318 (VISTA enhancer hs232), a putative EBF3 enhancer (peak-to-gene r = 0.42, FDR = 6.72 x 10⁻²²). Strong reporter expression is observed in the embryonic hindbrain (arrow).
Figure 6.
Figure 6.. MN1 enhancer deletions across multiple CCDD pedigrees.
a. IGV screenshot depicting 3.6 kb non-coding deletions in two probands with DRS from separate consanguineous pedigrees (S190, S238). b. ddPCR copy number estimates of deletions. For each pedigree, the affected proband is homozygous recessive for the deletion with one heterozygous allele inherited from each parent. Error bars denote 95% confidence intervals. c. Genomic context of the non-coding deletions. The deletions (red bar below chr 22 ideogram) fall within extended runs of homozygosity (grey bars above ideogram, 19.5 Mb, 18.8 Mb, respectively, of which 16 kb surrounding the deletion is shared between the probands) and eliminates putative enhancer hs2757 (green bar below ideogram) located 307 kb from nearest gene MN1. d. hs2757 chromatin accessibility (left) and Mn1 imputed gene expression (right) profiles in the cMNs and surrounding cell types. Mn1 is widely expressed across multiple midbrain/hindbrain cell types, and hs2757 is accessible across multiple cell types, including cMN6. e. Density plots depicting genome-wide distribution of loss-of-function constraint (“loeuf”, “pLI”),, and probability of haploinsufficiency (“pHaplo”) metrics. Respective scores exceeding thresholds of 0.35, 0.9, 0.84, and 2.0 are colored red. MN1 (dotted lines) ranks as the 131rd, 605th, and 402nd most constrained gene in the genome, respectively. Distributions are rescaled for consistent sign and ease of visualization. f. In vivo reporter assay testing hs2757 enhancer activity (humanized sequence). Lateral (left) and dorsal (right) whole mount lacZ staining reveals hs2757 consistently drives expression in midbrain and hindbrain tissue, including the anatomic territory of cMN6.
Figure 7.
Figure 7.. scATAC-trained convolutional neural network accurately predicts cell type specific accessibility status and human mutation effects in a transiently developing cell type.
a. Neural net predicted chromatin accessibility profiles (red) compared to actual scATAC sequencing coverage (black) for a region of mouse chromosome 6 in three cell types (cMN7 e10.5, cMN7 e11.5, and cMN12 e11.5). The grey box highlights a transient 678 bp peak (cRE2) that is accessible in cMN7 e10.5, but not cMN7 e11.5 or cMN12 e11.5. SNVs within the human orthologous peak cRE2 cause congenital facial weakness, a disorder of cMN7. b. Neural net-trained in silico saturation mutagenesis predictions for specific nucleotide changes in human cRE2 for cMN7 e10.5, cMN7 e11.5, and cMN12 e11.5. Predicted loss-of-function nucleotide changes are colored in blue and gain-of-function in red. Predictions for four known loss-of-function pathogenic variants (chr3:128178260 G>C, chr3:128178261 G>A, chr3:128178262 T>C, chr3:128178262 T>G) are boxed. All four pathogenic variants are predicted loss-of-function for cMN7 e10.5, but not cMN7 e11.5 or cMN12 e11.5. c. Pseudobulk accessibility profiles of cRE2 (red box) CN7 e10.5 for wildtype and two CRISPR-mutagenized mouse lines (cRE2Fam4Fam4 and cRE2Fam5Fam5) show a qualitative reduction in cRE2 scATAC sequencing coverage, consistent with in silico saturation mutagenesis predictions. Each pseudobulk profile represents normalized sequencing coverage across two biological replicates. d. Locus-specific footprinting evidence overlapping cRE2. A 792 bp window showing sequencing coverage for cMN7 e10.5 after correcting for Tn5 insertion bias. The NR2F1 transcription factor binding site is mutated in individuals with HCFP1-CFP and overlaps a local minimum in scATAC coverage. TOBIAS footprinting scores for cRE2 wildtype, cRE2Fam4Fam4, and cRE2Fam5Fam5 are depicted in solid, dashed, and dotted lines, respectively. Wildtype footprinting scores are higher than mutant scores. e. Stacked barplot depicting wildtype versus mutant scATAC read counts over a 7.7 kb window for cMN7 e10.5 in cRE2WTFam5 heterozygote embryos. cRE2 mutant alleles are consistently depleted across two biological replicates (countsWTcountsMUTANT=4.21; p-value = 2.4 x 10⁻¹⁴, binomial test).

References

    1. Smedley D. et al. A Whole-Genome Analysis Framework for Effective Identification of Pathogenic Regulatory Variants in Mendelian Disease. The American Journal of Human Genetics vol. 99 595–606 Preprint at 10.1016/j.ajhg.2016.07.005 (2016). - DOI - PMC - PubMed
    1. Amberger J. S. & Hamosh A. Searching Online Mendelian Inheritance in Man (OMIM): A Knowledgebase of Human Genes and Genetic Phenotypes. Curr. Protoc. Bioinformatics 58, 1.2.1–1.2.12 (2017). - PMC - PubMed
    1. Visscher P. M. et al. 10 Years of GWAS Discovery: Biology, Function, and Translation. Am. J. Hum. Genet. 101, 5–22 (2017). - PMC - PubMed
    1. Hekselman I. & Yeger-Lotem E. Mechanisms of tissue and cell-type specificity in heritable traits and diseases. Nature Reviews Genetics Preprint at 10.1038/s41576-019-0200-9 (2020). - DOI - PubMed
    1. Short P. J. et al. De novo mutations in regulatory elements in neurodevelopmental disorders. Nature 555, 611–616 (2018). - PMC - PubMed

Publication types

LinkOut - more resources