[Preprint]. 2023 Dec 27:2023.12.27.573453.
doi: 10.1101/2023.12.27.573453.

Contribution of CENP-F to FOXM1-mediated discordant centromere and kinetochore transcriptional regulation

Affiliations

Contribution of CENP-F to FOXM1-mediated discordant centromere and kinetochore transcriptional regulation

Sakshi Khurana et al. bioRxiv. .

Update in

Abstract

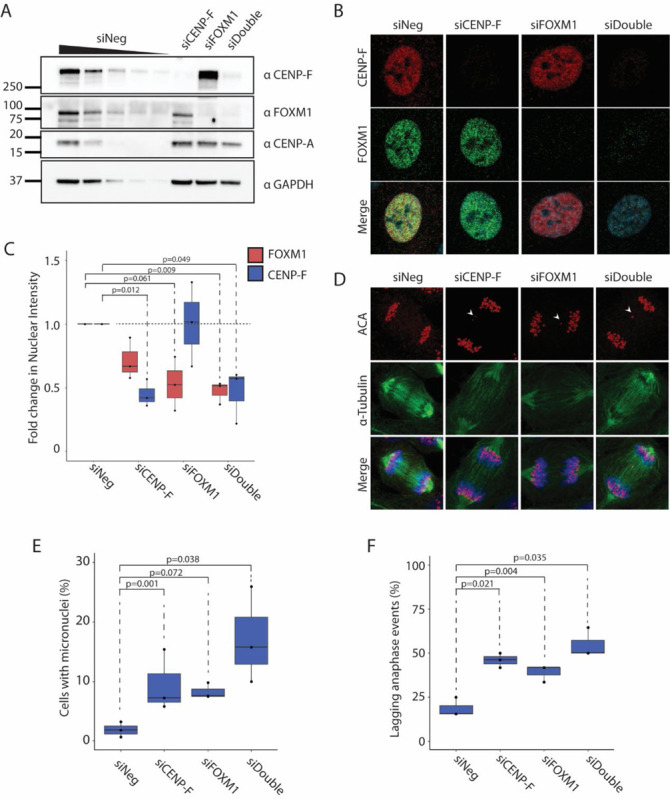
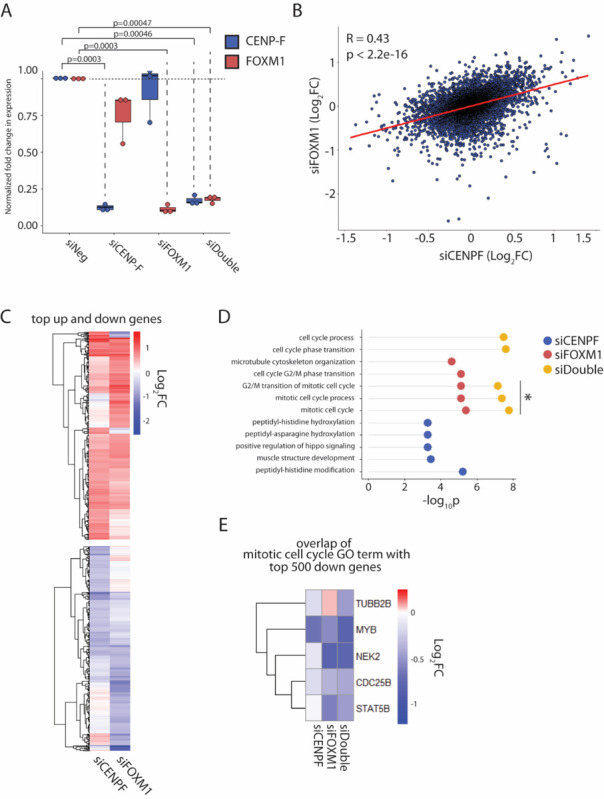
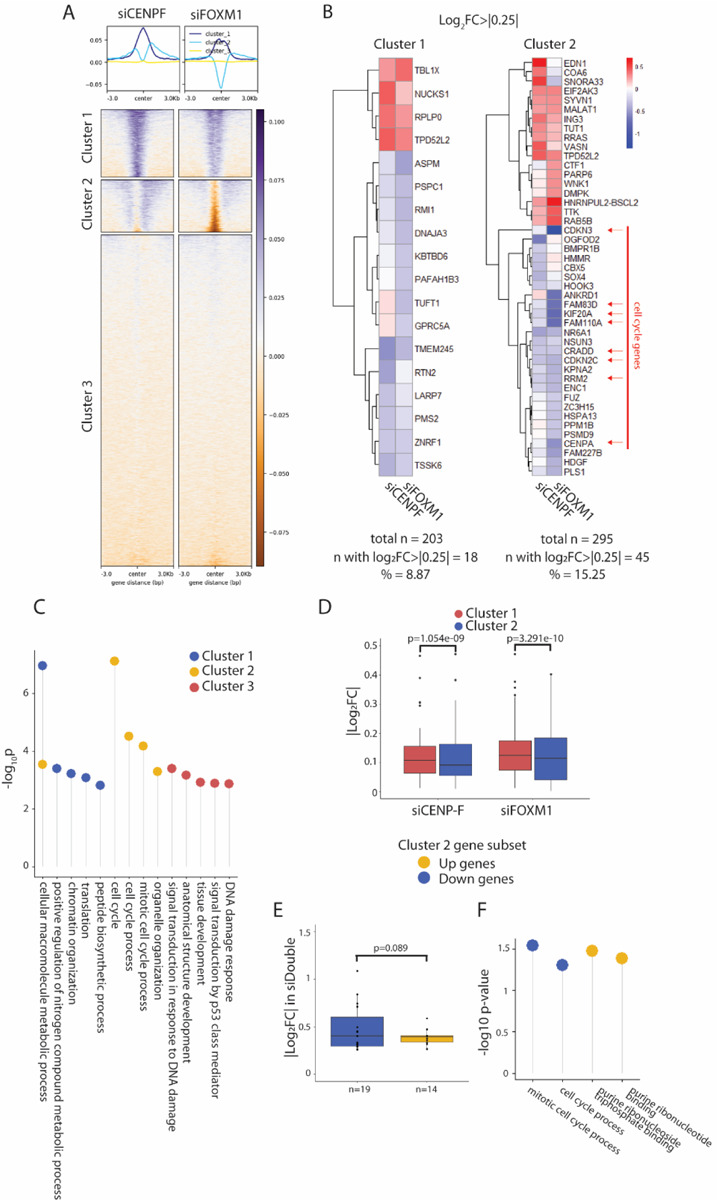
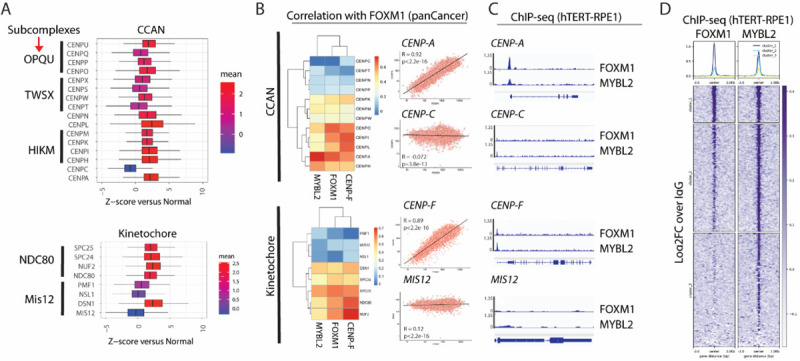
Proper chromosome segregation is required to ensure genomic and chromosomal stability. The centromere is a unique chromatin domain present throughout the cell cycle on each chromosome defined by the CENP-A nucleosome. Centromeres (CEN) are responsible for recruiting the kinetochore (KT) during mitosis, ultimately regulating spindle attachment and mitotic checkpoint function. Upregulation of many genes that encode the CEN/KT proteins is commonly observed in cancer. Here, we show although that FOXM1 occupies the promoters of many CEN/KT genes with MYBL2, occupancy is insufficient alone to drive the FOXM1 correlated transcriptional program. We show that CENP-F, a component of the outer kinetochore, functions with FOXM1 to coregulate G2/M transcription and proper chromosome segregation. Loss of CENP-F results in alteration of chromatin accessibility at G2/M genes, including CENP-A, and leads to reduced FOXM1-MBB complex formation. The FOXM1-CENP-F transcriptional coordination is a cancer-specific function. We observed that a few CEN/KT genes escape FOXM1 regulation such as CENP-C which when upregulated with CENP-A, leads to increased chromosome misegregation and cell death. Together, we show that the FOXM1 and CENP-F coordinately regulate G2/M gene expression, and this coordination is specific to a subset of genes to allow for proliferation and maintenance of chromosome stability for cancer cell survival.


Figures

Figure 1.
Figure 1.. CENP-F and FOXM1 systematically regulate chromatin and centromeric stability.
A. Immunoblot analysis showing protein knockdown in response to 20nM siRNA treatment of CENP-F, FOXM1 or double KD for 48 hours. Wedge represents loading titration: 1x > 0.75x > 0.5x > 0.25x > 0.125x. All other lanes are loaded at 1x concentration. N=3. B. Representative images of hTERT-RPE1 cell treated with siCENP-F, siFOXM1 or both. Immunofluorescence was conducted to visualize CENP-F (green) and FOXM1 (red), and DAPI (blue). C. Quantification of CENP-F and FOXM1 protein levels from image set shown in (B). P-values calculated using two-tailed paired student’s t-test. N=3. D. Representative mitotic images of hTERT-RPE1 cell treated with siCENP-F, siFOXM1 or both. Immunofluorescence was conducted to visualize centromeres by ACA (red), alpha-Tubulin (green), and DNA by DAPI (blue). E. Quantification of micronuclei frequency from (C). P-values calculated using two-tailed paired student’s t-test. N=3. F. Quantification of lagging anaphase events from (C). P-values calculated using two-tailed paired student’s t-test. N=3.
Figure 2.
Figure 2.. CENP-F and FOXM1 coordinately co-regulate G2/M genes.
A. Fold change of CENP-F and FOXM1 transcript levels normalized to GAPDH, in response to 20nM siRNA treatment for 48 hours in hTERT-RPE1 cells. P-values calculated using two-tailed paired student’s t-test. N=3. B. Scatterplot of genes from RNA-seq plotted as log2FC in siCENP-F vs siFOXM1 treated cells. Correlation coefficient and p-value was calculated using Pearson method. N=3. C. Heatmap showing log2FC of top 500 upregulated and top 500 downregulated genes in siCENP-F and siFOXM1 conditions, clustered by unbiased Euclidean method. D. GO-term analysis showing top 5 enriched GO-terms in top 500 downregulated genes in siCENP-F, siFOXM1 and siDouble cells. GO-terms enriched in multiple conditions are plotted on a single line with different colored circles. E. Heatmap showing overlapping genes between top 500 down genes in the RNA-seq datasets and the mitotic cell cycle gene set (enriched in both siFOXM1 and siDouble). Log2FC of overlapping genes are shown in all conditions.
Figure 3.
Figure 3.. CENP-F influences chromatin landscape of G2/M genes.
A. Log2FC of ATAC-seq signal in hTERT-RPE1 cells treated with siCENP-F and siFOXM1 for 48 hours, mapped against FOXM1 binding sites in MCF7 cells, with k-mean clustering = 3 (bottom). Enrichment plot shows average accessibility profile in each cluster (top). N=3. B. GO-term enrichment analysis of each cluster. Terms enriched in multiple groups are represented on the same line. Negative log10 p value of enrichment is represented on the y-axis. C. Heatmap of the subset of genes in cluster 1 and 2 from ATAC-seq that have log2FC>|0.25| in the RNA-seq data set. Cluster 1 has a total of 203 genes with 18 genes with log2FC>|0.25| while cluster 2 has a total of 295 genes with 45 genes with log2FC>|0.25|. Cell cycle associated genes are highlighted with red arrows. D. Absolute values of log2 fold transcriptional changes of downregulated genes in Cluster 1 and Cluster 2 from ATAC-seq dataset. P-values calculated using two-tailed student’s t-test. E. Absolute values of log2 fold transcriptional changes in siDouble cells, of upregulated (yellow) vs downregulated (blue) cluster 2 genes from ATAC-seq dataset. P-values calculated using one-tailed student’s t-test. F. GO term analysis of up (yellow) vs down regulated (blue) cluster 2 genes in siDouble cells. Negative log10 p value of enrichment is represented on the y-axis.
Figure 4.
Figure 4.. CENP-F regulates FOXM1-MMB complex formation.
A. TCGA pan cancer analysis of gene expression represented as z-score of cancer vs normal of FOXM1, MYBL2 and CENP-F. B. Immunoblot of FLAG immunoprecipitation in FLAG-FOXM1-hTERT-RPE1 cells. Cells were treated with doxycycline for 48 hours to induce FOXM1 expression and simultaneously treated with 20nM siNeg or siCENP-F. C. Quantification of immunoprecipitation of LIN54 or MYBL2 shown in (B). P-values calculated using two-tailed student’s t-test. N=3.
Figure 5.
Figure 5.. FOXM1 and MYBL2 co-occupy a specific subset of CEN/KT proteins.
A. TCGA pan cancer analysis of gene expression represented as z-score of cancer vs normal of CEN/KT subcomplexes. B. Correlations of CEN/KT components with FOXM1 from TCGA data. Scatterplot of select genes shows degree of correlations between FOXM1 and CENPA or CENPC of the CCAN complex and FOXM1 and CENPF or MIS12 of the kinetochore complex. Pearson’s correlation coefficient was calculated from z-scores of cancer versus normal. C. FOXM1 and MYBL2 ChIP profiles in hTERT-RPE1 cells showing peaks at selected genes. D. Metaplot of FOXM1 and MYBL2 log2FC ChIP signal vs IgG at FOXM1-MYBL2 intersected consensus peaks with k-means clustering = 3.
Figure 6.
Figure 6.. FOXM1-CENP-F cancer-specific regulation excludes CENP-C to promote survival in cancer cells.
A. Immunoblotting of hTERT-RPE1, MCF7 and PC-3 cells treated with 20nM siNeg or siFOXM1 for 48 hours. B. Quantification of CENP-F protein levels in response to siNeg or siFOXM1 in normal vs cancer cells lines shown in (A), normalized to GAPDH. P-values calculated using one-tailed student’s t-test. N=3 C. RT-qPCR of CENP-F transcript levels, normalized to GAPDH, in FOXM1 knockdown conditions across normal and cancer cell lines. P-values calculated using two-tailed student’s t-test. N=3. D. RT-qPCR of CENP-A transcript levels, normalized to GAPDH, in knockdown across normal and cancer cell lines. P-values calculated using two-tailed student’s t-test. N=3. E. RT-qPCR of CENP-C transcript levels, normalized to GAPDH, in knockdown conditions across normal and cancer cell lines. P-values calculated using two-tailed student’s t-test. N=3. F. Representative images of Tet-CENP-A-mCherry HeLa-Trex cells induced for 48 hours and transfected with either CENP-C LAP or LAP empty vector (EV). Imaging was conducted for mCherry (CENPA), eGFP (LAP) and DAPI. G. Quantification of percentage of cells with micronuclei in each condition shown in (E). P-values calculated using two-tailed paired student’s t-test. N=3. H. Percent cell viability calculated by growth curves over 72 hours post transfection in each condition. P-values calculated using two-tailed paired student’s t-test. N=3.

References

    1. Bakhoum S.F. and Cantley L.C., The Multifaceted Role of Chromosomal Instability in Cancer and Its Microenvironment. Cell, 2018. 174(6): p. 1347–1360. - PMC - PubMed
    1. Gordon D.J., Resio B., and Pellman D., Causes and consequences of aneuploidy in cancer. Nat Rev Genet, 2012. 13(3): p. 189–203. - PubMed
    1. Vargas-Rondon N., Villegas V.E., and Rondon-Lagos M., The Role of Chromosomal Instability in Cancer and Therapeutic Responses. Cancers (Basel), 2017. 10(1). - PMC - PubMed
    1. Carter S.L., et al., A signature of chromosomal instability inferred from gene expression profiles predicts clinical outcome in multiple human cancers. Nat Genet, 2006. 38(9): p. 1043–8. - PubMed
    1. Thompson S.L., Bakhoum S.F., and Compton D.A., Mechanisms of chromosomal instability. Curr Biol, 2010. 20(6): p. R285–95. - PMC - PubMed

Publication types