[Preprint]. 2023 Dec 27:2023.12.27.573428.
doi: 10.1101/2023.12.27.573428.

PDGFRα/β heterodimer activation negatively affects downstream ERK1/2 signaling and cellular proliferation

Affiliations

PDGFRα/β heterodimer activation negatively affects downstream ERK1/2 signaling and cellular proliferation

Maria B Campaña et al. bioRxiv. .

Update in

Abstract

The platelet-derived growth factor receptor (PDGFR) family of receptor tyrosine kinases allows cells to communicate with one another by binding to growth factors at the plasma membrane and activating intracellular signaling pathways to elicit responses such as migration, proliferation, survival and differentiation. The PDGFR family consists of two receptors, PDGFRα and PDGFRβ, that dimerize to form PDGFRα homodimers, PDGFRα/β heterodimers and PDGFRβ homodimers. Here, we overcame prior technical limitations in visualizing and purifying PDGFRα/β heterodimers by generating a cell line stably expressing C-terminal fusions of PDGFRα and PDGFRβ with bimolecular fluorescence complementation fragments corresponding to the N-terminal and C-terminal regions of the Venus fluorescent protein, respectively. We found that these receptors heterodimerize relatively quickly in response to PDGF-BB ligand treatment, with a peak of receptor autophosphorylation following 5 minutes of ligand stimulation. Moreover, we demonstrated that PDGFRα/β heterodimers are rapidly internalized into early endosomes, particularly signaling endosomes, where they dwell for extended lengths of time. We showed that PDGFRα/β heterodimer activation does not induce downstream phosphorylation of ERK1/2 and significantly inhibits cell proliferation. Further, we characterized the PDGFR dimer-specific interactome and identified MYO1D as a novel protein that preferentially binds PDGFRα/β heterodimers. We demonstrated that knockdown of MYO1D leads to retention of PDGFRα/β heterodimers at the plasma membrane, resulting in increased phosphorylation of ERK1/2 and increased cell proliferation. Collectively, our findings impart valuable insight into the molecular mechanisms by which specificity is introduced downstream of PDGFR activation to differentially propagate signaling and generate distinct cellular responses.


Conflict of interest statement

Competing Interests: Authors declare that they have no competing interests.

Figures
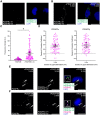
Fig. 1.
Fig. 1.. Validation of a PDGFRα/β-BiFC stable cell line.
(A,B) Venus expression (white or green) as assessed by fluorescence analysis of HCC15 cells transduced with PDGFRα-V1 and PDGFRβ-V2 in the absence (A) or presence (B) of PDGF-BB ligand for 5 min. Nuclei were stained with DAPI (blue; A,B). Scale bars: 20 μm. (C) Scatter dot plot depicting fluorescence intensity for the PDGFRα/β heterodimer cell line in the absence or presence of PDGF-BB ligand for 5 min. Data are mean±s.e.m. *P<0.05 (two-tailed, paired t-test). Colored circles correspond to independent experiments. Summary statistics from biological replicates consisting of independent experiments (large circles) are superimposed on top of data from all cells; n≥38 technical replicates across each of three biological replicates. (D) Scatter dot plots depicting Pearson’s correlation coefficient of the PDGFRα/β heterodimer cell line with an anti-PDGFRα antibody (left) and an anti-PDGFRβ antibody (right) following PDGF-BB ligand stimulation for 5 min. Data are mean±s.e.m. Colored circles correspond to independent experiments. Summary statistics from biological replicates consisting of independent experiments (large circles) are superimposed on top of data from all cells; n=25 technical replicates across each of three biological replicates. (E,F) PDGFRα (E) and PDGFRβ (F) antibody signal (white or magenta; E,F) and/or Venus expression (white or green; E,F) as assessed by (immuno)fluorescence analysis of the PDGFRα/β heterodimer cell line. Insets in E and F are regions where white arrows are pointing. Nuclei were stained with DAPI (blue; E,F). White arrows denote colocalization; white outlined arrows denote lack of colocalization. Scale bars: 20 μm (main images), 3 μm (insets).
Fig. 2.
Fig. 2.. PDGFRα/β heterodimers dimerize relatively quickly and have peak levels of autophosphorylation following 5 minutes of ligand treatment.
(A) Immunoprecipitation (IP) of dimerized PDGFRα/β receptors with GFP-Trap nanobody from cells that were unstimulated or treated with PDGF-BB ligand for 2–5 min followed by western blotting (WB) with an anti-PDGFRα (left) or an anti-PDGFRβ antibody (right). WCL, whole-cell lysates. (B) Line graph depicting quantification of band intensities from n=3 biological replicates as in A. Data are mean±s.e.m. *P<0.05 (two-tailed, ratio paired t-test). (C) Immunoprecipitation of dimerized PDGFRα/β receptors with GFP-Trap nanobody from cells that were unstimulated or treated with PDGF-BB ligand for 2 min to 4 h followed by western blotting with an anti-phospho (p)-PDGFR antibody. (D) Line graph depicting quantification of band intensities from n=3 biological replicates as in C. Data are mean±s.e.m. *P<0.05; (two-tailed, ratio paired t-test).
Fig. 3.
Fig. 3.. PDGFRα/β heterodimers are rapidly internalized into signaling endosomes.
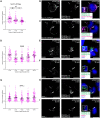
(A,D,G) Scatter dot plots depicting Pearson’s correlation coefficient of the PDGFRα/β heterodimer cell line Venus signal with an anti-Na+/K+-ATPase antibody (A), an anti-RAB5 antibody (D) or an anti-APPL1 antibody (G) signal following PDGF-BB ligand stimulation from 1–5 min (A) or 2–30 min (D,G). Data are mean±s.e.m. *P<0.05; **P<0.01 (two-tailed, unpaired t-test with Welch’s correction). Colored circles correspond to independent experiments. Summary statistics from biological replicates consisting of independent experiments (large circles) are superimposed on top of data from all cells; n311 technical replicates across each of three biological replicates. (B,C,E,F,H,I) Na+/K+-ATPase antibody signal (white or magenta; B,C), RAB5 antibody signal (white or magenta; E,F) or APPL1 antibody signal (white or magenta; H,I) and/or Venus expression (white or green; B,C,E,F,H,I) as assessed by (immuno)fluorescence analysis of the PDGFRα/β heterodimer cell line. Insets in B, C, E, F, H and I are regions where white arrows are pointing. Nuclei were stained with DAPI (blue; B,C,E,F,H,I). White arrows denote colocalization; white outlined arrows denote lack of colocalization. Scale bars: 20 μm (main images), 3 μm (insets).
Fig. 4.
Fig. 4.. PDGFRα/β heterodimer activation does not induce downstream phosphorylation of ERK1/2 and inhibits cell proliferation.
(A,C) Western blot (WB) analysis of whole-cell lysates (WCL) from the PDGFRα/β heterodimer cell line following a time course of PDGF ligand stimulation from 2 min to 4 h with anti-phospho (p)-ERK1/2 (A) or anti-phospho (p)-AKT (C) antibodies. (B,D) Line graphs depicting quantification of band intensities from n=3 biological replicates as in A and C. Data are mean±s.e.m. **P<0.01 (two-tailed, ratio paired t-test). (E,F) Colony growth in soft agar anchorage-independent growth assays for the HCC15 cell line (E) or the PDGFRα/β heterodimer cell line (F) after 10 days in RPMI growth medium in the absence or presence of PDGF-BB ligand in six-well plate wells. (G,H) Scatter dot plots depicting quantification of colony count (G) or colony area (H) from n=3 biological replicates as in E and F. Data are mean±s.e.m. *P<0.05; **P<0.01 (two-tailed, paired t-test within each cell line and a two-tailed, unpaired t-test with Welch’s correction between each cell line). Colored symbols correspond to independent experiments.
Fig. 5.
Fig. 5.. MYO1D preferentially binds PDGFRα/β heterodimers.
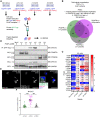
(A) Schematic depicting experimental workflow for identification of PDGFR dimer-specific interacting proteins. (B) Filters applied to the mass spectrometry data set and Venn diagram displaying shared protein identifications between samples within the filtered data. (C) Heat map of heavy (H)/light (L) SILAC ratios for identified proteins involved in trafficking. (D) Immunoprecipitation (IP) of myristoylated Venus and dimerized PDGFR receptors with GFP-Trap nanobody from cells that were unstimulated or treated with PDGF ligand for 5 min followed by western blotting (WB) with an anti-MYO1D antibody. WCL, whole-cell lysates. (E) MYO1D antibody signal (white or magenta) and/or Venus expression (white or green) as assessed by (immuno)fluorescence analysis of the PDGFRα/β heterodimer cell line following PDGF-BB ligand stimulation for 5 min. Inset in E is a region where white arrows are pointing. Nuclei were stained with DAPI (blue). White arrows denote colocalization; white outlined arrows denote lack of colocalization. Scale bars: 20 μm (main images), 3 μm (insets). (F) Scatter dot plot depicting Pearson’s correlation coefficient of the PDGFRα homodimer, PDGFRα/β heterodimer or PDGFRβ homodimer cell line Venus signal with an anti-MYO1D antibody signal following PDGF ligand stimulation for 5 min as in E. Data are mean±s.e.m. ***P<0.001 (two-tailed, unpaired t-test with Welch’s correction). Colored circles correspond to independent experiments. Summary statistics from biological replicates consisting of independent experiments (large circles) are superimposed on top of data from all cells; n=10 technical replicates across each of three biological replicates.
Fig. 6.
Fig. 6.. Knockdown of MYO1D leads to retention of PDGFRα/β heterodimers at the plasma membrane.
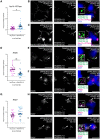
(A,D,G) Scatter dot plots depicting Pearson’s correlation coefficient of Venus signal from the PDGFRα/β heterodimer cell line treated with Silencer Select negative control or Silencer Select siRNA against MYO1D with an anti-Na+/K+-ATPase antibody (A), an anti-RAB5 antibody (D) or an anti-RAB7 antibody (G) signal following PDGF-BB ligand stimulation for 5 min (A), 2 min (D) or 60 min (G). Data are mean±s.e.m. *P<0.05; **P<0.01 (two-tailed, unpaired t-test with Welch’s correction). Colored circles correspond to independent experiments. Summary statistics from biological replicates consisting of independent experiments (large circles) are superimposed on top of data from all cells; n=10 technical replicates across each of three biological replicates. (B,C,E,F,H,I) Na+/K+-ATPase antibody signal (white or magenta; B,C), RAB5 antibody signal (white or magenta; E,F) or APPL1 antibody signal (white or magenta; H,I) and/or Venus expression (white or green; B,C,E,F,H,I) as assessed by (immuno)fluorescence analysis of the PDGFRα/β heterodimer cell line. Insets in B, C, E, F, H and I are regions where white arrows are pointing. Nuclei were stained with DAPI (blue; B,C,E,F,H,I). White arrows denote colocalization; white outlined arrows denote lack of colocalization. Scale bars: 20 μm (main images), 3 μm (insets).
Fig. 7.
Fig. 7.. Knockdown of MYO1D leads to increased downstream phosphorylation of ERK1/2 and increased cell proliferation.
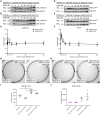
(A,B,D,E) Western blot (WB) analysis of whole-cell lysates (WCL) from the PDGFRα/β heterodimer cell line treated with Silencer Select negative control (A,D) or Silencer Select siRNA against MYO1D (B,E) following a time course of PDGF-BB ligand stimulation from 2 min to 4 h with anti-phospho (p)-ERK1/2 (A,B) or anti-phospho (p)-AKT (D,E) antibodies. (C,F) Line graphs depicting quantification of band intensities from n=3 biological replicates as in A, B, D and E. Data are mean±s.e.m. *P<0.05 (two-tailed, ratio paired t-test). (G,H) Colony growth in soft agar anchorage-independent growth assays for the PDGFRα/β heterodimer cell line treated with Silencer Select negative control (G) or Silencer Select siRNA against MYO1D (H) after 10 days in RPMI growth medium in the absence or presence of PDGF-BB ligand in six-well plate wells. (I,J) Scatter dot plots depicting quantification of colony count (I) or colony area (J) from n=3 biological replicates as in G and H. Data are mean±s.e.m. *P<0.05; ***P<0.001 (two-tailed, paired t-test within each siRNA treatment and a two-tailed, unpaired t-test with Welch’s correction between each siRNA treatment). Colored symbols correspond to independent experiments.

References

    1. Heldin C. H., Westermark B., Mechanism of action and in vivo role of platelet-derived growth factor. Physiol Rev 79, 1283–1316 (1999). - PubMed
    1. Hoch R. V., Soriano P., Roles of PDGF in animal development. Development 130, 4769–4784 (2003). - PubMed
    1. Williams L. T., Signal transduction by the platelet-derived growth factor receptor. Science 243, 1564–1570 (1989). - PubMed
    1. Matsui T. et al., Isolation of a novel receptor cDNA establishes the existence of two PDGF receptor genes. Science 243, 800–804 (1989). - PubMed
    1. Seifert R. A. et al., Two different subunits associate to create isoform-specific platelet-derived growth factor receptors. J Biol Chem 264, 8771–8778 (1989). - PubMed

Publication types