[Preprint]. 2023 Dec 25:2023.12.24.573224.
doi: 10.1101/2023.12.24.573224.

A Combination of Four Nuclear Targeted Effectors Protects Toxoplasma Against Interferon Gamma Driven Human Host Cell Death During Acute Infection

Affiliations

A Combination of Four Nuclear Targeted Effectors Protects Toxoplasma Against Interferon Gamma Driven Human Host Cell Death During Acute Infection

Brittany Henry et al. bioRxiv. .

Update in

Abstract

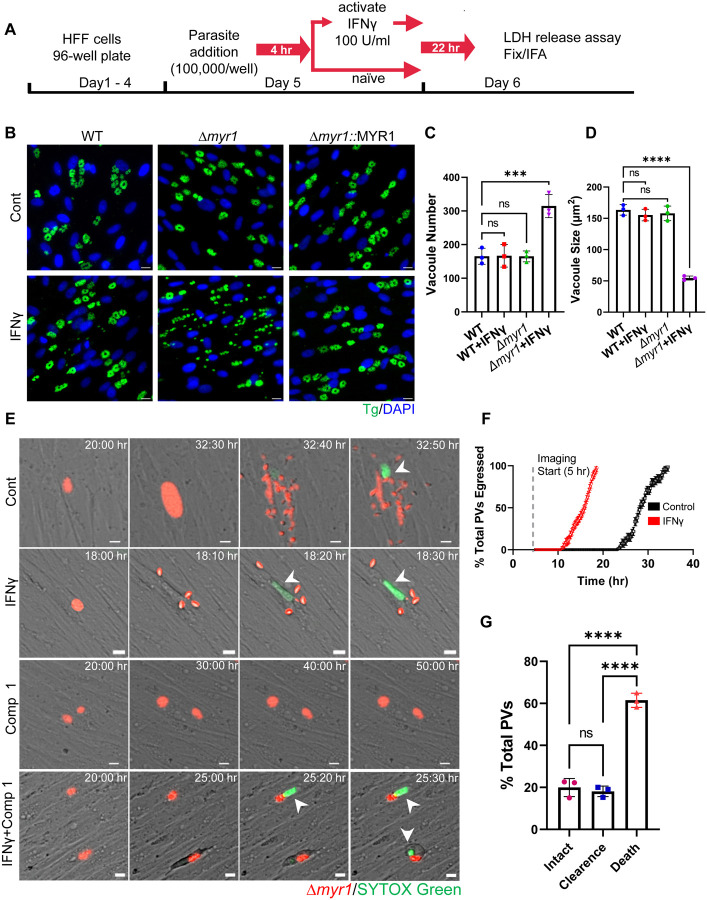
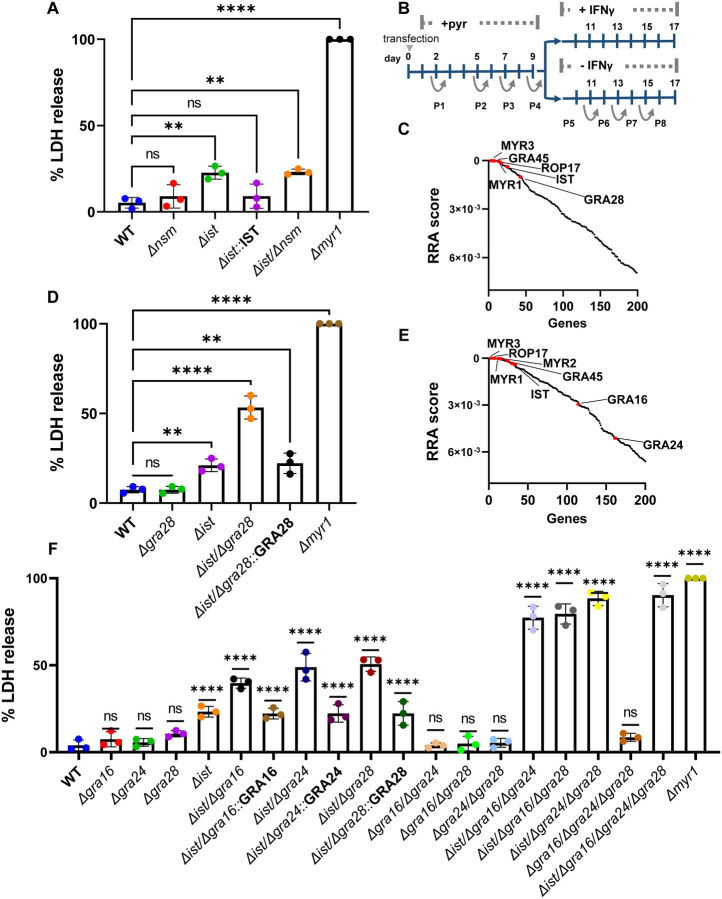
In both mice and humans, Type II interferon-gamma (IFNγ) is crucial for regulation of Toxoplasma gondii (T. gondii) infection, during acute or chronic phases. To thwart this defense, T. gondii secretes protein effectors hindering the hosťs immune response. For example, T. gondii relies on the MYR translocon complex to deploy soluble dense granule effectors (GRAs) into the host cell cytosol or nucleus. Recent genome-wide loss-of-function screens in IFNγ-primed primary human fibroblasts identified MYR translocon components as crucial for parasite resistance against IFNγ driven vacuole clearance. However, these screens did not pinpoint specific MYR-dependent GRA proteins responsible for IFNγ signaling blockade, suggesting potential functional redundancy. Our study reveals that T. gondii depends on the MYR translocon complex to prevent host cell death and parasite premature egress in human cells stimulated with IFNγ postinfection, a unique phenotype observed in various human cell lines but not in murine cells. Intriguingly, inhibiting parasite egress did not prevent host cell death, indicating this mechanism is distinct from those described previously. Genome-wide loss-of-function screens uncovered TgIST, GRA16, GRA24, and GRA28 as effectors necessary for a complete block of IFNγ response. GRA24 and GRA28 directly influenced IFNγ driven transcription, GRA24's action depended on its interaction with p38 MAPK, while GRA28 disrupted histone acetyltransferase activity of CBP/p300. Given the intricate nature of the immune response to T. gondii, it appears that the parasite has evolved equally elaborate mechanisms to subvert IFNγ signaling, extending beyond direct interference with the JAK/STAT1 pathway, to encompass other signaling pathways as well.


Conflict of interest statement

Conflicts: The authors declare no conflicts.

Figures

Figure 1.
Figure 1.. IFNγ stimulation following infection is countered by MYR1, preventing early tachyzoite egress and host cell death.
(A) Schematic illustration of the workflow used to examine tachyzoite growth dynamics. HFF cells were inoculated into 96-well plates and allowed to reach confluency prior to the addition of parasites (100,000/well). Parasites were allowed to invade for 4 hr prior to ± IFNγ 100 U/ml treatment for 22 hr followed by LDH release assay, fixation and IF staining. (B) Representative images of HFFs infected with RH (WT), Δmyr1 and Δmyr1::MYR1 complement mutants and treated as in (A). Cells were labelled with DAPI for nuclei (blue) and anti-GAP45 for parasites (green). Scale bar = 20 μm. (C) Average PV number per field. (D) Average PV size. Data in (C) and (D) represent means ± SD of three biological replicates conducted in technical duplicate with at least 30 images per sample and replicate. Statistical significance was determined using one-way ANOVA with Dunnett’s multiple comparison test. ***P<0.001, ****P<0.0001. (E) Time-lapse images of HFFs infected for 4 hr with RH Δmyr1-mCherry mutants (red) prior to ± IFNγ 100 U/ml treatment in the presence of STOX green (150 nM) (green) combined with ± 5 μM Compound 1. Live infection was imaged every 10 min starting 5 hr postinfection until 60 hr postinfection. Scale bar = 5 μm. (F) Time of ± IFNγ stimulated Δmyr1-mCherry parasites egress was recorded for at least 100 PVs per condition per replicate. The percentage of total parasites egressed by the end of each hour is indicated. (G) Quantification Δmyr1-mCherry parasites and infected host cell fate in IFNγ stimulated cells in presence of Compound 1 (5 μM). Data from three independent experiments were pooled. Mean ± SD (n = 3 experiments, 100 parasite vacuoles were counted in each treatment). Statistical significance was determined using one-way ANOVA with Tukey’s multiple comparison test. **** P < 0.0001.
Figure 2.
Figure 2.. The early egress phenotype induced by IFNγ is distinct to human cells.
(A) Human: HFF, HFF-hTERT, A549, HCT-8, SH-SY5Y, THP-1 and murine: NIH-3T3, L929, MEFs, RAW264.7 cell lines were infected with RH Δmyr1 mutants for 4 hr prior to ± IFNγ 100 U/ml treatment. Cell supernatant was collected 26 hr after infection LDH activity was determined to measure cell lysis. LDH release was calculated as the percent of maximal LDH release (after triton treatment of cells). Data from three independent experiments were pooled. Mean ± SD (n = 3 experiments, each with 3 technical replicates counted in each treatment). **** P < 0.001, one-way ANOVA test with Sidak’s multiple comparison test. (B) Representative images of NIH-3T3 cells infected with RH, Δmyr1 and Δmyr1::MYR1 complement parasites for 4 hr prior to ± IFNγ 100 U/ml treatment. Twenty-six hours post infection cells were fixed and labelled with DAPI for nuclei (blue) and anti-GAP45 for parasites (green). Scale bar = 20 μm. (C) LDH release in the supernatant of NIH-3T3 cells was measured 26 hr post infection. Plotted is the percent of LDH release compared to maximal LDH release (after triton treatment of cells). (D) Average PV size. Data in (C) represents Mean ± SD of three biological replicates Mean ± SD (n = 3 experiments, each with 3 technical replicates counted in each treatment). Statistical significance was determined using one-way ANOVA test with Dunnett’s multiple comparison test. Data in (D) represents Mean ± SD of three biological replicates conducted in technical duplicate with at least 30 images per sample and replicate. Statistical significance was determined using one-way ANOVA with Dunnett’s multiple comparison test. ***P<0.001.
Figure 3.
Figure 3.. T. gondii tachyzoites depend on TgIST, GRA16, GRA24 and GRA28 to block IFNγ driven premature egress.
(A) HFFs were infected with RH (WT), Δnsm, Δist, Δist::IST, Δist/Δnsm and Δmyr1 mutants for 4 hr prior to ± IFNγ 100 U/ml treatment. Cell supernatant was collected 26 hr after infection and LDH activity was determined to measure cell lysis. (B) Screening Process: RH-Cas9 parasites underwent transfection with linearized plasmids housing 10 sgRNAs targeting each Toxoplasma gene. The transfected parasites were then propagated through four passages in HFFs under pyrimethamine selection to eliminate non-transfected parasites and those with integrated plasmids containing sgRNAs targeting genes crucial for fitness in HFFs. Following this, the pool of mutant parasites underwent four additional passages, either in naive or IFNγ-stimulated HFFs, 4 hours post-infection. (C) The RRA score distribution of top 200 negative selected genes (IFNγ vs naϊve)), reported by the MAGeCK algorithm. (D) LDH release in HFFs infected with RH (WT), Δist, Δgra28, Δist/Δgra28, Δist/Δgra28::GRA28 complement and Δmyr1 mutants for 4 hr prior to prior to ± IFNγ 100 U/ml treatment was determined to measure cell lysis. (E) RRA score distribution of top 200 negative selected genes (IFNγ vs naϊve) in a screen performed in the RH cas9 Δgra28 mutant. (F) LDH release in HFFs infected with various RH mutants for 4 hr prior to ± IFNγ 100 U/ml treatment was determined to measure cell lysis. LDH release was calculated as percent of LDH release in Δmyr1 mutant (A, D, F) and represents Mean ± SD of three biological replicates Mean ± SD (n = 3 experiments, each with 3 technical replicates counted in each treatment. The mean values for the mutants were compared with that for WT using one-way ANOVA with Dunnett’s multiple comparison test; **P < 0.01, ****P<0.0001.
Figure 4.
Figure 4.. GRA28 targets CBP/p300 histone acetyltransferase and blocks IFNγ driven transcriptional response.
(A) GAS luciferase reporter constructs were transiently transfected into HeLa cells with different combinations of IST, GRA16, GRA24, GRA24 ΔR1/R2, GRA28, or empty vector. Twenty-four hours later, transfected cells were treated with IFNγ at (100 U/mL for 24 hr) and firefly luciferase activity was determined. The transfection efficiency was normalized against the-Rennila luciferase activity from the cotransfected pRL-TK vector. Results shown are fold induction over unstimulated control and represent the averages from 3 biological replicates done in duplicate. Each point represents a biological replicate. Mean ± SD (n = 3 experiments, each with 2 replicates). The mean values for the mutants were compared with that for WT using one-way ANOVA with Dunnett’s multiple comparison test; **P < 0.01, ****P<0.0001. (B) GRA28Ty-associated host proteins identified by mass spectrometry (MS) analysis. GRA28-Ty immunoprecipitated from RH GRA28-Ty vs. wildtype untagged RH parasite infected HFF cells. Combination of three experiments showing proteins that were solely identified in GRA28-Ty and not in wildtype infected cells. Identity of the proteins with their respective number of peptides are indicated, CBP and p300 are in red. (C) Three replicates of MS analysis data sets generated with GRA28-Ty and WT IP experiments were analyzed using SFINX to filter out false-positive interactions and rank true-positives. CBP and p300 were identified as GRA28 interactors with high statistical confidence. (C) Western blot analysis of GRA28-Ty and GRA16-Ty immunoprecipitated from nuclear lysates of HEK 293T cells that were transfected with p300-HA. Twenty-four hours after transfection, cells were infected with RH either expressing Ty-tagged GRA28 or GRA16 for 16 hr. The nuclear protein fractions were resolved on SDS-PAGE gels and different proteins were probed with primary antibodies and imaged with LICOR specific secondary antibodies. Equal amounts of nuclear lysates used for immunoprecipitation are loaded alongside as nuclear input controls. Images represent one of two blots performed, all showing similar results.
Figure 5.
Figure 5.. GRA28 perturbs CBP/p300 histone acyltransferase activity.
(A) HEK 293T cells were transfected with CBP-HA or p300-HA in combination with GRA28-Ty or empty vector. Twenty-four hours after transfection, cells were collected lysed and fractionated into cytoplasmic and nuclear fractions. The cytosolic and nuclear extractions were resolved on SDS-PAGE gels, blotted with primary antibodies, and imaged with LI-COR specific secondary antibodies. Tubulin and Histone H3 were used as loading controls. (B) Quantification and statistics of the H3K27 acetylation (H3K27ac) in (A). Intensities of the bands corresponding to H3K27ac were measured by Image Studio then relative intensity was adjusted to H3 intensity. GRA28 driven change in H3K27ac levels were quantified from three biological replicates and is presented as a fold change between GRA28 transfected and control cells. Data presented as Mean ± SD. from three independent experiments. Statistical significance was determined using one-way ANOVA with Dunnett’s multiple comparison test. ***P<0.0001. (B) Representative images showing endogenous levels of H3K27ac in HFFs infected with RH (WT), Δgra28 mutant or Δgra28::GRA28 complement. Cells were fixed 24 hr post-infection, stained with rabbit anti-H3K27ac and guinea pig anti-TgSERCA and anti-rabbit IgG Alexa Fluor 488 (white) and anti-guinea pig IgG Alexa Fluor 568 (magenta) and DAPI (blue). Scale bars = 5 μm. The graphs show the mean of nuclear H3K27ac intensity in at least 150 infected (red arrow) or uninfected cells (UI) (white arrow) per sample. Data shown are representative of three independent experiments that gave similar results. ****P < 0.0001 using one-way ANOVA test with Dunnett’s multiple comparison test.

Similar articles

References

    1. Webster JP. 2010. Dubey J.P. Toxoplasmosis of Animals and Humans. Parasites & Vectors 3:112.
    1. Sibley LD, Ajioka JW. 2008. Population structure of Toxoplasma gondii: clonal expansion driven by infrequent recombination and selective sweeps. Annu Rev Microbiol 62:329–51. - PubMed
    1. Furtado JM, Smith JR, Belfort R Jr., Gattey D, Winthrop KL. 2011. Toxoplasmosis: a global threat. J Glob Infect Dis 3:281–4. - PMC - PubMed
    1. Cerutti A, Blanchard N, Besteiro S. 2020. The Bradyzoite: A Key Developmental Stage for the Persistence and Pathogenesis of Toxoplasmosis. Pathogens 9. - PMC - PubMed
    1. Clough B, Frickel EM. 2017. The Toxoplasma Parasitophorous Vacuole: An Evolving Host-Parasite Frontier. Trends Parasitol 33:473–488. - PubMed

Publication types