[Preprint]. 2023 Dec 26:2023.12.26.573302.
doi: 10.1101/2023.12.26.573302.

Single nucleus RNA sequencing reveals glial cell type-specific responses to ischemic stroke

Affiliations

Single nucleus RNA sequencing reveals glial cell type-specific responses to ischemic stroke

Daniel Bormann et al. bioRxiv. .

Update in

Abstract

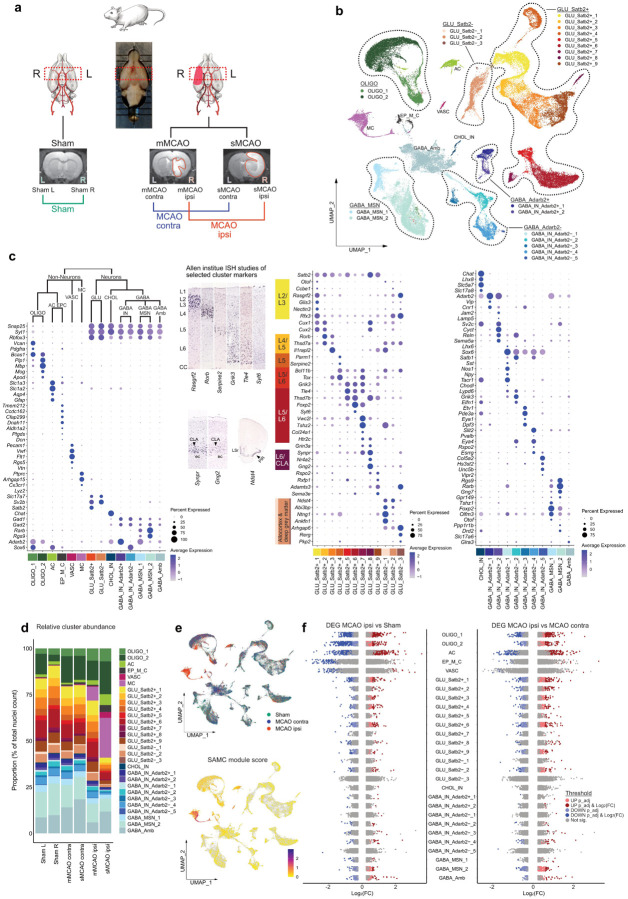
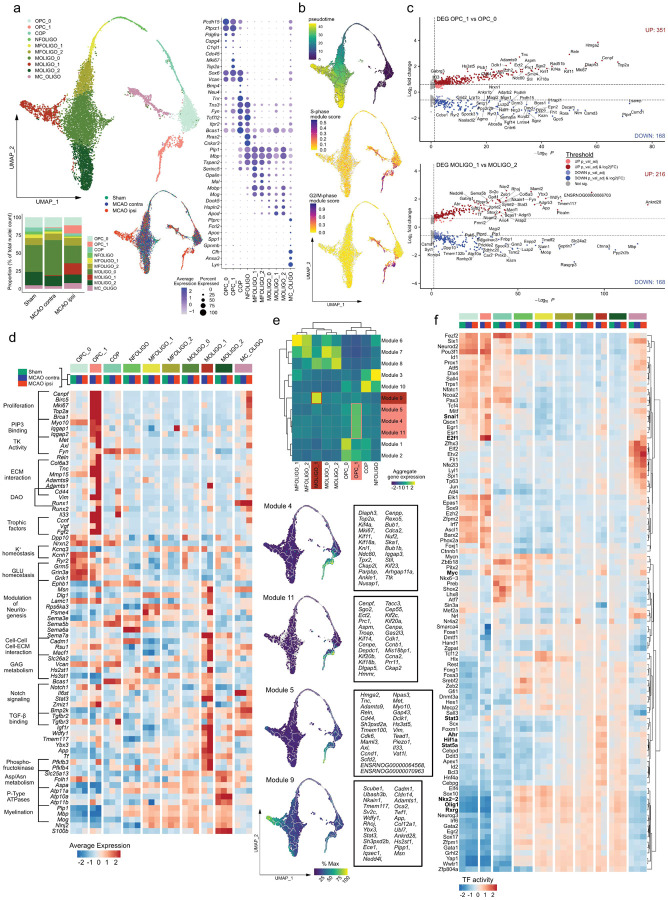
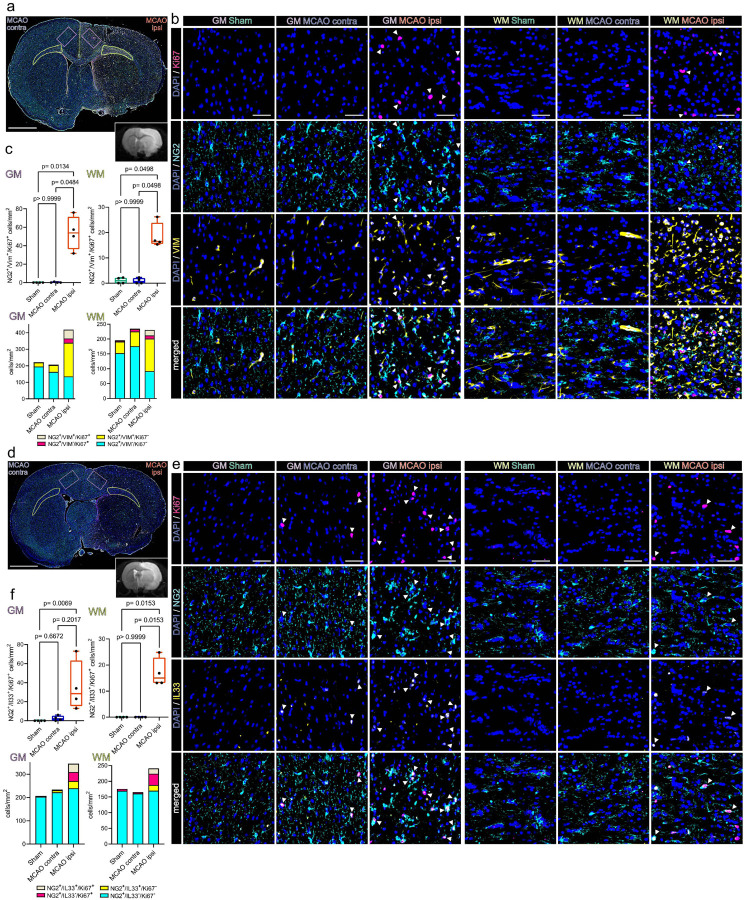
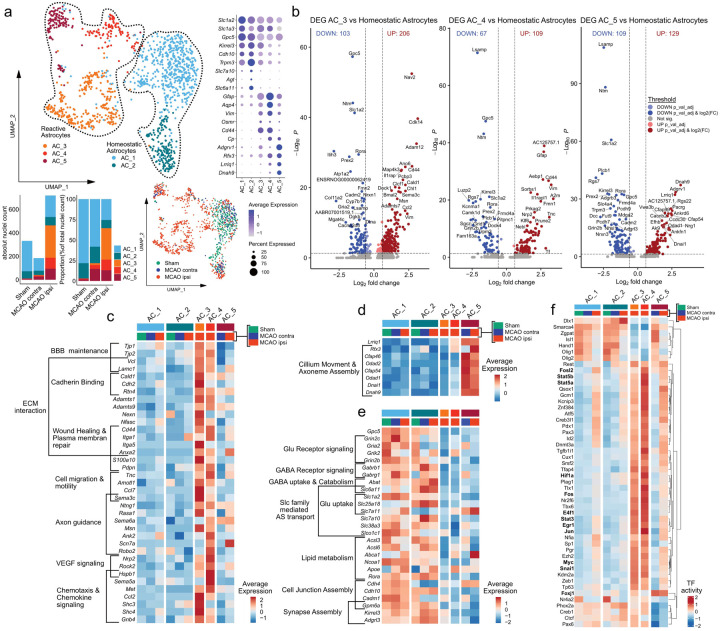
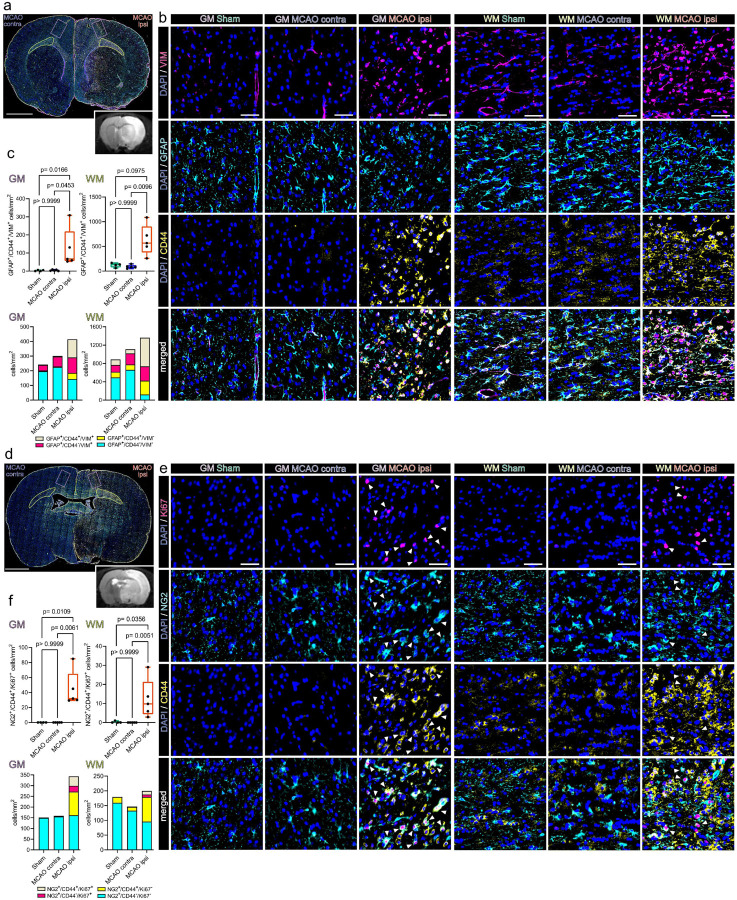
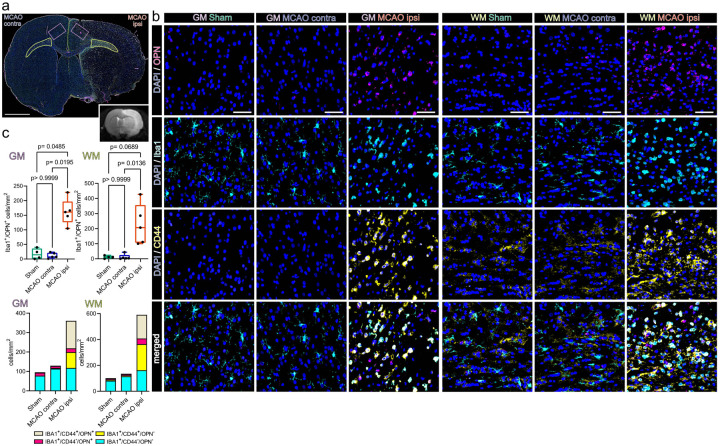
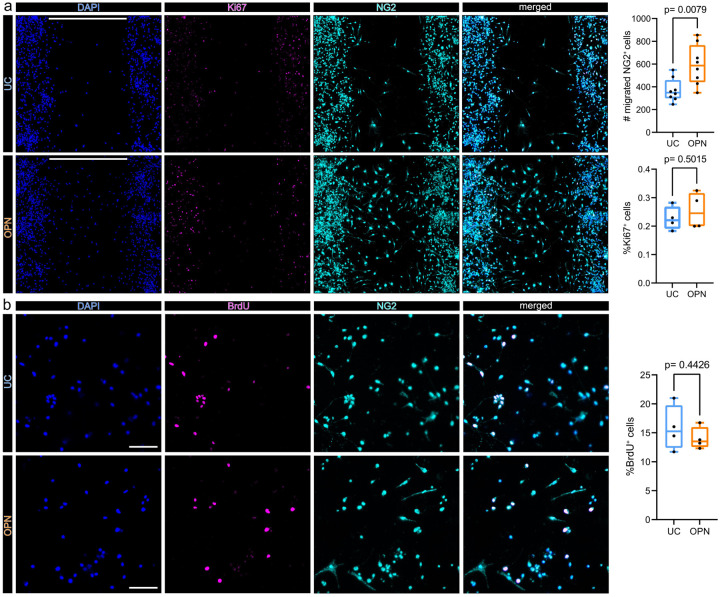
Reactive neuroglia critically shape the braińs response to ischemic stroke. However, their phenotypic heterogeneity impedes a holistic understanding of the cellular composition and microenvironment of the early ischemic lesion. Here we generated a single cell resolution transcriptomics dataset of the injured brain during the acute recovery from permanent middle cerebral artery occlusion. This approach unveiled infarction and subtype specific molecular signatures in oligodendrocyte lineage cells and astrocytes, which ranged among the most transcriptionally perturbed cell types in our dataset. Specifically, we characterized and compared infarction restricted proliferating oligodendrocyte precursor cells (OPCs), mature oligodendrocytes and heterogeneous reactive astrocyte populations. Our analyses unveiled unexpected commonalities in the transcriptional response of oligodendrocyte lineage cells and astrocytes to ischemic injury. Moreover, OPCs and reactive astrocytes were involved in a shared immuno-glial cross talk with stroke specific myeloid cells. In situ, osteopontin positive myeloid cells accumulated in close proximity to proliferating OPCs and reactive astrocytes, which expressed the osteopontin receptor CD44, within the perilesional zone specifically. In vitro, osteopontin increased the migratory capacity of OPCs. Collectively, our study highlights molecular cross talk events which might govern the cellular composition and microenvironment of infarcted brain tissue in the early stages of recovery.

Keywords: Single nucleus RNA sequencing (snRNAseq); astrocytes; cerebral ischemia; ischemic stroke; myeloid cells; oligodendrocyte precursor cells; oligodendrocytes.


Conflict of interest statement

Conflict of interest The authors declare that the research has been performed without any conflict of interest.

Figures

Figure 1.
Figure 1.. snRNAseq reveals differential cell cluster abundance and cluster specific transcriptional perturbations 48h after ischemic stroke.
(a) Illustration of study design, depicting brain regions sampled for snRNAseq, from n=4 Sham control rats and n=7 MCAO rats. MRI images of brain tissue from Sham operated, mMCAO and sMCAO rats are presented, ischemic lesions are highlighted in red. (b) UMAP plot depicting 68616 nuclei annotated to 29 major cell clusters in the overall integrated dataset. Cell cluster abbreviations: AC: astrocyte cluster, CHOL_IN: cholinergic interneurons, EP_M_C: ependymal and mural cell cluster, GABA_Amb: Ambiguous GABAergic neuronal cluster, GABA_IN_Adarb2+, GABA_IN_Adarb2-: GABAergic interneurons, Adarb2 positive/negative, respectively, GABA_MSN: GABAergic medium spiny neurons, GLU_Satb2+, GLU_Satb2-: Glutamatergic neurons, Satb2 positive/negative, respectively, OLIGO_1: immature oligodendrocyte lineage cluster, OLIGO_2: myelinating and mature oligodendrocyte lineage cluster. (c) Dotplots depicting curated marker genes for all major cell clusters. The dendrogram on top of the left dotplot represents overarching taxons of identified major cell clusters. The dotplot in the middle depicts curated cluster markers of glutamatergic neurons. Colored bars next to the gene names denote established associations to cortical layers. Representative corresponding RNA in situ hybridization (ISH) results are depicted next to the colored bars. All RNA ISH studies were taken from Allen Brain Atlas database [57], and are referenced in detail in Suppl.Tab.3. Abbreviations: L = layer, CLA = claustrum, ec = external capsule, LSr = lateral septal nucleus, PIR = piriform cortex. Dotplot on the right shows marker gene expression in cholinergic and GABAergic neurons. (d) Stacked bar plot depicting the relative abundance of each cell cluster within each sample. (e) Top: Nuclei distribution coloured by treatment group. Bottom: Gene module score derived from the stroke-associated myeloid cell (SAMC) gene set [10]. (f) Strip plots depicting distribution of DEGs derived from MCAO ipsi vs Sham and MCAO ipsi vs MCAO contra comparisons, for all major cell clusters.
Figure 2.
Figure 2.. Emergence of transcriptionally distinct OPCs and mature oligodendrocytes within infarcted brain tissue.
(a) Subclustering of oligodendrocyte lineage clusters. Top left: UMAP plot depicting 10240 nuclei annotated to 10 subclusters, bottom left: stacked bar plot depicting the relative abundance of each subcluster within each group, bottom right: Nuclei distribution coloured by treatment group, right panel: dotplot depicting curated sub cluster markers. Subcluster abbreviations: OPC: oligodendrocyte precursor cell, COP: committed oligodendrocyte precursor, NFOLIGO: newly formed oligodendrocyte, MFOLIGO: myelin forming oligodendrocyte, MOLIGO: mature oligodendrocyte, MC_OLIGO: myeloid cell oligodendrocyte mixed cluster. (b) Top: Projection of Monocle3 generated pseudotime trajectory onto subcluster UMAP plot, with subcluster OPC_0 as root. Feature Plots depicting S-phase (middle) and G2/M-phase (bottom) gene module scores. (c) Volcano plots depicting DEGs derived from the comparison of clusters OPC_1 to OPC_0 (top) and MOLIGO_1 to MOLIGO_2 (bottom). (d) Heatmap depicting the average scaled gene expression of curated DEGs, split by subcluster and treatment group. Functional annotations are given on the left side of the gene names. (e) Top: Clustered heatmap depicting aggregate gene expressions of Monocle3 derived co-regulated gene modules. Modules associated to OPC_1 and MOLIGO_1 are highlighted in light and dark red, respectively. Bottom: The average aggregate expression of the OPC_1 and MOLIGO_1 associated modules is plotted along the pseudo time trajectory. The Top 25 module defining genes, as sorted by descending Morańs I, are depicted in boxes on the right side of the respective gene module feature plots. (f) Heatmap depicting the top 100 most variable decoupleR derived transcription factor activities, within the oligodendrocyte lineage sub clustering analysis, split by sub cluster and treatment group.
Figure 3.
Figure 3.. Proliferating OPCs accumulate in the perilesional zone 48 h after ischemic stroke and express VIM and IL33.
(a) Overview of a representative coronal brain section 48 h post MCAO, stained for NG2, VIM and Ki67. Grey matter ROIs (GM) are highlighted in violet, white matter ROIs (WM) in lime green, lower right inset depicts a corresponding T2 weighted MRI image from the same animal. Bar = 2 mm (b) Representative images from GM and WM ROIs of Sham, MCAO contra and MCAO ipsi sections, split by antigen. Ki67 = magenta, NG2 = Cyan, VIM = yellow, DAPI (nuclei) = blue, bars = 50 μm. White arrowheads point to triple positive cells. (c) Cell counts within GM and WM respectively are presented as box plots for NG2+/VIM+/Ki67+ triple positive cells. Cell counts for NG2+/VIM+/Ki67+, NG2+/VIM/Ki67+, NG2+/VIM+/Ki67, NG2+/VIM/Ki67 are also jointly shown as colored stacked bar plot. (d) Representative coronal overview, 48 h post MCAO, stained for NG2, IL33, Ki67. GM ROIs in violet, WM ROIs in lime green, lower right inset shows a corresponding MRI image from the same animal. Bar = 2 mm (e) Representative images from GM and WM ROIs derived from Sham, MCAOcontra and MCAOipsi groups, split by antigen. Ki67 = magenta, NG2 = Cyan, IL33 = yellow, DAPI (nuclei) = blue, bars = 50 μm White arrowheads point to triple positive cells. (f) Cell counts within GM and WM are presented as box plots for NG2+/IL33+/Ki67+ triple positive cells. Cell counts for NG2+/IL33+/Ki67+, NG2+/IL33/Ki67+, NG2+/IL33+/Ki67, NG2+/IL33/Ki67 are also jointly shown as colored stacked bar plot. Data derived from n = 4–5 animals per group, p values derived from Kruskal-Wallis-H-Tests, followed by Dunn’s post hoc comparisons.
Figure 4.
Figure 4.. Transcriptional heterogeneity of reactive astrocytes within infarcted brain tissue.
(a) Subclustering analysis of astrocytes. Top left: UMAP plot depicting 1233 nuclei annotated to 5 subclusters, bottom left: stacked bar plots depicting the absolute and relative abundance of each subcluster within each group, bottom right: Nuclei distribution coloured by group, right panel: Dotplot depicting curated homeostatic and reactive astrocyte marker genes. (b) Volcano plots depicting DEG derived from the comparison of the reactive astrocyte subclusters AC_3 (left), AC_4 (middle) and AC_5 (right) to the homeostatic astrocyte subclusters (AC_1 and AC_2, pooled). (c–f) Heatmaps depicting the average scaled gene expression of curated upregulated DEGs, derived from the comparison of AC_3 and AC_4 (c) and AC_5 (d) to homeostatic astrocytes, as well as DEGs downregulated in reactive astrocytes (e), split by subcluster and group. (f) Clustered heatmap depicting the top 50 most variable decoupleR derived transcription factor activities, within the astrocyte lineage subclustering analysis, split by subcluster and treatment group.
Figure 5.
Figure 5.. Reactive astrocytes and proliferating OPCs are CD44 positive and abundant in the perilesional zone 48 h after ischemic stroke.
(a) Overview of a representative coronal brain section 48 h post MCAO, stained for GFAP, CD44 and VIM. Grey matter ROIs (GM) are highlighted in violet, white matter ROIs (WM) in lime green, lower right inset depicts a corresponding T2 weighted MRI image from the same animal. Bar = 2mm (b) Representative images taken from GM and WM ROIs of Sham, MCAO contra and MCAO ipsi sections, split by antigen. VIM = magenta, GFAP = Cyan, CD44 = yellow, all overlaid with DAPI (nuclei) = blue. Bars = 50 μm. White arrowheads point to NG2+/CD44+/Ki67+ triple positive cells. (c) Cell counts within GM and WM are presented as box plots for GFAP+/CD44+/VIM+ triple positive cells. Cell counts for GFAP+/CD44+/VIM+, GFAP+/CD44/VIM+, GFAP+/CD44+/VIM, GFAP+/CD44/VIM are also jointly shown as colored stacked bar plot. (d) Representative coronal overview, 48 h post MCAO, stained for NG2, CD44, Ki67. GM ROIs in violet, WM ROIs in lime green, lower right inset shows corresponding MRI image from the same animal. Bar = 2mm (e) Representative images from GM and WM ROIs taken from Sham, MCAO contra and MCAO ipsi groups, split by antigen. Ki67 = magenta, NG2 = Cyan, CD44 = yellow. Bars = 50 μm. White arrowheads point to NG2+/CD44+/Ki67+ triple positive cells. (f) Cell counts within GM and WM respectively are presented as box plots for NG2+/CD44+/Ki67+. Cell counts for NG2+/CD44+/Ki67+, NG2+/CD44/Ki67+, NG2+/CD44+/Ki67, NG2+/CD44/Ki67 are also jointly shown as colored stacked bar plot. Data derived from n = 4–5 animals per group, p values derived from Kruskal-Wallis-H-Tests, followed by Dunn’s post hoc comparisons.
Figure 6.
Figure 6.. Osteopontin positive myeloid cells accumulate in the perilesional zone in close proximity to CD44 positive cells 48 h after ischemic stroke.
(a) Overview of a representative coronal brain section 48 h post MCAO, stained for Iba1, CD44 and OPN. Grey matter ROIs (GM) are highlighted in violet, white matter ROIs (WM) in lime green, lower right inset depicts a corresponding T2 weighted MRI image from the same animal. Bar = 2 mm. (b) Representative images from GM and WM ROIs of Sham, MCAOcontra and MCAO ipsi sections, split by antigen. OPN = magenta, Iba1 = cyan, CD44 = yellow. Bar = 50 μm. (c) Cell counts within GM and WM are presented as box plots for Iba1+/OPN+ double positive cells, cell counts for Iba1+/CD44+/OPN+, Iba1+/CD44/OPN+, Iba1+/CD44+/OPN, Iba1+/CD44/OPN are jointly shown as colored stacked bar plot. Data derived from n = 4–5 animals per group, p values derived from Kruskal-Wallis-H-Tests, followed by Dunn’s post hoc comparisons.
Figure 7.
Figure 7.. Osteopontin induces OPC migration but not proliferation in vitro.
(a) In vitro cell migration assay. Cells were seeded in 2 well culture inserts, creating defined 500 μm gaps. NG2 positive cells which migrated into the 500 μm gap were quantified after 48 h of treatment. Representative images of OPC cell cultures 48 h after incubation without (upper panel: untreated control = UC), or with 1 μg/ml OPN (lower panel), stained for DAPI (nuclei) = blue, Ki67 = magenta and NG2 = cyan, split by channel. Scale bars denote 500 μm gaps. Box plots on the right show the number of NG2 positive cells, which migrated into 500 μm gaps, for each condition, p-values derived from unpaired studentś t-test (t=3,097, df=14, n=8 replicates per group, from 2 independent experiments). In n = 4 replicates per group from 2 independent experiments Ki67 was visualized. Lower Boxplot depicts the percentages of Ki67+ cells within the 500 μm gap, for each condition, p values derived from unpaired studentś t test (t=0,7150, df=6). (b) BrdU incorporation assay. BrdU incorporation was visualized 24h after incubation without (UC) (upper panel) or with 1 μg/ml OPN (lower panel). Representative 20x magnification images are shown, stained for DAPI (Nuclei) = blue, BrdU = magenta and NG2 = cyan, split by channel. Scale bars = 100 μm. Boxplot depicts the percentages of BrdU+ cells, for each group, p values derived from unpaired studentś t-test (t=0,8219, df=6, n=4 replicates per group, from 1 independent experiment).

References

    1. Absinta M, Maric D, Gharagozloo M, Garton T, Smith MD, Jin J, Fitzgerald KC, Song A, Liu P, Lin JP et al. (2021) A lymphocyte-microglia-astrocyte axis in chronic active multiple sclerosis. Nature 597: 709–714 Doi 10.1038/s41586-021-03892-7 - DOI - PMC - PubMed
    1. Al’Qteishat A, Gaffney J, Krupinski J, Rubio F, West D, Kumar S, Kumar P, Mitsios N, Slevin M (2006) Changes in hyaluronan production and metabolism following ischaemic stroke in man. Brain 129: 2158–2176 Doi 10.1093/brain/awl139 - DOI - PubMed
    1. Al Qteishat A, Gaffney JJ, Krupinski J, Slevin M (2006) Hyaluronan expression following middle cerebral artery occlusion in the rat. Neuroreport 17: 1111–1114 Doi 10.1097/01.wnr.0000227986.69680.20 - DOI - PubMed
    1. Ali MF, Latimer AJ, Wang Y, Hogenmiller L, Fontenas L, Isabella AJ, Moens CB, Yu G, Kucenas S (2021) Met is required for oligodendrocyte progenitor cell migration in Danio rerio. G3 (Bethesda) 11: Doi 10.1093/g3journal/jkab265 - DOI - PMC - PubMed
    1. Anfray A, Brodin C, Drieu A, Potzeha F, Dalarun B, Agin V, Vivien D, Orset C (2021) Single- and two- chain tissue type plasminogen activator treatments differentially influence cerebral recovery after stroke. Exp Neurol 338: 113606 Doi 10.1016/j.expneurol.2021.113606 - DOI - PubMed

Publication types