[Preprint]. 2025 Feb 10:2023.12.24.573264.
doi: 10.1101/2023.12.24.573264.

Immune-responsive gene-1: The mitochondrial Key to Th17 Cell Pathogenicity in CNS Autoimmunity

Affiliations

Immune-responsive gene-1: The mitochondrial Key to Th17 Cell Pathogenicity in CNS Autoimmunity

Mohammad Nematullah et al. bioRxiv. .

Update in

Abstract

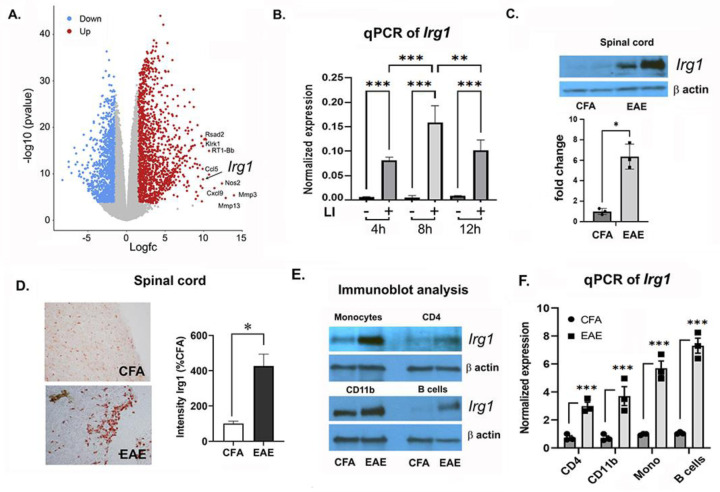
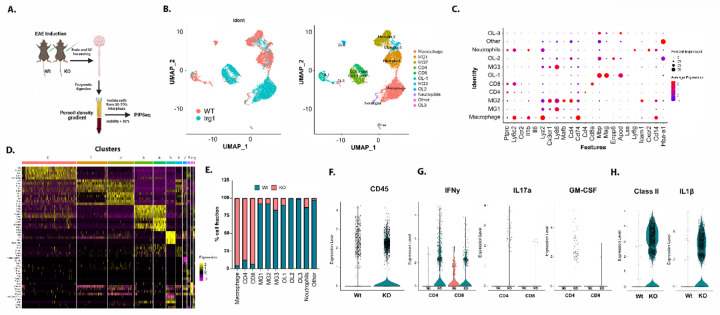
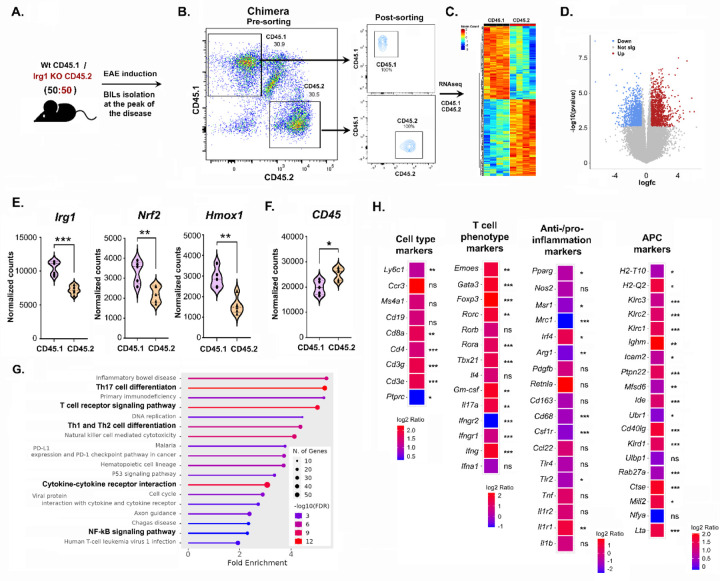
Pathogenic Th17 cells play crucial roles in CNS autoimmune diseases such as multiple sclerosis (MS), but their regulation by endogenous mechanisms remains unknown. Through RNA-seq analysis of primary brain glial cells, we identified immuno-responsive gene 1 (Irg1) as one of the highly upregulated gene under inflammatory conditions. Validation in the spinal cord of animals with experimental autoimmune encephalomyelitis (EAE), an MS model, confirmed elevated Irg1 levels in myeloid, CD4, and B cells in the EAE group raising the concern if Irg1 is detrimental or protective. Irg1 knockout (KO) mice exhibited severe EAE disease, increased mononuclear cell infiltration, and increased levels of triple-positive CD4+ T cells expressing IL17a, GM-CSF, and IFNγ. A lack of Irg1 in macrophages elevates Class II expression, promoting the polarization of myelin-primed CD4+ T cells into pathogenic Th17 cells via the NLRP3/IL-1β axis. Adoptive transfer in Rag-1 KO and single-cell RNA sequencing highlighted the crucial role of Irg1 in shaping pathogenic Th17 cells. Moreover, bone marrow chimeras revealed that immune cells lacking Irg1 maintained pathogenic and inflammatory phenotypes, suggesting its protective role in autoimmune diseases, including MS.

Keywords: EAE; GM-CSF; IFNγ; IL17a; IL1β; Irg1; Multiple sclerosis; Th17; macrophage.


Conflict of interest statement

DECLARATION OF INTERESTS The authors declare no competing interests.

Figures

Figure 1:
Figure 1:. Irg1 expression is induced in the spinal cords of EAE mice.
A. Volcano plot showing the RNA-seq results showing significantly upregulated (red dots) and downregulated genes (blue dots) after 8 h of LI treatment in comparison with those of untreated rat brain mixed glia, with the top 10 dysregulated genes labeled in black (Padj <0.0005 & logFC >1.5) (N=4). B. Irg1 expression was examined in rat brain mixed glia treated with or without LI for 4 hrs, 8 hrs and 16 hrs (n=3). (*** p >10−6). C. qPCR and immunoblot data revealed the upregulation of Irg1 (normalized to β-actin) in the spinal cord of EAE mice. Data are representative of three independent experiments. D. Representative images of the spinal cord (CFA vs EAE) stained with Irg1. Bar graph representing the quantification of Irg1 expression intensity as a percentage of CFA from a total of three independent experiments. E. Quantitative analysis of Irg1 expression in monocytes, CD4+ cells, CD11b+ macrophages and B cells, presented as the relative protein expression normalized to that of the housekeeping control β-actin and expressed as the fold change compared with that of CFA. F. The results from the qPCR analysis of Irg1 expression in monocytes, CD4+ cells, CD11b+ macrophages and B cells from CFA and EAE mice normalized to that of β-actin, and the data are representative of three independent experiments. The data presented in the bar graph are the means ± SDs. *p < 0.05, **p < 0.01, and ***p < 0.001 compared with the LI or EAE group using Student’s t test or one-way ANOVA.
Figure 2:
Figure 2:. Irg1-KO mice exhibited more severe disease.
A. Wt and Irg1-KO female mice were immunized with MOG35–55 (200 µg/mouse) on day 0 in CFA, and PT was given on days 0 and 2 of immunization. Clinical scores were recorded until 22 d (n = 22). B. Bar graph representing the cumulative score of disease severity in Wt and Irg1-KO mice (n=22). C. Recall response was assessed via ELISA of spleen and LN samples isolated from Wt & Irg1-KO mice (n=5) subjected to MOG (20 µg/ml) treatment. Samples were collected at 72 hr, and the levels of the cytokines IL17a, GM-CSF, IFNγ and IL4 were measured, with error bars representing the S.D. (n=5). D. Representative images showing histopathological changes in the spinal cord tissues of EAE mice in the Wt and Irg1-KO groups at 22 days postimmunization. Sections were stained with hematoxylin and eosin (H&E) and Luxol fast blue (LFB) to visualize cell infiltration and changes in myelin content. E. Flow cytometry analysis revealed the total number of CD45+ cells in the CNSs of Wt and Irg1-KO mice (n=5). F. Flow cytometry t-SNE plot gated on CD45+ cells in BILs from Wt and Irg1-KO mice demonstrating myeloid cell populations; CD11b+, F4/80+, Ly6C+, and CD11c+ populations. G. Flow cytometry analysis showing CD4+ populations in the CNSs of Wt and Irg1-KO mice (n=5). H. Representative flow cytometry t-SNE plot of BILs gated on CD4+ cells demonstrating the IL17a, IFNγ, T-bet, RORγt and GM-CSF populations. I. Bar graph showing CD4+ cells expressing the total positive population of IL17a, IFNγ, and GMCSF, as well as double-positive (IL17-A+IFNγ) and triple-positive (IL17-A+IFNγ+GMCSF) cells in Wt (n=5) and Irg1 KO (n=5) strains. J. Bar graph showing the total positive population of infiltrating macrophages, monocytes and dendritic cells. The data presented in the bar graph are the means ± SDs. *p < 0.05, **p < 0.01, and ***p < 0.001 compared with the Irg1 KO group using Student’s t test or one-way ANOVA.
Figure 3:
Figure 3:. scRNA-seq of CNS tissues from Irg1 KO mice revealed increased infiltration of immune cells during EAE.
A. A schematic representation of scRNA sequencing conducted on the spinal cord from EAE-immunized wild-type and Irg1Ko mice via PIP-Seq. A single-cell suspension of the spinal cord was prepared via Percoll density gradient, and total RNA was isolated and subjected to high-throughput sequencing via PIP-Seq. B. Sc-RNA-seq clusters represented by UMAP, with the first plot showing differences in the cell clusters between the two groups, WT (blue) and Irg1 KO (salmon), and the second plot showing the cell clusters, where each color represents a different cell type with the color key on the right. C. Dot plots showing signature gene expression across the 11 cell clusters. The size of the dots represents the proportion of cells expressing a particular marker, and the color spectrum indicates the mean expression levels of the markers. D. Heatmap showing the expression of the top 5 marker genes across the 11 cell clusters. E. Bar graph showing the percentages of all 11 cell types. F. Violin plots of normalized expression levels of the CD45 gene in WT and Irg1 ko plants grouped by conditions. G. Violin plots of normalized expression levels of the IFNγ, Il17a, and GMCSF genes in Wt and Irg1-KO CD4 and CD8 T cells. H. Violin plots of the normalized expression levels of the MHC-II and IL-1β genes in Wt and Irg1-KO macrophages.
Figure 4:
Figure 4:. Irg1 KO CD4 cells are highly pathogenic in nature.
A. Quantification of CD4+IL17a+ cells after CD4+ cells from Wt and Irg1-KO mice were adoptively transferred into B6 mice (n=5). B. Clinical scores were obtained until 17 d after B6 mice were immunized with MOG35–55 (200 µg/mouse) (n=10). C. Clinical scores were obtained for Rag1 mice after adoptive transfer of CD4+ cells from Wt and Irg1-KO mice, followed by immunization with MOG35–55 (200 µg/mouse) and PT (n=10). The bar graph represents the positive populations of (D) total CD4+ cells (E), CD4+IL17a+ cells ( F ), CD4+ IFNγ+ cells ( G ), CD4+ GMCSF+ cells (H ), CD4+ IL4+ cells and ( I ) double-positive (IL17a+IFNγ+) in Wt and Irg1 KO CD4+T cells received Rag1 mice respectively (N=4). J. Flow cytometry plot (left) gated on CD4+ cells showing double-positive (IL17a+GMCSF+) populations in Rag1 mice, which are presented as a bar graph (right) (N=4). K. Flow cytometry plot (left) gated on CD4+ cells showing triple-positive (IL17a+ IFNγ+ GMCSF+) populations in Rag1 mice, which are presented as a bar graph (right) (N=4). L. ELISA analysis of the levels of the cytokine IL17a in pathogenic and nonpathogenic Th17 cells isolated from Wt and Irg1KO mice (N=5). M. Representative flow cytometry plots (left) of IL17a+ populations in npTh17 and pTh17 cells and data are presented as a bar graph (right) showing the number of IL17a+ cells (MFI) in npTh17 and pTh17 cells (N=5). N. Heatmap showing the mRNA expression of Th17 pathogenic and nonpathogenic signature genes in Wt and KO mice (N=3). O. Immunoblot data of RORγt (normalized to β-actin) in npTh17 and pTh17 cells from Wt and Irg1-KO mice. The data are representative of three independent experiments. P. A ChIP assay was performed to determine the binding of RORγt to the IL17a promoter. The data are presented as the percentage of RORγt binding to the IL17 promoter with respect to the total input. NS not significant, *p < 0.05, **p < 0.01, and ***p < 0.001 compared with the Irg1-KO group using Student’s t test or one-way ANOVA.
Figure 5:
Figure 5:. IL-1β plays a key role in the antigen presentation of Irg1 KO macrophages and is more potent in polarizing MOG-primed CD4 T cells toward pTh17 cells.
A. Representative flow cytometry t-SNE plot of BILs gated on CD45+ cells demonstrating Class II+ populations in Wt and Irg1-KO mice and (B-C.) The bar graph shows populations of Class II-expressing myeloid cells, namely, CD11b+, F4/80+, CD11c+ and Ly6C+ cells (N=5). D-G. The bar graph represents populations of Class II infiltrating macrophages (CD45hi+CD11b+F4/80+), inflammatory DCs (CD45+CD11c+Class II+), infiltrated monocytes (CD45+CD11b+Ly6C+Class II+) and microglia (CD45lowCD11b+Class II+) (N=5). H. Schematic overview of the coculture study using Wt CD4 cells with Wt and Irg1-KO macrophages. I-K. Flow cytometry data gated on CD4+ cells demonstrating the populations of double-positive (IL17a+GM-CSF+) upon coculture of WT CD4 T cells with WT and Irg1-KO macrophages and (J-K) MFI values of positive populations of IL17a+, GMCSF+ and double-positive (IL17a+GM-CSF+) T cells are presented as a bar graph. (N=5). L. Representative flow cytometry t-SNE plot gated on IL−1β+ cells demonstrating populations of IL-1β-producing various myeloid cells; CD11b+, F4/80+, CD11c+, Ly6C+ and Ly6G+ cells. M. Bar graphs represent the positive population of myeloid cells producing IL-1β in WT and Irg1-KO mice. N. Heatmap showing the positive population of myeloid cells producing IL-1β in WT and Irg1-KO mice (N=4). O-R. The bar graph represents the total number of IL-1β+ve-expressing microglia (CD45lowCD11b+), infiltrated macrophages (CD45hi+CD11b+F4/80+), inflammatory DCs (CD45+CD11c+Class II+) and monocytes (CD45+Ly6C+Ly6G-). I. Flow cytometry plot demonstrating populations of IL17a+ and IL17a+GMCSF+ CD4+ cells upon coculture with Wt and Irg1KO macrophages in the presence or absence of αIL-1β (10 ng/ml). T-U. A population of IL17a+ and double-positive (IL17a+GMCSF+) CD4+ cells is presented as a bar graph after myelin-specific CD4+ T cells were cocultured with Wt and Irg1 KO macrophages in the presence or absence of αIL1β (n=3). The data presented here are the means ± SDs. NS, not significant; *p<0.05, **p<0.001, ***p<0.0001 compared with Irg1 KO macrophages cocultured with CD4 cells; Student’s t test, one-way ANOVA.
Figure 6:
Figure 6:. Irg1 expression controls the proinflammatory and pathogenic signatures of infiltrating immune cells in the CNS.
A. Chimera was generated via the use of 50:50 CD45.1 (Wt) and CD45.2 (Irg1 KO) BMs utilizing Bulsulfan method. After 6 weeks, chimeric mice (CD45.2 Irg1 KO: CD45.1 Wt) were immunized with MOG35–55. At the peak of disease, the mice were sacrificed, the brain/spinal cords were harvested, and single-cell suspensions were prepared via the Percoll density-gradient method. B. CD45.1 and CD45.2 cells were gated and FACS-sorted. The sorted populations were rerun on a BD FACSAria™ III to check the purity of the sorted population. C. RNA-seq was performed on CD45.1- and CD45.2-sorted cells from 5 independent animals. Heatmap representing RNA-seq gene expression in the CD45.1 and CD45.2 groups (n=5 animals, padj>0.1 and logFC<0.58). D. Volcano plots showing the LogFC versus - log10 p value of CD45.2 in comparison to that of CD45.1. The dots in blue represent upregulated genes, those in gray represent non significantly upregulated genes, and those in red represent upregulated genes. E. Normalized expression counts for the specific Irg1 gene and Irg1-dependent genes (Nrf2 and Hmox1) are shown along with the expression of the Cd45 gene (F) as a bar graph (Student’s t test, unpaired) *p < 0.05, **p < 0.01, ***p < 0.001, ns= nonsignificant. G. Lollipop plots showing the results of the KEGG analysis, with the length of the lollipops indicating fold enrichment, the color representing -log10(FDR) and the size of the circles representing the number of genes. H. Heatmaps showing the logFC values for cell type, cell phenotype markers, macrophage anti- and proinflammatory genes and antigen presentation/processing genes. The color key is shown on the side. Significance is shown on the side of each gene. *p < 0.05, **p < 0.01, ***p < 0.001, ns= nonsignificant.

References

    1. Almolda B., Gonzalez B., and Castellano B.. 2011. Antigen presentation in EAE: role of microglia, macrophages and dendritic cells. Front Biosci (Landmark Ed) 16: 1157–1171. - PubMed
    1. Chastain E. M., Duncan D. S., Rodgers J. M., and Miller S. D.. 2011. The role of antigen presenting cells in multiple sclerosis. Biochim Biophys Acta 1812: 265–274. - PMC - PubMed
    1. Loos J., Schmaul S., Noll T. M., Paterka M., Schillner M., Loffel J. T., Zipp F., and Bittner S.. 2020. Functional characteristics of Th1, Th17, and ex-Th17 cells in EAE revealed by intravital two-photon microscopy. J Neuroinflammation 17: 357. - PMC - PubMed
    1. Moser T., Akgun K., Proschmann U., Sellner J., and Ziemssen T.. 2020. The role of TH17 cells in multiple sclerosis: Therapeutic implications. Autoimmun Rev 19: 102647. - PubMed
    1. Bomfim C. C. B., Fisher L., Amaral E. P., Mittereder L., McCann K., Correa A. A. S., Namasivayam S., Swamydas M., Moayeri M., Weiss J. M., Chari R., McVicar D. W., Costa D. L., D’Imperio Lima M. R., and Sher A.. 2022. Mycobacterium tuberculosis Induces Irg1 in Murine Macrophages by a Pathway Involving Both TLR-2 and STING/IFNAR Signaling and Requiring Bacterial Phagocytosis. Front Cell Infect Microbiol 12: 862582. - PMC - PubMed

Publication types