[Preprint]. 2024 Oct 11:rs.3.rs-3793919.
doi: 10.21203/rs.3.rs-3793919/v3.

Long non-coding RNA Malat1 fine-tunes bone homeostasis and repair by orchestrating cellular crosstalk and the β-catenin-OPG/Jagged1 pathway

Affiliations

Long non-coding RNA Malat1 fine-tunes bone homeostasis and repair by orchestrating cellular crosstalk and the β-catenin-OPG/Jagged1 pathway

Yongli Qin et al. Res Sq. .

Update in

Abstract

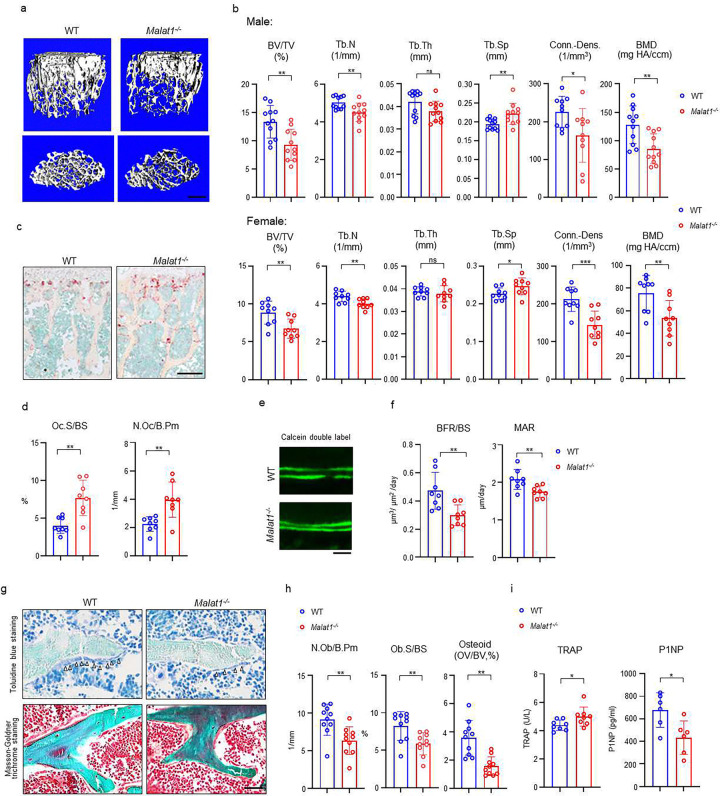
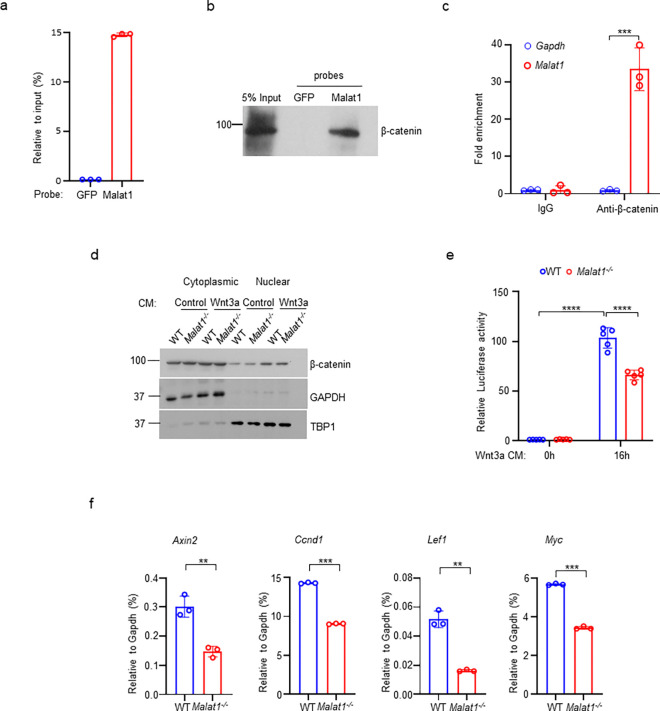
The IncRNA Malat1 was initially believed to be dispensable for physiology due to the lack of observable phenotypes in Malat1 knockout (KO) mice. However, our study challenges this conclusion. We found that both Malat1 KO and conditional KO mice in the osteoblast lineage exhibit significant osteoporosis. Mechanistically, Malat1 acts as an intrinsic regulator in osteoblasts to promote osteogenesis. Interestingly, Malat1 does not directly affect osteoclastogenesis but inhibits osteoclastogenesis in a non-autonomous manner in vivo via integrating crosstalk between multiple cell types, including osteoblasts, osteoclasts and chondrocytes. Our findings substantiate the existence of a novel remodeling network in which Malat1 serves as a central regulator by binding to β-catenin and functioning through the β-catenin-OPG/Jagged1 pathway in osteoblasts and chondrocytes. In pathological conditions, Malat1 significantly promotes bone regeneration in fracture healing. Bone homeostasis and regeneration are crucial to well-being. Our discoveries establish a previous unrecognized paradigm model of Malat1 function in the skeletal system, providing novel mechanistic insights into how a lncRNA integrates cellular crosstalk and molecular networks to fine tune tissue homeostasis, remodeling and repair.

Keywords: Malat1; bone; fracture; homeostasis; lncRNA; long non-coding RNA; remodeling.


Conflict of interest statement

Competing Interests statement The authors have no conflict of interests.

Figures

Fig. 1
Fig. 1. Malat1 deficiency disrupts bone remodeling and results in osteoporosis through reduced osteoblastic bone formation and increased osteoclastic bone resorption.
(a) μCT images and (b) bone morphometric analysis of trabecular bone of the distal femurs isolated from the 12-week-old-male (n=11, upper panel) and female (n=9, lower panel) WT and Malat1−/− littermate mice. BV/TV, bone volume per tissue volume; BMD, bone mineral density; Conn-Dens., connectivity density; Tb.N, trabecular number; Tb.Th, trabecular thickness; Tb.Sp, trabecular separation. (c) TRAP staining and (d) histomorphometric analysis of histological sections obtained from of 12-week-old male WT and Malat1−/− littermate mice (n = 8/group). Oc.S/BS, osteoclast surface per bone surface; N.Oc/B.Pm, number of osteoclasts per bone perimeter. (e) Images of calcein double labelling of the tibia of 12-week-old male WT and Malat1−/− littermate mice. (f) Dynamic histomorphometric analysis of mineral apposition rate (MAR) and bone formation rate per bone surface (BFR/BS) after calcein double labeling of the tibiae of WT and Malat1−/− littermate male mice (n = 8/group). (g) Representative images of Toluidine blue staining (top) and Masson-Goldner staining (bottom) of femur from 12-week-old-male WT and Malat1−/− littermate mice. For Toluidine blue staining, the bones show green and osteoblasts are indicated by arrow heads. For Masson-Goldner staining, osteoid matrix appears dark orange on the surface of the bone beneath the osteoblasts (indicated by dash lines), osteoblasts are stained orange lining on the bone surface, and bone marrow cells appear red in the photograph. (h) Bone morphometric analysis of osteoblast surface per bone surface (Ob.S/BS), osteoblast number per bone perimeter (N.Ob/B.Pm) and osteoid matrix volume per bone volume (OV/BV) of the femur of WT and Malat1−/− littermate male mice (n = 10/group). (i) serum TRAP and P1NP levels of 12-week-old male mice. b, d, f, h, i *p < 0.05; **p < 0.01; ns, not statistically significant by Student’s t test. Data are mean ± SD. Scale bars: a 400 μm; c 200 μm; e, g 50 μm.
Fig. 2
Fig. 2. Specific deletion of Malat1 in osteoblasts leads to reduced bone mass and defects in bone formation.
(a) μCT images and (b) bone morphometric analysis of trabecular bone of the distal femurs isolated from the 12-week-old male Malat1f/f and Malat1ΔOcn littermate mice (n = 14/group). (c) Images of calcein double labelling (top) of the tibia of 12-week-old male Malat1f/f and Malat1ΔOcn littermate mice. Dynamic histomorphometric analysis (bottom) of mineral apposition rate (MAR) and bone formation rate per bone surface (BFR/BS) after calcein double labeling of the tibiae of Malat1f/f and Malat1ΔOcn littermate male mice (n = 7/group). (d) Representative images of Toluidine blue staining (top) of femur from 12-week-old male Malat1f/f and Malat1ΔOcn littermate mice. For Toluidine blue staining, the bones show green and osteoblasts are indicated by arrow heads. Bone morphometric analysis (bottom) of osteoblast surface per bone surface (Ob.S/BS) and osteoblast number per bone perimeter (N.Ob/B.Pm) of the femur of 12-week-old male Malat1f/f and Malat1ΔOcn littermate mice. (e) serum P1NP levels of 12-week-old male mice. b, c, d, e *p < 0.05; **p < 0.01 by Student’s t test; ns, not statistically significant. Data are mean ± SD. Scale bars: a 200 μm; c, d 50 μm.
Fig. 3
Fig. 3. Malat1 binds to β-catenin to positively regulate canonical Wnt/ β-catenin signaling pathway.
(a) ChIRP analysis of the specificity and efficiency of the Malat1 probe. Mouse Malat1 or the control GFP probes were used to pull down endogenous Malat1 from MC3T3-E1 cells, followed by qPCR quantification of Malat1. (b) ChIRP analysis of the Malat1 binding to β-catenin. Mouse Malat1-specific probes were used to pull down the endogenous Malat1 in the MC3T3-E1 cells, followed by immunoblotting with anti-β-catenin antibody. (c) RIP assay of β-catenin binding to Malat1. Endogenous β-catenin was immunoprecipitated from MC3T3-E1 cells, and the β-catenin-bound Malat1 was quantitated by qPCR. Rabbit IgG was used as a negative control IP antibody. (d) Immunoblot analysis of the nuclear and cytoplasmic localization of β-catenin in calvarial osteoblasts that were serum starved for 16h, followed by treatment with 50% Wnt3a- or the control L- conditional medium for 1h. TBP1 and GAPDH were measured as loading controls for nuclear and cytoplasmic fractions, respectively. Experiments in a-d were replicated three times. (e) Luciferase reporter assay of the Wnt/β-catenin signaling activity measured from the indicated calvarial osteoblasts transfected with the M50 Super 8x TOPFlash reporter plasmid and pRL-Tk control plasmid for 48 h, followed by treatment with or without 20% Wnt3a conditional medium for 16h (n = 5). (f) qPCR analysis of mRNA expression of β-catenin target genes in calvarial osteoblasts in the osteogenic medium (α-MEM with 10% FBS supplemented with 10mM β-glycerophosphate and 100 ug/ml ascorbic acid) for seven days (n=3). Data are mean ± SD. c,e ***p < 0.001; ****p < 0.0001 by two-way ANOVA with Bonferroni’s multiple comparisons test. f, **p < 0.01; ***p < 0.001 by Student’s t test.
Fig. 4
Fig. 4. Malat1 is not an intrinsic regulator of osteoclast differentiation.
(a) Osteoclast differentiation using BMMs obtained from WT and Malat1−/− mice stimulated with RANKL for 3 days. TRAP staining (left panel) was performed and the area of TRAP-positive MNCs (≥3 nuclei/cell) per well relative to the WT control was calculated (right panel). (n =4/group). (b) Von Kossa staining (left) and the resorption area (%) (right) of the osteoclast cultures of WT and Malat1−/− BMMs stimulated with RANKL for 4 days. (n = 3/group). Mineralized area: black; resorption area: white. (c) qPCR analysis of mRNA expression of the indicated genes during osteoclastogenesis with or without RANKL for 2 days and 4 days. (d) Immunoblot analysis of Nfatc1, Blimp1 and c-Fos expression during osteoclastogenesis with or without RANKL for 2 days and 4 days. β-actin was used as a loading control. (e-g) Malat1 deletion efficiency (e) and μCT images (f) and bone morphometric analysis (g) of trabecular bone of the distal femurs isolated from the indicated 12-week-old male Control and Malat1ΔM/ ΔM littermate mice (n = 6/group). Data are mean ± SD. a,b,f ns, not statistically significant by Student’s t test; c, by two-way ANOVA with Bonferroni’s multiple comparisons test. Scale bars: a,b 100 μm; e 400 μm
Fig. 5
Fig. 5. Malat1 promotes OPG expression in osteoblasts to suppress osteoclastogenesis.
(a) TRAP staining (left) and histomorphometric analysis (right) of histological sections obtained from the metaphysis region of distal femurs from the 12-week-old male Malat1f/f and Malat1ΔOcn littermate mice. n = 5–6/group. Oc.S/BS, osteoclast surface per bone surface; N.Oc/B.Pm, number of osteoclasts per bone perimeter. (b) serum TRAP levels of 12-week-old male mice. (c) A schematic diagram (left) of the co-culture system with primary osteoblasts and bone marrow cells in trans-wells. TRAP staining (middle) was performed and the number of TRAP-positive MNCs (≥3 nuclei/cell) per well was calculated (right panel). (n =5 replicates from two experiments). (d-e) qPCR analysis of mRNA expression of Tnfrsf11b (encoding OPG) (d) and Tnfsf11 (encoding RANKL) (e) in calvarial osteoblasts (n =5/group). (f) The expression ratio of Rankl/Opg in calvarial osteoblasts. (g) ELISA analysis of OPG levels in the serum from the 12-week-old male WT and Malat1−/− mice (n = 11–12/group). (h) Immunoblot analysis of OPG expression in the bone marrow supernatant from the 12-week-old male WT and Malat1−/− mice. Bottom: Ponceau Staining of the gels showing an equivalent amount of total proteins loaded between samples. (i) Osteoclast differentiation of WT and Malat1−/− bone marrows stimulated with RANKL (40 ng/ml) and M-CSF C.M. (1:20) with or without OPG (2.5ng/ml) for five days. TRAP staining (left panel) was performed and the number of TRAP-positive MNCs (≥3 nuclei/cell) per well was calculated (right panel). TRAP-positive cells appear red in the photographs. n = 5 replicates. (j) Osteoclast differentiation of the cocultures of the indicated calvarial osteoblasts and WT bone marrow cells treated with 10 nM of VitD3 and 1 μM of prostaglandinE2 for 6 days in the presence or absence of OPG (1ng/ml). TRAP staining (left) was performed and the number of TRAP-positive MNCs (≥3 nuclei/cell) per well was calculated (right panel). n = 3 replicates. Data are mean ± SD. a-g, *p < 0.05; **p < 0.01 by Student’s t test; i,j *p < 0.05, **p < 0.01, ***p < 0.001 by two-way ANOVA with Bonferroni’s multiple comparisons test . ns, not statistically significant. Scale bars: a 200 μm; c,i,j 100 μm
Fig. 6
Fig. 6. Malat1 enhances OPG and Jagged1 expression in chondrocytes.
(a) UMAP plot analysis of the bone and bone marrow datasets of scRNAseq based on GSE128423. (b) UMAP plot of the expression of Tnfrsf11b (encoding OPG) in bone and bone marrow cells. (c) Violin plots of the expression of Tnfrsf11b, Acan, Col2a1 and Sox9. (d) Dot plot of the expression of Tnfrsf11b, Acan, Col2a1 and Sox9 across the listed scRNAseq clusters. Cell clusters are listed on y-axis. Features are listed along the x-axis. Dot size reflects the percentage of cells in a cluster expressing each gene. Dot color reflects the scaled average gene expression level as indicated by the legend. (e, f, h) qPCR analysis of the indicated genes in primary chondrocytes. n = 4/group. (g, i) Immunoblot analysis of OPG and Jagged1 in the chondrocytes isolated from the WT and Malat1−/− mice. Data are mean ± SD. e,f,h, *p < 0.05; **p < 0.01 by Student’s t test; ns, not statistically significant.
Fig. 7:
Fig. 7:. A model illustrating a Malat1-centered molecular and cellular network in bone remodeling.
Malat1 binds to β-catenin, regulating its transcriptional activity on downstream target genes, such as Tnfrsf11b (encoding OPG) and Jag1 (encoding Jagged1), both of which are osteoclastogenic inhibitors. Malat1 orchestrates β-catenin to promote intrinsic osteoblastic bone formation while suppressing osteoclastogenesis in a non-autonomous manner through β-catenin target genes OPG and Jagged1, expressed by osteoblasts and chondrocytes.
Fig. 8:
Fig. 8:. Malat1 enhances bone regeneration in fracture healing.
(a) Representative photograph of femur fracture callus. (b, d) representative μCT images of femurs isolated from the indicated mice at day 21 post-fracture. (c, e) μCT analysis of BV/TV in callus area of femurs of the indicated mice at day 21 post-fracture. (f) HE staining and histological analysis of the callus areas. n=5/group. Data are mean ± SD. c, e, f *p < 0.05; **p < 0.01 by Student’s t test. Scale bars, b, d 1 mm; f 400 μm.

References

    1. Mattick J.S. et al. Long non-coding RNAs: definitions, functions, challenges and recommendations. Nat Rev Mol Cell Biol 24, 430–447 (2023). - PMC - PubMed
    1. Batista P.J. & Chang H.Y. Long noncoding RNAs: cellular address codes in development and disease. Cell 152, 1298–307 (2013). - PMC - PubMed
    1. Quinn J.J. & Chang H.Y. Unique features of long non-coding RNA biogenesis and function. Nat Rev Genet 17, 47–62 (2016). - PubMed
    1. Smith M.A. & Mattick J.S. Structural and Functional Annotation of Long Noncoding RNAs. Methods Mol Biol 1526, 65–85 (2017). - PubMed
    1. Rinn J.L. & Chang H.Y. Genome regulation by long noncoding RNAs. Annu Rev Biochem 81, 145–66 (2012). - PMC - PubMed

Publication types