. 2022 Oct 21:3:948080.
doi: 10.3389/fnrgo.2022.948080. eCollection 2022.

P300 as a neural indicator for setting levels of goal scores in educational gamification applications from the perspective of intrinsic motivation: An ERP study

Affiliations

P300 as a neural indicator for setting levels of goal scores in educational gamification applications from the perspective of intrinsic motivation: An ERP study

Hiroki Watanabe et al. Front Neuroergon. .

Abstract

The challenge level of goal achievement affects intrinsic motivation. Thus, the goal score learners are required to achieve is an important element in gamified educational applications to foster users' intrinsic motivation. However, determining optimal goal scores that enhance the intrinsic motivation of each learner is not easy because individual competence and preferences for the challenge level (e.g., preference for difficult-to-achieve challenges) vary. One approach is to determine the goal score using physiological measurements to estimate when an individual's intrinsic motivation is reinforced. Measurement of event-related potentials (ERPs) is considered useful for this purpose. ERPs time-locked to feedback onset, such as feedback-related negativity and P300, reflect intrinsic motivation. However, it remains unclear whether these ERPs can serve as indicators of optimal goal scores for gamified educational applications in terms of intrinsic motivation. The present study aimed to examine whether ERP measures vary with the challenge levels of the goal score determined by participants' competence (too-easy, moderate and too-hard levels) and/or with their preference for these levels when using a gamified mental arithmetic application. Thirty-three participants solved 64 addition problems in one session in this application and received auditory feedback immediately after each answer entry. Scores were then calculated based on their task performance. Before each session, participants were informed of the goal score and instructed to exceed it as much as possible. Sessions were repeated six times at easy, moderate, and hard levels of goal scores, with two sessions per level. Goal score preferences were quantified based on subjective ratings of the motivation to achieve each level of goal score using a 7-point Likert scale. The mean amplitudes of ERPs were obtained for each participant. Results showed that P300 was significantly related to subjective ratings but not to levels of goal scores, indicating that P300 could be an indicator of participant preference for goal score levels. This study suggests that measurement of P300 may serve as a neural indicator providing an optimal goal score for individual learners that maximizes their intrinsic motivation in gamified learning applications.

Keywords: P300; achievement goal; electroencephalogram (EEG); event-related potentials (ERPs); feedback-related negativity (FRN); gamification; intrinsic motivation; self-determination theory (SDT).


Conflict of interest statement

The authors declare that the research was conducted in the absence of any commercial or financial relationships that could be construed as a potential conflict of interest.

Figures

Figure 1
Figure 1
The appearance of a gamified mental arithmetic graphical user interface application. The participant enters answers to addition sums using the number pairs in the column and row headers in sequence. After entering the answer, auditory feedback on the correctness of the answer is immediately provided. The goal score and the current score earned are shown in the upper left area (A). Participants were instructed to confirm the goal score before starting the task and to try to exceed the goal score as much as possible. The number of consecutive correct answers is visualized by a bar (B). Below the bar, the current number of consecutive correct answers and the points earned for each correct answer are displayed (C). The points earned vary depending on the number of consecutively correct answers. The remaining time for each question is displayed as a progress bar (D). If an answer is not entered within the time limit, negative feedback is returned, and the participants are automatically moved to the next question. The dashed squares are shown for illustration purposes only.
Figure 2
Figure 2
Data collection procedure. Participants performed two practice sessions, one to familiarize themselves with the task and the other to determine the baseline score. In the main sessions, they performed a mental arithmetic task with three levels of goal scores: easy (baseline score × 0.3), moderate (baseline score × 1.3), and hard (baseline score × 5.0). Each level of goal score was administered twice in random order. After completing the task, the participants subjectively rated how motivated they were to achieve the goal score, using a 7-point Likert scale.
Figure 3
Figure 3
Results of subjective ratings for each level of goal score. Filled dots and error bars indicate median and interquartile range, respectively. The transparent dots are the values for each participant. *p < Bonferroni-corrected α.
Figure 4
Figure 4
Percentage of participants who achieved the goal score for each level of goal score and attempt. Almost all participants achieved the easy goal and did not achieve the hard one. The percentage of participants who achieved the moderate goal was approximately 50% in both attempts.
Figure 5
Figure 5
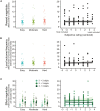
The estimated coefficients of Goal (left) and the predicted values on Rating (right) in the (generalized) linear mixed-effects models [(G)LME] analyses for Scores (A) and Negative feedback frequency (B). In Goal results, the filled dots and error bars represent the estimated coefficients and 95% confidence intervals. The transparent dots are data points for each participant. In Rating results, the black line represents the predicted values from the (G)LME, and the gray area represents the 95% confidence interval. Black dots are data points for each participant (number of participants × number of levels of goal scores).
Figure 6
Figure 6
The estimated coefficients of Goal (left) and the predicted values on Rating (right) in the (generalized) linear mixed-effects models [(G)LME] analyses for Reward magnitude (A), Local outcome frequency (B), and Effort magnitude (C). In Goal results, the filled dots and error bars represent the estimated coefficients and 95% confidence intervals. The transparent dots are data points for each participant. In Rating results, the black line represents the predicted values from the (G)LME, and the gray area represents the 95% confidence interval. Black dots are data points for each participant (number of participants × number of levels of goal scores).
Figure 7
Figure 7
The grand average event-related potentials (ERPs) for correct and incorrect trials time-locked to the feedback onset and their difference waveforms for each channel and level of goal score. The blue and red area represents the standard error for correct and incorrect trials, and the gray rectangles represent the range of the time window for calculating the mean amplitude of each ERP. For each level of goal score, participants with fewer than 12 incorrect trials were excluded from the calculation of ERPs for incorrect trials at that level of goal score in terms of signal-to-noise ratio.
Figure 8
Figure 8
The estimated coefficients of Goal (upper) and the predicted values on Rating (lower) for each incorrect and correct trial in the linear mixed-effects models (LME) analyses for the mean amplitudes of N1 (A), feedback-related negativity (FRN) (B), and P300 (C). In Goal results, the filled dots and error bars represent the estimated coefficients and 95% confidence intervals. The transparent dots are data points for each participant. In Rating results, the colored line represents the predicted values from the LME, and the colored area represents the 95% confidence interval. Filled dots are data points for each participant (number of participants × number of levels of goal scores for each feedback type). *p < 0.05.

References

    1. Bellebaum C., Polezzi D., Daum I. (2010). It is less than you expected: the feedback-related negativity reflects violations of reward magnitude expectations. Neuropsychologia 48, 3343–3350. 10.1016/j.neuropsychologia.2010.07.023 - DOI - PubMed
    1. Deci E. L., Ryan R. M. (1985). Intrinsic Motivation and Self-Determination in Human Behavior. New York, NY: Plenum Press.
    1. Deterding S., Dixon D., Khaled R., Nacke L. (2011). “From game design elements to gamefulness: Defining “gamification,” in Proceedings of the 15th International Academic MindTrek Conference: Envisioning Future Media Environments (Tampere: ), 9–15.
    1. Duncan-Johnson C. C., Donchin E. (1977). On quantifying surprise: the variation of event-related potentials with subjective probability. Psychophysiology 14, 456–467. 10.1111/j.1469-8986.1977.tb01312.x - DOI - PubMed
    1. Fang H., He B., Fu H., Zhang H., Mo Z., Meng L. (2018). A surprising source of self-motivation: prior competence frustration strengthens one's motivation to win in another competence-supportive activity. Front. Hum. Neurosci. 12, 314. 10.3389/fnhum.2018.00314 - DOI - PMC - PubMed