. 2024 Apr 16;149(16):1285-1297.
doi: 10.1161/CIRCULATIONAHA.123.063972. Epub 2024 Jan 18.

CRISPR Activation Reverses Haploinsufficiency and Functional Deficits Caused by TTN Truncation Variants

Affiliations

CRISPR Activation Reverses Haploinsufficiency and Functional Deficits Caused by TTN Truncation Variants

Shahnaz Ghahremani et al. Circulation. .

Abstract

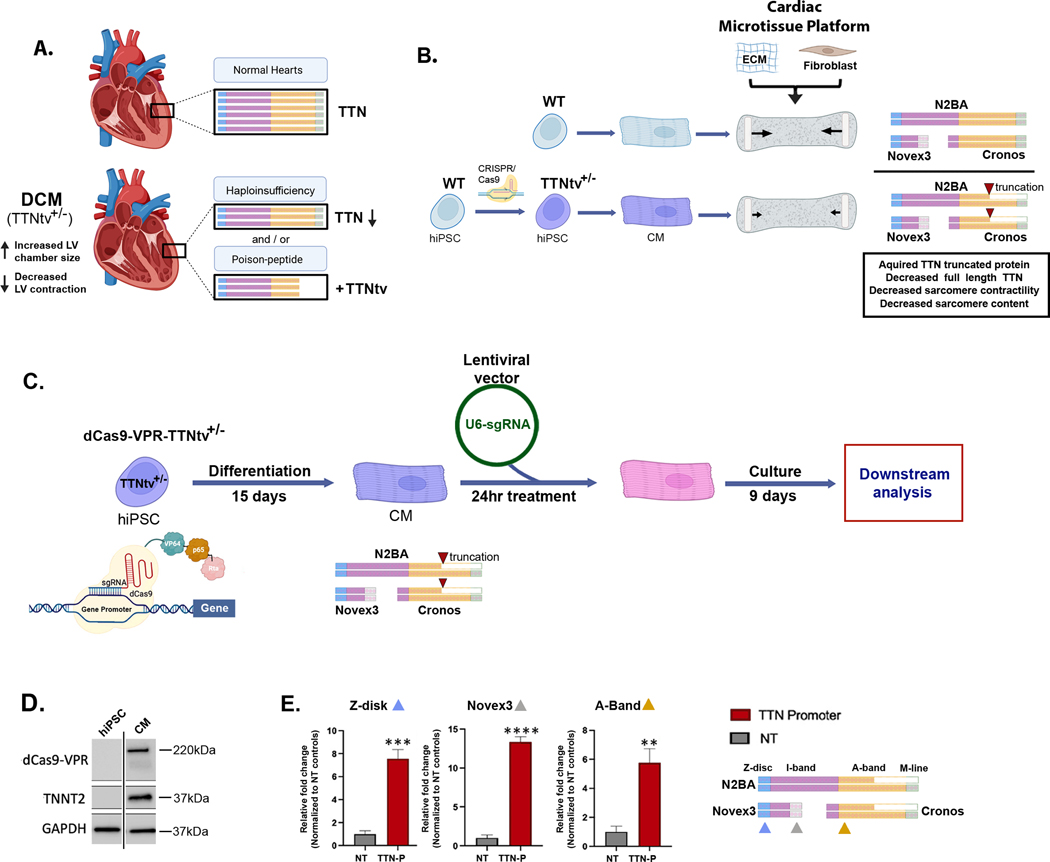
Background: TTN truncation variants (TTNtvs) are the most common genetic lesion identified in individuals with dilated cardiomyopathy, a disease with high morbidity and mortality rates. TTNtvs reduce normal TTN (titin) protein levels, produce truncated proteins, and impair sarcomere content and function. Therapeutics targeting TTNtvs have been elusive because of the immense size of TTN, the rarity of specific TTNtvs, and incomplete knowledge of TTNtv pathogenicity.

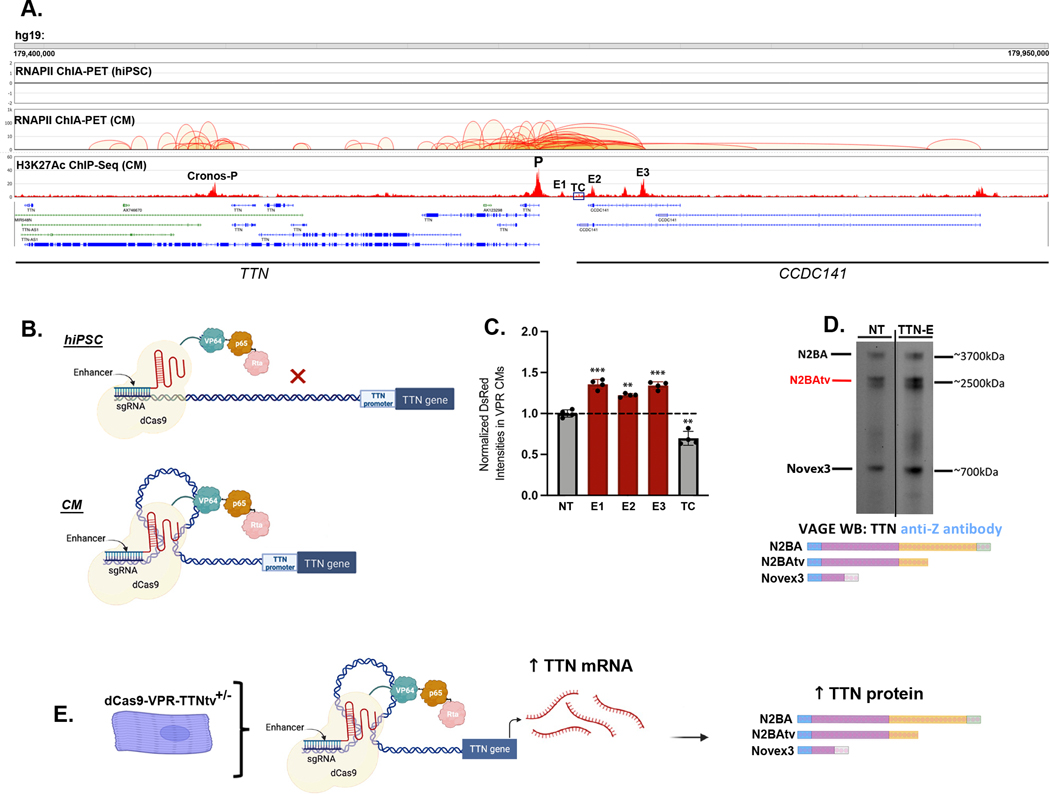
Methods: We adapted CRISPR activation using dCas9-VPR to functionally interrogate TTNtv pathogenicity and develop a therapeutic in human cardiomyocytes and 3-dimensional cardiac microtissues engineered from induced pluripotent stem cell models harboring a dilated cardiomyopathy-associated TTNtv. We performed guide RNA screening with custom TTN reporter assays, agarose gel electrophoresis to quantify TTN protein levels and isoforms, and RNA sequencing to identify molecular consequences of TTN activation. Cardiomyocyte epigenetic assays were also used to nominate DNA regulatory elements to enable cardiomyocyte-specific TTN activation.

Results: CRISPR activation of TTN using single guide RNAs targeting either the TTN promoter or regulatory elements in spatial proximity to the TTN promoter through 3-dimensional chromatin interactions rescued TTN protein deficits disturbed by TTNtvs. Increasing TTN protein levels normalized sarcomere content and contractile function despite increasing truncated TTN protein. In addition to TTN transcripts, CRISPR activation also increased levels of myofibril assembly-related and sarcomere-related transcripts.

Conclusions: TTN CRISPR activation rescued TTNtv-related functional deficits despite increasing truncated TTN levels, which provides evidence to support haploinsufficiency as a relevant genetic mechanism underlying heterozygous TTNtvs. CRISPR activation could be developed as a therapeutic to treat a large proportion of TTNtvs.

Keywords: cardiomyopathy, dilated; clustered regularly interspaced short palindromic repeats; connectin; myocytes, cardiac.


Conflict of interest statement

Disclosures Dr Hinson receives sponsored research support unrelated to this work from Kate Therapeutics and Tevard Biosciences, serves on the scientific advisory board of Kate Therapeutics, and has previously received unrelated consulting fees from Alnylam and BioMarin. The other authors declare no conflicts of interest regarding this work.

Figures

Figure 1.
Figure 1.. Developing CRISPR transcriptional activation (CRISPRa) to reverse TTNtv-related pathophysiology and molecular consequences.
(A) TTNtvs cause dilated cardiomyopathy (DCM), a disorder defined by changes in left ventricular (LV) contraction and size, in association with reduced TTN protein quantities and lengths suggesting haploinsufficiency and/or poison peptide mechanisms, respectively. (B) Human iPS-differentiated cardiomyocytes (CMs) CRISPR-engineered to contain an isogenic heterozygous (+/−) truncation variant at proline residue 22582 exhibit diminished contractile function (arrow length proportion to contractile function) in microtissues and changes in TTN protein levels and lengths recapitulating phenotypic consequences observed in DCM human hearts. Abundant TTN protein isoforms expressed in CMs are N2BA, Novex3 and Cronos, which variably express exons encoding Z-disk, I-band, A-band and M-line residues. (C) General overview of CRISPRa in TTNtv+/− CMs that utilizes a nuclease dead Cas9 fused to VP64, p65 and Rta (dCas9-VPR) targeted to gene promoters by single guide RNAs to enable transcriptional activation. These dCas9-VPR-TTNtv+/− CMs have dCas9-VPR knocked into the TNNT2 locus to provide a method for CM-specific dCas9-VPR expression and following transduction with lentiviral vectors encoding single gRNAs targeted to gene promoters, can be utilized to study the functional consequences of CRISPRa in a DCM context. (D) Immunoblot from iPSC and iPS-CM lysates probed for antibodies to dCas9-VPR, TNNT2, and GAPDH demonstrating CM-specific expression of cleaved dCas9-VPR and cleaved TNNT2 with GAPDH as loading controls. (E) Quantitative PCR analysis of TTN mRNA levels using domain-specific primers (see arrow heads for Z-disk (blue), Novex3 (gray) and A-band (yellow) sites) after lentiviral transduction of a gRNA targeting the TTN N2BA promoter (TTN-P) or non-targeting (NT) controls in dCas9-VPR-TTNtv+/− CMs demonstrates transcriptional activation of splice isoforms encompassing Z-disk, Novex3 and A-band TTN transcripts. Data are mean ± SD; significance for comparison was assessed by Students T-test with Welch correction and defined by P≤0.01 (**), P≤0.001 (***), and P≤0.001 (****).
Figure 2:
Figure 2:. TTN promoter gRNA screening in TTN reporter CMs to enable TTN transcriptional activation.
(A) TTN promoter single gRNA nomenclature reflects the distance between the TTN TSS to the middle of the gRNA protospacer. (B) ATAC-seq peak analysis of TTN N2BA promoter from four CM samples. N2BA transcript is NM_001256850) and coordinates are shown above the peaks. (C) Employing a TTN-tdTomato fluorescent reporter, single gRNAs targeting the TTN promoter normalized to non-targeting (NT) controls were screened as an indicator of TTN protein levels following TTN transcriptional activation. (D) Studying TTN-tdTomato reporter activity at 9 and 12 days post lentiviral transduction with TTN-124 gRNA normalized to NT reveals time-dependent and progressive enhancement of TTN protein levels up to ~2.5x. (E) VAGE immunoblot results obtained from CM lysates probed for TTN protein isoforms using an Anti-Z TTN antibody demonstrates that TTN promoter activation increases the protein levels of N2BA, truncated N2BA (N2BAtv) and Novex3 TTN isoforms. Prior to VAGE, replicates were normalized to actinin levels. (F) Quantification of VAGE immunoblot results from (E) using TTN-P normalized to NT gRNA. (G) VAGE immunoblot results obtained from CM lysates probed for TTN protein isoforms using an Anti-M TTN antibody demonstrates that TTN promoter activation increases the protein levels of N2BA, but not Cronos that utilizes a distinct promoter. Prior to VAGE, replicates were normalized to actinin levels. (H) Quantification of VAGE immunoblot results from (G) using TTN-P normalized to NT gRNA. (I) Model of CRISPR transcriptional activation targeting the TTN promoter to increase TTN mRNA transcripts and TTN protein isoform levels including N2BA, N2BAtv and Novex3. Data are mean±SD; significance for pairwise comparison was assessed by Students T-test with Welch correction and defined by P≤0.01 (**), and P≤0.001 (****). Multiple comparisons in Fig. 2C were assessed by Brown-Forsythe one-way ANOVA test with consecutive Dunnett’s correction, defined by P<0.05 (*), P≤0.01 (**), P≤0.001 (***), and P≤0.001 (****). Two-way ANOVA followed by Fishers Least Significant Difference (LSD) test was performed for Fig. 2D and defined by P<0.05 (*), P≤0.01 (**), P≤0.001 (***), and P≤0.001 (****)
Figure 3:
Figure 3:. Transcriptomic consequences of TTN transcriptional activation.
(A) Principal component analysis plot of RNA sequencing data obtained from biological CM triplicates treated with TTN-P or NT gRNA as controls. (B) Pie chart summarizes differential gene expression (DGE) analysis following TTN transcriptional activation. DGE parameters included a false discovery rate-adjusted P value (Padj) cutoff <0.05, which identified a total of 8219 genes. Of these, 7.01% were upregulated (Log2 fold change (FC) ≥1) and 16.52% were downregulated (Log2 FC≤−1), while most were unchanged. (C-E) Volcano plot and Gene Ontology (GO) term enrichment analysis of the downregulated (blue; Log2FC ≤ −1, Padj<0.05; Table S6) and the upregulated (red; Log2FC ≥ 1, Padj<0.05,; Table S7) gene transcripts upon TTN transcriptional activation using TTN-P relative to NT gRNA controls. (F) Fold change heat maps of all gene transcripts within GO terms related to sarcomere structure and function reveals generalized upregulation (Table S8 for gene lists) including factors involved in cardiac myofibril assembly (GO: 0055003), cardiac muscle contraction (GO: 0060048), sarcomere organization (GO: 0045214), M-line (GO: 0031430), I-band (GO: 0031674), Z-disk (GO: 0030018), and A-band (GO: 0031672).
Figure 4:
Figure 4:. TTN transcriptional activation through targeting TTN regulatory elements.
(A) TTN enhancer elements (E1-E3) are localized upstream of the TTN transcriptional start site (TSS) in CMs, and physically interact with the TTN TSS as demonstrated by DNA-DNA looping revealed by RNAPII ChIA-PET in CMs, but not human iPSCs (note that no looping is evident to the TTN TSS in iPSCs). E1-E3 are also characterized by H3K27ac peaks using ChIP-seq in CMs. Targeting control (TC) was chosen as a control as it demonstrated neither DNA-DNA looping nor H3K27ac peaks in CMs. (B) Model depicting how CM-specific DNA-DNA contacts may enable dCas9-VPR to physically access the TTN TSS and provide TTN transcriptional activation exclusively in CMs, but not iPSCs and likely other cell types. (C) Employing a TTN-tdTomato fluorescent reporter, single gRNAs targeting E1-E3 elements and normalized to non-targeting (NT) controls were screened as an indicator of TTN protein levels following TTN transcriptional activation. (D) VAGE immunoblot of TTN protein isoforms probed with Anti-Z TTN antibodies demonstrates an increase in protein levels of N2BA, N2BAtv and Novex3 TTN isoforms after TTN enhancer element activation. (E) Model of CRISPR transcriptional activation targeting TTN regulatory elements to increase TTN mRNA transcripts and TTN protein isoform levels including N2BA, N2BAtv and Novex3. Data are mean±SD; significance for multiple comparisons were assessed by Brown-Forsythe one-way ANOVA test with consecutive Dunnett’s correction, defined by P≤0.01 (**) and P≤0.001 (***).
Figure 5:
Figure 5:. TTN transcriptional activation restores TTNtv-induced sarcomere content and contractility deficits.
(A) Representative confocal images of CMs after TTN transcriptional activation using a TTN-P or NT gRNA as control. The sarcomere was stained using Anti-Z TTN antibody with DAPI co-stain for DNA. Note that CMs were patterned with fibronectin PDMS stamps to control cell shape and promote maturation. (B) Quantification of sarcomere content per cell after TTN transcriptional activation. (C) Quantification of CM surface area after TTN transcriptional activation. (D) General overview of a 3-dimensional cardiac microtissue (CMT) assay to enable contractility (twitch force) measurements within a biomimetic context. CMTs are composed of CMs, human cardiac fibroblasts and an extracellular matrix (ECM) slurry, and twitch force is measured using cantilever displacement analysis at 1 Hz pacing. White arrows denote direction of cantilever displacement with twitch. (E) TTN transcriptional activation using TTN-P increased CMT twitch force relative to NT gRNA as a control. (F) Model to summarize that CRISPRa using dCas9-VPR targeted to TTN regulatory elements or promoters using single gRNAs restores changes in contractile function, sarcomere content and protein defects. As increasing TTN protein levels restores TTNtv-related dysfunction despite increasing truncated TTN protein levels, haploinsufficiency may be the predominant genetic mechanism for TTNtvs. Data are mean±SD; significance for pairwise comparison was assessed by Students T-test with Welch correction and defined by P<0.05 (*) and P≤0.01 (**).

References

    1. Hershberger RE, Hedges DJ, Morales A. Dilated cardiomyopathy: the complexity of a diverse genetic architecture. Nat Rev Cardiol. 2013;10:531–547. doi: 10.1038/nrcardio.2013.105 - DOI - PubMed
    1. Hershberger RE, Jordan E. Dilated Cardiomyopathy Overview. In: Adam MP, Everman DB, Mirzaa GM, Pagon RA, Wallace SE, Bean LJH, Gripp KW, Amemiya A, eds. GeneReviews((R)). Seattle (WA); 1993. - PubMed
    1. Japp AG, Gulati A, Cook SA, Cowie MR, Prasad SK. The Diagnosis and Evaluation of Dilated Cardiomyopathy. J Am Coll Cardiol. 2016;67:2996–3010. doi: 10.1016/j.jacc.2016.03.590 - DOI - PubMed
    1. Roberts AM, Ware JS, Herman DS, Schafer S, Baksi J, Bick AG, Buchan RJ, Walsh R, John S, Wilkinson S, et al. Integrated allelic, transcriptional, and phenomic dissection of the cardiac effects of titin truncations in health and disease. Sci Transl Med. 2015;7:270ra276. doi: 10.1126/scitranslmed.3010134 - DOI - PMC - PubMed
    1. Herman DS, Lam L, Taylor MR, Wang L, Teekakirikul P, Christodoulou D, Conner L, DePalma SR, McDonough B, Sparks E, et al. Truncations of titin causing dilated cardiomyopathy. N Engl J Med. 2012;366:619–628. doi: 10.1056/NEJMoa1110186 - DOI - PMC - PubMed

MeSH terms

LinkOut - more resources