

Blood culture quality and turnaround time of clinical microbiology laboratories in Chinese Teaching Hospitals: A multicenter study
- PMID: 38235610
- PMCID: PMC10829685
- DOI: 10.1002/jcla.25008
Blood culture quality and turnaround time of clinical microbiology laboratories in Chinese Teaching Hospitals: A multicenter study
Abstract
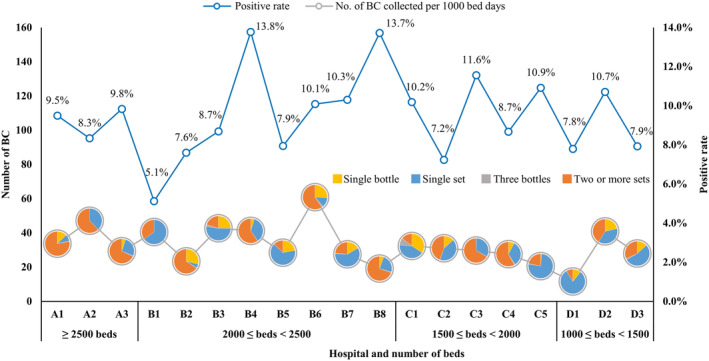
Purpose: Blood culture (BC) remains the gold standard for the diagnosis of bloodstream infections. Improving the quality of clinical BC samples, optimizing BC performance, and accelerating antimicrobial susceptibility test (AST) results are essential for the early detection of bloodstream infections and specific treatments.
Methods: We conducted a retrospective multicenter study using 450,845 BC specimens from clinical laboratories obtained from 19 teaching hospitals between 1 January 2021 and 31 December 2021. We evaluated key performance indicators (KPIs), turnaround times (TATs), and frequency distributions of processing in BC specimens. We also evaluated the AST results of clinically significant isolates for four different laboratory workflow styles.
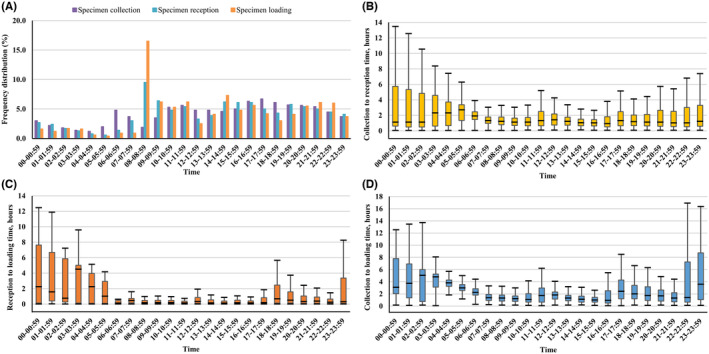
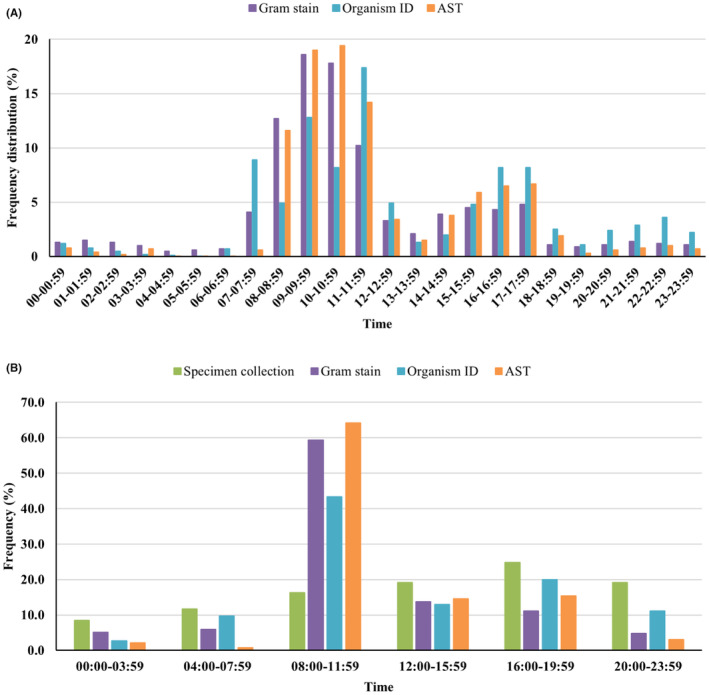
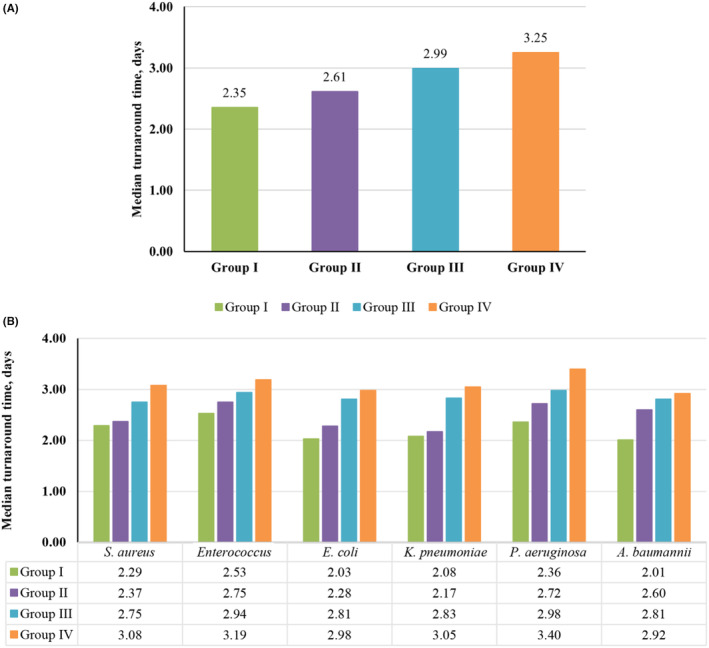
Results: Across the 10 common bacterial isolates (n = 16,865) and yeast isolates (n = 1011), the overall median (interquartile range) TATs of AST results were 2.67 (2.05-3.31) and 3.73 (2.98-4.64) days, respectively. The specimen collections mainly occurred between 06:00 and 24:00, and specimen reception and loadings mainly between 08:00 and 24:00. Based on the laboratory workflows of the BCs, 16 of the 19 hospitals were divided into four groups. Time to results (TTRs) from specimen collection to the AST reports were 2.35 (1.95-3.06), 2.61 (1.98-3.32), 2.99 (2.60-3.87), and 3.25 (2.80-3.98) days for groups I, II, III, and IV, respectively.
Conclusion: This study shows the related BC KPIs and workflows in different Chinese hospitals, suggesting that laboratory workflow optimization can play important roles in shortening time to AST reports and initiation of appropriate timely treatment.
Keywords: blood culture; clinical microbiology laboratory; key performance indicators; laboratory workflow; turnaround time.
© 2024 The Authors. Journal of Clinical Laboratory Analysis published by Wiley Periodicals LLC.
Conflict of interest statement
The authors have disclosed no conflicts of interest.
Figures
Similar articles
-
Blood Culture Turnaround Time in U.S. Acute Care Hospitals and Implications for Laboratory Process Optimization.J Clin Microbiol. 2018 Nov 27;56(12):e00500-18. doi: 10.1128/JCM.00500-18. Print 2018 Dec. J Clin Microbiol. 2018. PMID: 30135230 Free PMC article.
-
Comparison of novel rapid diagnostic of blood culture identification and antimicrobial susceptibility testing by Accelerate Pheno system and BioFire FilmArray Blood Culture Identification and BioFire FilmArray Blood Culture Identification 2 panels.BMC Microbiol. 2021 Dec 18;21(1):350. doi: 10.1186/s12866-021-02403-y. BMC Microbiol. 2021. PMID: 34922463 Free PMC article.
-
Compliance of clinical microbiology laboratories with recommendations for the diagnosis of bloodstream infections: Data from a nationwide survey in Italy.Microbiologyopen. 2020 Apr;9(4):e1002. doi: 10.1002/mbo3.1002. Epub 2020 Feb 3. Microbiologyopen. 2020. PMID: 32012494 Free PMC article.
-
Driving Laboratory Standardization of Bacterial Culture and Antimicrobial Susceptibility Testing in Veterinary Clinical Microbiology in Europe and Beyond.J Clin Microbiol. 2021 May 19;59(6):e02572-20. doi: 10.1128/JCM.02572-20. Print 2021 May 19. J Clin Microbiol. 2021. PMID: 33361339 Free PMC article. Review.
-
Rapid Phenotypic and Genotypic Antimicrobial Susceptibility Testing Approaches for Use in the Clinical Laboratory.Antibiotics (Basel). 2024 Aug 22;13(8):786. doi: 10.3390/antibiotics13080786. Antibiotics (Basel). 2024. PMID: 39200086 Free PMC article. Review.
Cited by
-
The impact of optimizing microbial diagnosis processes on clinical and healthcare economic outcomes in hospitalized patients with bloodstream infections.Eur J Clin Microbiol Infect Dis. 2024 Nov;43(11):2147-2157. doi: 10.1007/s10096-024-04928-2. Epub 2024 Sep 6. Eur J Clin Microbiol Infect Dis. 2024. PMID: 39240272
-
Plasma cell-free DNA Droplet Digital PCR provides rapid and efficient infectious microbiology diagnosis for febrile haematological patients.Front Cell Infect Microbiol. 2025 Feb 19;15:1522426. doi: 10.3389/fcimb.2025.1522426. eCollection 2025. Front Cell Infect Microbiol. 2025. PMID: 40046191 Free PMC article.
References
-
- Goto M, Al‐Hasan MN. Overall burden of bloodstream infection and nosocomial bloodstream infection in North America and Europe. Clin Microbiol Infect. 2013;19(6):501‐509. - PubMed
-
- Pien BC, Sundaram P, Raoof N, et al. The clinical and prognostic importance of positive blood cultures in adults. Am J Med. 2010;123(9):819‐828. - PubMed
-
- Barenfanger J, Graham DR, Kolluri L, et al. Decreased mortality associated with prompt gram staining of blood cultures. Am J Clin Pathol. 2008;130(6):870‐876. - PubMed
-
- Verstraete EH, Mahieu L, d'Haese J, et al. Blood culture indications in critically ill neonates: a multicenter prospective cohort study. Eur J Pediatr. 2018;177(10):1565‐1572. - PubMed
-
- Chappell‐Campbell L, Schwenk HT, Capdarest‐Arest N, Schroeder AR. Reporting and categorization of blood culture contaminants in infants and young children: a scoping review. J Pediatric Infect Dis Soc. 2020;9(2):110‐117. - PubMed
Publication types
MeSH terms
Grants and funding
LinkOut - more resources
Full Text Sources
Medical
