. 2024 Mar;11(12):e2306469.
doi: 10.1002/advs.202306469. Epub 2024 Jan 18.

Metabolic Bypass Rescues Aberrant S-nitrosylation-Induced TCA Cycle Inhibition and Synapse Loss in Alzheimer's Disease Human Neurons

Affiliations

Metabolic Bypass Rescues Aberrant S-nitrosylation-Induced TCA Cycle Inhibition and Synapse Loss in Alzheimer's Disease Human Neurons

Alexander Y Andreyev et al. Adv Sci (Weinh). 2024 Mar.

Abstract

In Alzheimer's disease (AD), dysfunctional mitochondrial metabolism is associated with synaptic loss, the major pathological correlate of cognitive decline. Mechanistic insight for this relationship, however, is still lacking. Here, comparing isogenic wild-type and AD mutant human induced pluripotent stem cell (hiPSC)-derived cerebrocortical neurons (hiN), evidence is found for compromised mitochondrial energy in AD using the Seahorse platform to analyze glycolysis and oxidative phosphorylation (OXPHOS). Isotope-labeled metabolic flux experiments revealed a major block in activity in the tricarboxylic acid (TCA) cycle at the α-ketoglutarate dehydrogenase (αKGDH)/succinyl coenzyme-A synthetase step, metabolizing α-ketoglutarate to succinate. Associated with this block, aberrant protein S-nitrosylation of αKGDH subunits inhibited their enzyme function. This aberrant S-nitrosylation is documented not only in AD-hiN but also in postmortem human AD brains versus controls, as assessed by two separate unbiased mass spectrometry platforms using both SNOTRAP identification of S-nitrosothiols and chemoselective-enrichment of S-nitrosoproteins. Treatment with dimethyl succinate, a cell-permeable derivative of a TCA substrate downstream to the block, resulted in partial rescue of mitochondrial bioenergetic function as well as reversal of synapse loss in AD-hiN. These findings have therapeutic implications that rescue of mitochondrial energy metabolism can ameliorate synaptic loss in hiPSC-based models of AD.

Keywords: Alzheimer's diseases; S‐nitrosylation; tricarboxylic acid cycles.


Conflict of interest statement

The authors declare no conflict of interest.

Figures
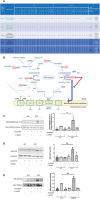
Figure 1
Figure 1
TCA enzymes significantly S‐nitrosylated to a greater extent in AD brains and AD hiN than in controls, as assessed by SNOTRAP/MS and biotin‐switch assays. A) List of S‐nitrosylated TCA enzymes in AD and control brains, assessed as in Yang et al. (2022). The first ten AD and Control brain samples are male, and the second ten in each case are female. Fold increase in AD over Control shown for significant SNO changes among all TCA enzymes with Cys nitrosylation sites, indicated as “modification sites,” as determined by MS. Green values indicate that inhibition in metabolic flux, as determined in isotopic labeling experiments (see Figure 2), was reversed by the NOS inhibitor l‐NAME, consistent with the notion that S‐nitrosylation mediated this inhibition. B) Schema showing effects of S‐nitrosylation (SNO) of TCA cycle enzymes in isogenic WT/Control and AD mutant hiN. AD‐hiN displays basal partial inhibition of the TCA cycle at the Aco/IDH steps. This is consistent with data that at least one of these enzymes is S‐nitrosylated in AD‐hiN (see panel E, below). S‐Nitrosylation of αKGDH results in more major enzyme inhibition, as evidenced by reversal by l‐NAME, and hence significant kinetic inhibition of flux through the TCA cycle at that point in the cycle. The addition of l‐NAME increased the kinetic rate 1.4‐fold at the aKGDH/SCS step in the AD‐hiN, back to that of WT/Control‐hiN, indicating that S‐nitrosylation had slowed the rate by inhibiting enzyme activity. Note that the action of αKGDH also supplies NADH to the ETC for the production of ATP. We have previously performed activity assays showing that S‐nitrosylation of Aco, IDH, αKGDH, and its DLD subunit can inhibit their activity.[ 9 ] Additionally, inhibition was observed after SNO at the level of PDH, which is S‐nitrosylated via its DLD subunit in AD‐hiN and human AD brain. Aco, aconitase or aconitate hydratase; CS, citrate synthase; DLD, dihydrolipoyl dehydrogenase (subunit 3 of αKGDH and PDH); ETC, electron transport chain; FH, fumarase or fumarate hydratase, IDH, isocitrate dehydrogenase; αKGDH, α‐ketoglutarate dehydrogenase; MDH, malate dehydrogenase (mitochondrial) ME2, malic enzyme 2 (cytoplasmic); PC, pyruvate carboxylase; PDH, pyruvate dehydrogenase; SDH, succinate dehydrogenase (also complex II of the ETC); VLCAD, very long‐chain acyl‐CoA dehydrogenase. C) Biotin‐switch assay to confirm S‐nitrosylation of TCA cycle enzymes in PS1 AD‐hiN versus isogenic WT/Control hiN. hiN cell lysates were subjected to biotin‐switch assay for detection of SNO‐αKGDH subunit 1 and standard immunoblot for total input αKGDH subunit 1. D) hiN cell lysates were subjected to biotin‐switch assay for detection of SNO‐DLD (subunit E3 of αKGDH) and standard immunoblot for total input DLD. (E) hiN cell lysates were subjected to biotin‐switch assay for detection of SNO‐IDH α‐subunit (SNO‐IDH3Aα) and standard immunoblot for total IDH3Aα. For each biotin‐switch assay, a representative blot is shown on the left and a histogram of the densitometry of the bands at the right. The addition of l‐NAME to inhibit NOS or the omission of ascorbate serve as negative controls for the biotin‐switch assay. Data are mean + SEM, n = 3, *p < 0.05; **p < 0.01 by ANOVA with Tukey's post‐hoc analysis.
Figure 2
Figure 2
Metabolic flux analysis of TCA cycle enzymes. PS1 AD hiN (versus isogenic WT/Control hiN incubated with 13C lactate. Left‐hand panels show molar equivalents of M+2 isotopologues (M+2 ME) of individual metabolites; right‐hand panels show corresponding molar equivalent ratios (M+2 MER) of substrate‐product couples. A) Substrate and product, citrate (Cit) and α‐ketoglutarate (αKG), respectively, of reactions carried out by the aconitase/isocitrate dehydrogenase (Aco/IDH) segment of the TCA cycle. B) α‐KG and succinate (Succ) are the substrate and product, respectively, of reactions carried out by the α‐ketoglutarate dehydrogenase/succinyl coenzyme‐A synthetase (αKGDH/SCS) segment of the TCA cycle. C) Succ and fumarate (Fum) are the substrate and product, respectively, of succinate dehydrogenase (SDH). D) Malate (Mal) and oxaloacetate (OAA) are the substrate and product, respectively, of mitochondrial malate dehydrogenase (MDH). Vehicle (Veh); S‐Nitrosocysteine (SNOC), 100 µM; l‐NG‐Nitro arginine methyl ester (l‐NAME), 1 mM. See also Figures S2–S5 (Supporting Information).
Figure 3
Figure 3
Respiratory defect in PS1 AD‐hiN compared to WT/Control‐hiN and partial rescue with dimethyl succinate. A) Representative experimental run in Seahorse Flux Analyzer with 8‐week terminally differentiated PS1 AD‐hiN and WT/Control‐hiN (10 wells per experimental group). OCR, oxygen consumption rate. Injections shown by vertical lines: Oligo, 2 µg mL−1 oligomycin; DNP, 120 µM 2,4‐dinitrophenol; Myxo, 2 µM myxothiazol; DMS, 5 mM dimethyl succinate added 20 min prior to the run. B) Respiratory capacity representing maximal uncoupler‐induced OCR per 1000 cells attained after 4 sequential additions of the uncoupler DNP. Data are mean ± SEM determined in replicate cultures of pure neurons (n = 10 wells per group in a single plate of hiN per experiment, with data from 14 separate experiments obtained in separate hiPSC differentiation). *p < 0.05, **p < 0.01 by two‐tailed paired Student's t‐test.
Figure 4
Figure 4
Quantification of synapse number in AD‐hiN and WT/Control hiN. A) Representative field of PS1 AD‐hiN stained for the presynaptic marker Synapsin 1 (red), the postsynaptic marker Homer 1 (yellow), and the neuronal marker microtubule‐associated protein 2 (MAP2, green). Synaptic punctae (blue circles) were identified by co‐localization proximity of pre‐and postsynaptic markers (see METHOD DETAILS). B) Quantification of synaptic punctae per cell in a typical experiment demonstrating ≈14% loss of synapses in the AD‐hiN compared to WT/Control‐hiN. Values are mean ± SEM of 25 separate sets of hiN cultures, each represented by a 10‐well group in a 96‐well plate; *p < 0.05, by Wilcoxon signed‐rank test. C) Dimethyl succinate (DMS, 5 mM) treatment for 48 hr led to the recovery of synaptic density relative to untreated in AD‐hiN but had no significant effect on WT/Control‐hiN. Data are mean ± SEM; *p < 0.05, by Wilcoxon signed‐rank test (n = 25 plates assayed).

References

    1. Gibson G. E., Starkov A., Blass J. P., Ratan R. R., Beal M. F, Biochim. Biophys. Acta 2010, 1802, 122. - PMC - PubMed
    1. Theurey P., Connolly N. M. C., Fortunati I., Basso E., Lauwen S., Ferrante C., Moreira Pinho C., Joselin A., Gioran A., Bano D., Park D. S., Ankarcrona M., Pizzo P., Prehn J. H. M., Aging Cell 2019, 18, e12924. - PMC - PubMed
    1. Wu Y. H., Hsieh H. L., Antioxidants 2023, 12, 1816. - PubMed
    1. Venkataraman A. V., Mansur A., Rizzo G., Bishop C., Lewis Y., Kocagoncu E., Lingford‐Hughes A., Huiban M., Passchier J., Rowe J. B., Tsukada H., Brooks D. J., Martarello L., Comley R. A., Chen L., Schwarz A. J., Hargreaves R., Gunn R. N., Rabiner E. A., Matthews P. M., Sci Transl Med 2022, 14, eabk1051. - PubMed
    1. Dekosky S. T., Scheff S. W., Ann. Neurol. 1990, 27, 457. - PubMed