. 2024 Jan;96(1):e29381.
doi: 10.1002/jmv.29381.

Characterization of antibody-dependent cellular phagocytosis in patients infected with hepatitis C virus with different clinical outcomes

Affiliations

Characterization of antibody-dependent cellular phagocytosis in patients infected with hepatitis C virus with different clinical outcomes

Anurag Adhikari et al. J Med Virol. 2024 Jan.

Abstract

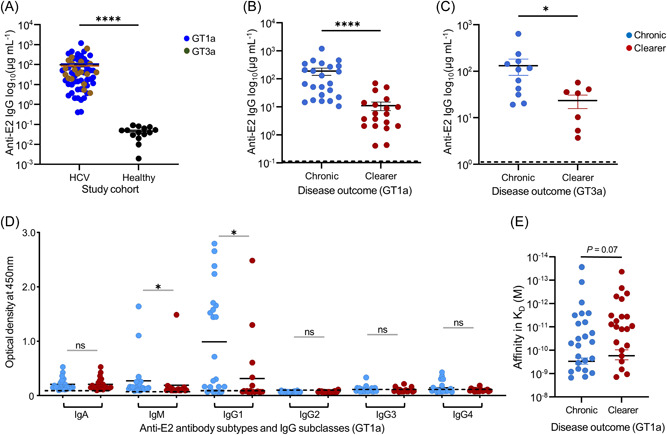
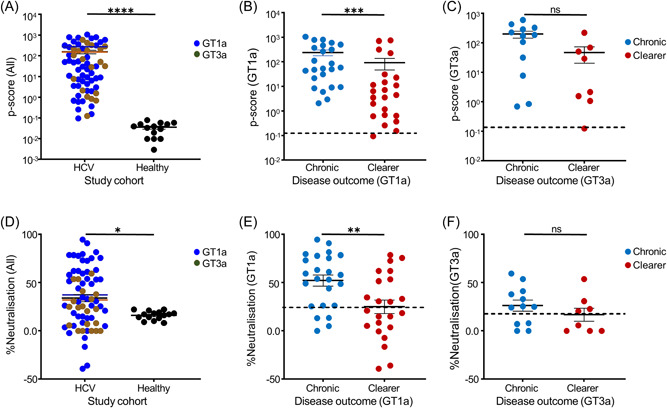
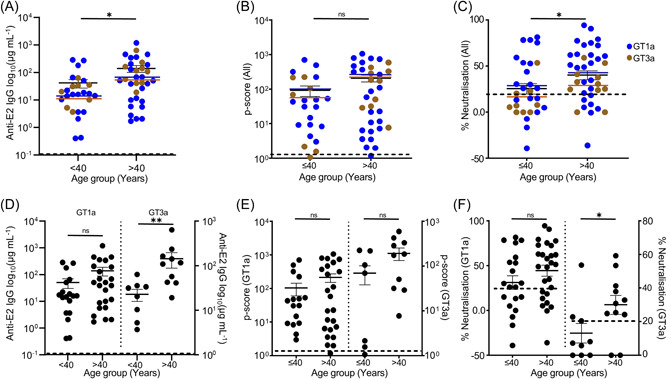
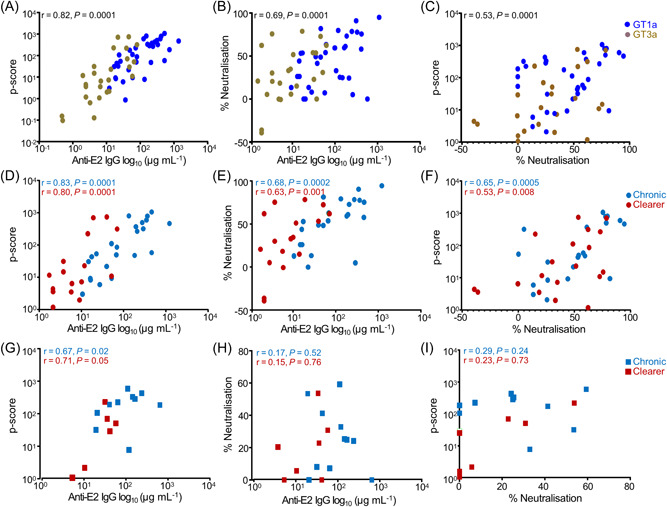
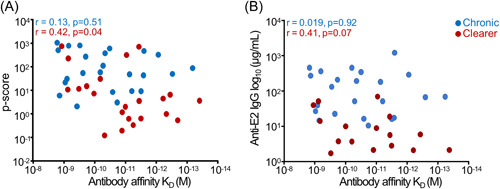
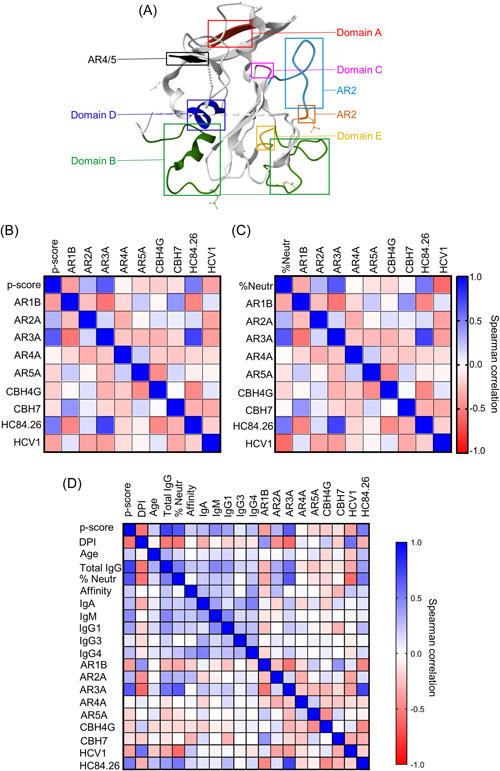
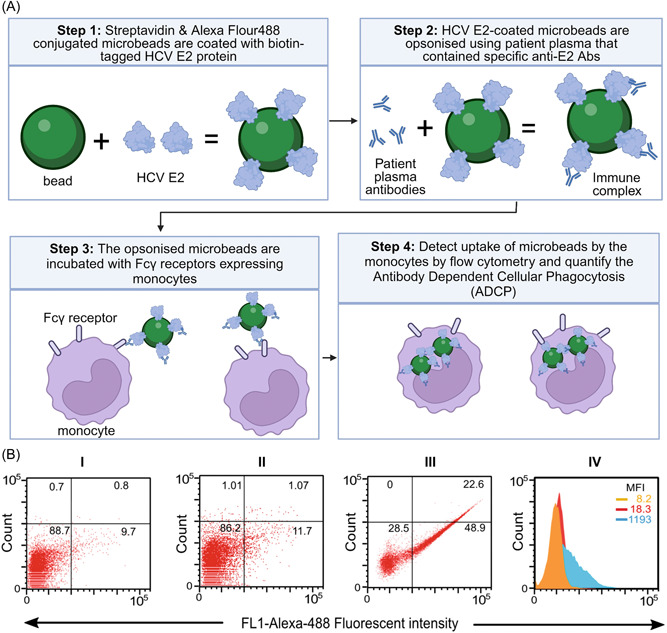
Early neutralizing antibodies against hepatitis C virus (HCV) and CD8 + T cell effector responses can lead to viral clearance. However, these functions alone are not sufficient to protect patients against HCV infection, thus undefined additional antiviral immune mechanisms are required. In recent years, Fc-receptor-dependent antibody effector functions, particularly, antibody-dependent cellular phagocytosis (ADCP) were shown to offer immune protection against several RNA viruses. However, its development and clinical role in patients with HCV infection remain unknown. In this study, we found that patients with chronic GT1a or GT3a HCV infection had significantly higher concentrations of anti-envelope 2 (E2) antibodies, predominantly IgG1 subclass, than patients that cleared the viruses while the latter had antibodies with higher affinities. 97% of the patients with HCV had measurable ADCP of whom patients with chronic disease showed significantly higher ADCP than those who naturally cleared the virus. Epitope mapping studies showed that patients with antibodies that target antigenic domains on the HCV E2 protein that are known to associate with neutralization function are also strongly associated with ADCP, suggesting antibodies with overlapping/dual functions. Correlation studies showed that ADCP significantly correlated with plasma anti-E2 antibody levels and neutralization function regardless of clinical outcome and genotype of infecting virus, while a significant correlation between ADCP and affinity was only evident in patients that cleared the virus. These results suggest ADCP was mostly driven by antibody titer in patients with chronic disease while maintained in clearers due to the quality (affinity) of their anti-E2 antibodies despite having lower antibody titers.

Keywords: affinity; epitope mapping; hepatitis C; neutralization; phagocytosis.


Conflict of interest statement

The authors declare no conflict of interest.

Figures

Figure 1
Figure 1
Differences in plasma anti‐E2 IgG levels, antibody types, IgG subclasses, and affinity. ELISA of plasma showed high levels of anti‐E2 IgG in patients infected with GT1a or GT3a HCV than in healthy controls (p = 0.0001) (A). Patients with chronic HCV infection had significantly higher levels of anti‐E2 IgG than those who cleared the GT1a virus (B; p = 0.0001) or GT3a virus (C; p = 0.02). Further analysis of the anti‐E2 antibody types and IgG subclasses produced in response to GT1a HCV infection showed that anti‐E2 IgG1 was the most abundant subclass with those with the chronic disease having significantly more than the clearers (p = 0.01), however, there was little detectable IgG2, IgG3, and IgG4 in both patient groups. Anti‐E2 IgA and IgM were also detected in most patients with the latter showing significant differences between chronic and clearers (p = 0.01) (dotted lines indicate average value from 15 healthy controls+3 SD) (D). Monitoring of the interaction of plasma anti‐E2 antibodies with E2 protein using SPR showed that on average antibodies from patients that cleared the virus had two times stronger interaction with E2 protein than those with chronic disease (K D = 1.6 × 10−10 M vs. 3.0 × 10−10 M) but this was not statistically significant (E). (GT1a HCV infected patient n = 47, GT3a HCV infected patient n = 20). ELISA, enzyme‐linked immunosorbent assay; HCV, hepatitis C virus; SD, standard deviation.
Figure 2
Figure 2
Antibody‐dependent cellular phagocytosis (ADCP) of HCV E2 protein‐coated patient plasma opsonised microbeads and neutralization of HCVpp. Most patients (97%) infected with HCV had measurable phagocytic functions with a mean p‐score of 158.8 ± 30.3 compared to healthy controls (mean p‐score = 0.03 ± 0.01); p = 0.0001) and those infected with GT1a virus showed higher p‐score (mean = 171.6 ± 36.7) compared with those infected with GT3a virus (mean p‐score = 138.0 ± 37.9) (A). Stratification by the clinical outcome and infecting viral genotype showed that patients with chronic disease due to GT1a virus infection showed significantly higher phagocytosis (mean p‐score = 239.6 ± 63.6) than those who cleared the virus with (mean p‐score = 92.5 ± 44.9) (p = 0.0001) (B). Similarly, patients with chronic disease due to GT3a virus infection had higher p‐score (mean p‐score = 198.7 ± 54.4) compared to those who cleared the virus (mean p‐score = 46.9 ± 26.4), although not statistically significant (p = 0.06) (dotted lines indicate an average value from 15 healthy controls +3 SD) (C). Plasma from 64% of patients had positive neutralization effects of GT1a or GT3a HCVpp as defined as percentage neutralization at least 2 SD above the mean value of the healthy controls and those infected with the GT1a virus had better neutralization function (mean = 39.7 ± 4.8%) than those infected with the GT3a virus (mean = 22.4 ± 4.3%) (p = 0.02) (D). Stratification by the clinical outcome and infecting viral genotype showing chronically infected patients with the GT1a virus had significantly better neutralization function (mean = 52.1 ± 5.6%) than those who cleared the virus (mean = 24.8 ± 6.9%) (p = 0.008) (E). Similarly, chronically infected patients with the GT3a virus had better neutralization function (mean = 26.2 ± 5.7%) than those who cleared the virus (mean = 16.7 ± 6.7%) but this was not statistically significant (p = 0.2) (dotted lines indicate an average value from 15 healthy controls+3 SD) (F). A negative neutralization percentage refers to an enhancement of infection. (GT1a HCV infected patient n = 47, GT3a HCV infected patient n = 20). HCV, hepatitis C virus; SD, standard deviation.
Figure 3
Figure 3
Age‐dependent differences in anti‐E2 antibody levels, ADCP, and neutralization functions. Plasma anti‐E2 antibody concentration in the over 40‐year‐old patients was significantly higher (mean = 140.4 ± 38.1 µg/mL) than those under 40 years of age (mean = 41.7 ± 14.0 µg/mL) (p = 0.03) (A) Analysis of the phagocytic and neutralization functions showing older patients had higher p‐scores (mean = 208.9 ± 46.6 vs. 93.1 ± 31.2; p = ns) (B) and better neutralization function (mean = 40.3 ± 4.8% vs. 25.6 ± 5.8%; p = ns) (C). These age‐dependent differences in anti‐E2 antibody concentration, phagocytosis, or neutralization were maintained regardless of the infecting viral genotype with older patients infected with GT1a having 2.7 times more antibodies (mean = 139.4 ± 49.1 vs. 50.2 ± 20 µg/mL; p = ns) (D left), 2.1 times higher p‐score (215.1 ± 61.2 vs. 103.5 ± 43.2; p = ns) (E left) and 1.4 times better neutralization function (mean = 44.4 ± 6.2% vs. 31.2 ± 7.7%; p = ns) (F left). Similarly, older patients infected with GT3a virus showed 15.9 times more antibodies (143 ± 54.2 vs. 22.8 ± 6.9 µg/mL; p = 0.009) (D right), 2.8 times higher p‐score (193.7 ± 59.7 vs. 69.9 ± 31.2; p = ns) (E right) and 2.3 times better neutralization (30 ± 5.6% vs. 13.1 ± 5.8%; p = 0.04) (F right). The dotted lines indicate the average value from 15 healthy controls. Negative neutralization values indicate enhancement of infection. (GT1a HCV infected patient n = 47, GT3a HCV infected patient n = 20). ADCP, Antibody‐dependent cellular phagocytosis; HCV, hepatitis C virus.
Figure 4
Figure 4
Correlation of patient plasma anti‐E2 antibody levels with ADCP and neutralization functions. Spearman correlation of all patient cohorts showing a significant positive correlation between ADCP and anti‐E2 antibody levels (r = 0.82, p = 0.0001) (A), between neutralization and anti‐E2 antibody levels (r = 0.69, p = 0.0001) (B) and between ADCP and neutralization function (r = 0.53, p = 0.0001) (C). Spearman correlation studies of patients infected with GT1a virus show a significant positive correlation between ADCP and anti‐E2 antibody levels (D), between neutralization and anti‐E2 antibody levels (E) and between ADCP and neutralization (F) in chronically infected patients with r = 0.83, p = 0.0001; r = 0.68, p = 0.0002 and r = 0.65, p = 0.0005 respectively (shown in blue) and those who cleared the virus with r = 0.80, p = 0.001; r = 0.63, p = 0.001; r = 0.53, p = 0.008 respectively (shown in red). In patients infected with GT3a virus there was significant positive correlation between ADCP and anti‐E2 antibody levels in both chronically infected patients (r = 0.67, p = 0.02) and those who cleared the virus (r = 0.71, p = 0.05) (G) but there were no significant correlations between neutralization and anti‐E2 antibody levels (H) or between ADCP and neutralization functions (I). GT1a HCV infected patient n = 47, GT3a HCV infected patient n = 20). ADCP, Antibody‐dependent cellular phagocytosis; HCV, hepatitis C virus.
Figure 5
Figure 5
Correlation between ADCP and affinity of the anti‐E2 antibodies in plasma of patients infected with GT1a HCV. There was significant positive correlation between ADCP and the affinity of the plasma antibodies to HCV E2 protein and ADCP in patients who cleared the virus but not those with chronic disease with r = 0.42 and a p‐value of 0.04 compared with the nonsignificant relationship in those with chronic disease (r = 0.13, p = 0.5) (A). By contrast, there was no correlation between affinity and antibody titers in both patients who cleared the virus and those with chronic disease (B), suggesting the significant relationship between ADCP and affinity in clearers was independent of the antibody titer. (Patients with chronic GT1a HCV infection n = 25; patients that clear the virus clearers n = 24). ADCP, Antibody‐dependent cellular phagocytosis; HCV, hepatitis C virus.
Figure 6
Figure 6
Epitope mapping and parameter matrices of the associative relationship of ADCP to multiple independent variables. Schematic illustration of the HCV envelope protein E2 with the different Domains (Dom) and/or antigenic regions (AR) targeted by specific monoclonal antibodies used for epitope mapping of plasma anti‐E2 antibodies produced by patients: Domain A (red; mAb CBH4G), Domain B (green; mAb AR3A), Domain C (pink; mAb CBH7), Domain D (blue; mAb HC84.26), Domain E (yellow; mAb HCV1), region AR1 (cyan; mAb AR1B), region AR2 (orange; mAb AR2A), region AR4/5 (black; mAb AR4/5 A) (A). A heatmap of a parameter correlation matrix between ADCP and the different E2 epitopes targeted by antibodies in patient plasma shows that antibodies targeting Domain B (AR3A) and Domain D (HC84.26) had a significant positive relationship with high phagocytosis with r scores of 0.64 (p = 0.0001) and 0.51 (p = 0.0003), respectively as contrasted to the significant negative relationships observed with antibodies targeting Domain E (HCV1) and Domain C (CBH‐7) with r scores of −0.38 (p = 0.008) and −0.36 (p = 0.0003) respectively (B). A heatmap of a parameter correlation matrix between neutralization function and the different E2 epitopes targeted by antibodies in patient plasma also showed that antibodies targeting Domains B and D also had a significant positive association to neutralization function with r scores of 0.65 (p = 0.0001) and 0.53 (p = 0.0004) respectively while those targeting Domains E (r = −0.33; p = 0.03) and Domain C (r = −0.58; p = 0.0004) had significant negative associations, suggesting functional overlap between ADCP and neutralization (C). Further analysis of the associative relationship inputting all the relevant continuous variables indicated that levels of anti‐E2 IgG (r = 0.75; p = 0.0001), neutralization function (r = 0.66; p = 0.0001), antibodies in patient plasma targeting Domains B (r = 0.64; p < 0.0001), Domain D (r = 0.51; p = 0.0003), anti‐E2 IgG1 (r = 0.36; p = 0.01), anti‐E2 IgM (r = 0.45; p = 0.001) and anti‐E2 IgA (r = 0.27; p = 0.06) showed a positive association with the phagocytic scores. By contrast, DPI (r = −0.54; p = 0.0005), antibodies targeting antigenic region 1 (AR1) (r = −0.38; p = 0.001) and antibodies targeting Domain E (r = −0.36; p = 0.01) showing negative associations (D). (Patients with chronic GT1a HCV infection n = 25; patients that clear the virus clearers n = 24).
Figure 7
Figure 7
Antibody dependent cellular phagocytosis assay. Schematics showing step‐by‐step illustration of the in vitro ADCP assay (A). Typical flow cytometry dot plots quantifying the proportion of effector cells that took up the HCV E2 protein‐coated microbeads and overlayed histograms showing mean florescence intensities (MFI) to measure the magnitude of bead uptake per cell (B). (I) A representative dot plot for HCV‐E2 protein‐coated nonopsonized fluorescent microbeads as background control; (II) HCV E2 protein‐coated fluorescent microbeads opsonized with healthy control plasma and; (III) HCV E2 protein‐coated fluorescent microbeads opsonized with a plasma of a patient with HCV (percentages of positive phagocytosis are shown on the upper and lower right quadrants of each plot). (IV) A typical histogram showing the MFI for HCV‐E2 protein‐coated nonopsonized fluorescent microbeads as a background control (orange) overlayed with a typical histogram for HCV E2 protein‐coated fluorescent microbeads opsonized with healthy control plasma (red) and a typical histogram for HCV E2 protein‐coated fluorescent microbeads opsonized with a plasma of a patient with HCV (blue).

Similar articles

References

    1. Younossi ZM, Wong G, Anstee QM, Henry L. The global burden of liver disease. Clin Gastroenterol Hepatol. 2023;21:1978‐1991. - PubMed
    1. Blach S, Kondili LA, Aghemo A, et al. Impact of COVID‐19 on global HCV elimination efforts. J Hepatol. 2021;74:31‐36. - PMC - PubMed
    1. Day CL, Lauer GM, Robbins GK, et al. Broad specificity of virus‐specific CD4+ T‐helper‐cell responses in resolved hepatitis C virus infection. J Virol. 2002;76:12584‐12595. - PMC - PubMed
    1. Walker MR, Leung P, Eltahla AA, et al. Clearance of hepatitis C virus is associated with early and potent but narrowly‐directed, envelope‐specific antibodies. Sci Rep. 2019;9:e13300. - PMC - PubMed
    1. Keck ZY, Pierce BG, Lau P, et al. Broadly neutralizing antibodies from an individual that naturally cleared multiple hepatitis C virus infections uncover molecular determinants for E2 targeting and vaccine design. PLOS Pathogens. 2019;15:e1007772. - PMC - PubMed

Publication types

Substances