. 2024 Feb 16;13(2):485-497.
doi: 10.1021/acssynbio.3c00408. Epub 2024 Jan 18.

pUdOs: Concise Plasmids for Bacterial and Mammalian Cells

Affiliations

pUdOs: Concise Plasmids for Bacterial and Mammalian Cells

France O Manigat et al. ACS Synth Biol. .

Abstract

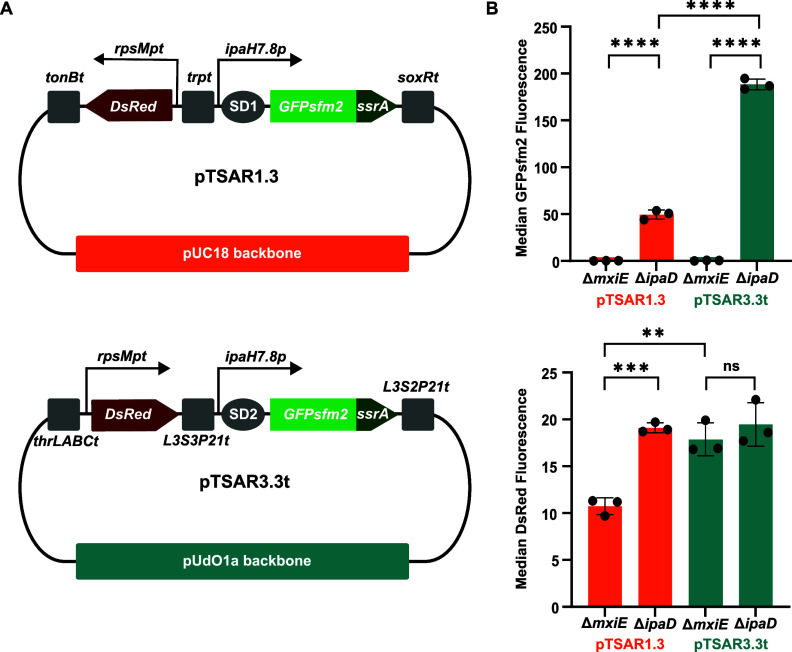
The plasmids from the Université d'Ottawa (pUdOs) are 28 small plasmids each comprising one of four origins of replication and one of seven selection markers, which together afford flexible use in Escherichia coli and several related gram-negative bacteria. The promoterless multicloning site is insulated from upstream spurious promoters by strong transcription terminators and contains type IIP or IIS restriction sites for conventional or Golden Gate cloning. pUdOs can be converted into efficient expression vectors through the insertion of a promoter at the user's discretion. For example, we demonstrate the utility of pUdOs as the backbone for an improved version of a Type III Secretion System reporter in Shigella. In addition, we derive a series of pUdO-based mammalian expression vectors, affording distinct levels of expression and transfection efficiency comparable to commonly used mammalian expression plasmids. Thus, pUdOs could advantageously replace traditional plasmids in a wide variety of cell types and applications.

Keywords: Escherichia coli; Shigella; mammalian cell expression; plasmid; proteobacteria; type III secretion system.


Conflict of interest statement

The authors declare no competing financial interest.

Figures

Figure 1
Figure 1
Design, construction, and validation of pUdO plasmids. (A) General map of pUdO plasmids. thrLABCt, arcAt, L3S2P21t: terminators; M13R, M13F, T7, T3: universal primers. (B) Validation of pUdO#x plasmids' molecular weight by digestion with the endonuclease EcoRI analyzed by electrophoresis in a 1% agarose gel. Lanes 1 and 30 labeled with M: DNA molecular weight ladder; molecular weight in kilobase pairs is indicated on the left side of the gel; lanes 2–29 labeled with #x of the pUdO#x nomenclature (Table 1): 500 ng of each plasmid was digested with EcoRI. (C) Size in base pairs of selected pUdOs compared to that of relevant counterparts used as expression vectors in Escherichia coli. (D) Insertion of lacp::GFPsfm2 into pUdO#c. (E) Quantification of the fluorescence produced by lacp::GFPsfm2 in pUdO#c by flow cytometry, N = 3. Median RFU ± one standard deviation (error bars) are shown. Statistical significance was tested by performing a one-way ANOVA and Tukey’s multiple comparison tests (*p < 0.05; **p < 0.01; ***p < 0.001; ****p < 0.0001); N = 3.
Figure 2
Figure 2
pTSAR3.#t identifies intracellular bacteria that have activated their T3SS. (A) Schematic describing the activity of ipaH7.8p::GFPsfm2 and rpsMp::fluorescent protein (e.g., BFP, CFP, or RFP) in the WT and ΔmxiEwhen the T3SS is inactive (off), as in the extracellular environment, or when the T3SS is active, as upon contact with the plasma membrane or in the Shigella-containing vacuole. The red cross indicates the lack of activity of the ipaH7.8p in a given condition. (B) Principles of the coinfection experiment of human epithelial HeLa cells with Shigella. pTSAR3.#t with distinguishable rpsMp::fluorescent protein is introduced into WT (red) and ΔmxiE (blue) Shigella, which are used to coinfect HeLa cells (magenta rounded rectangle). Since rpsMp is constitutively active, it allows the tracking of both intracellular and extracellular bacteria and the differentiation of WT and ΔmxiE bacterial cells based on the wavelength of their fluorescence. Upon contact with the plasma membrane, both strains activate their T3SS in order to induce their uptake through the formation of a Shigella-containing vacuole. During this process, the WT upregulates ipaH7.8p::GFPsfm2, while ΔmxiE fails to do so. Thus, WT vacuolar Shigella become yellow due to the overlay of the fluorescence stemming from rpsMp (red) and ipaH7.8p (green), whereas intracellular ΔmxiE is always blue due to the fluorescence stemming from rpsMp (blue) and the lack of fluorescence from ipaH7.8p. Upon rupture of the vacuole, the T3SS is inactivated, and ipaH7.8p::GFPsfm2 is progressively downregulated in cytosolic WT Shigella (red). It is noteworthy that the return to the basal levels of GFPsfm2 is not completed in the experimental conditions used here. (C–G) Micrographs of the Hela cell monolayer coinfected with WT and ΔmxiES. flexneri harboring the indicated pTSAR3.#t and counterstained with Phalloidin-Alexa Fluor 647. The pseudocolor used in the overlay is indicated in the label of the independent channels in grayscale. (C) WT pTSAR3.1t (mCerulean) and ΔmxiE pTSAR3.4t (mcherry), (D) wild-type pTSAR3.4t (mCherry) and ΔmxiE pTSAR3.5t (eBFP2), (E) wild-type pTSAR3.5t (eBFP2) and ΔmxiE pTSAR3.4t (mCherry), (F) wild-type pTSAR3.6t (mScarlet) and ΔmxiE pTSAR3.5t (eBFP2), and (G) wild-type pTSAR3.7t (e2Crimson) and ΔmxiE pTSAR3.5t (eBFP2), respectively. Intracellular bacteria whose T3SS was active (on) are indicated by empty arrowheads; intracellular bacteria whose T3SS was inactive (off) are indicated by arrows; and extracellular bacteria whose T3SS was inactive (off) are indicated by filled arrowheads.
Figure 3
Figure 3
pTSAR3.3t measures Type III Secretion System activity with increased sensitivity without impacting the constitutive expression of the DsRed. (A) Maps of pTSAR1.3 and pTSAR3.3t. (B) Measurement by flow cytometry of GFPsfm2 and the DsRed fluorescent signal in ΔmxiE and ΔipaDS. flexneri harboring pTSAR1.3 or pTSAR3.3t. Median RFU ± one standard deviation (error bars) are shown. Statistical significance was tested by performing a one-way ANOVA and Tukey’s multiple comparison tests (*p < 0.05; **p < 0.01; ***p < 0.001; ****p < 0.0001); N = 3.
Figure 4
Figure 4
pTSAR3.4t measures Type III Secretion System activity with increased sensitivity by fluorescence microscopy. (A) Maps of pTSAR1ud2.4s and pTSAR3.4t. (B) Micrographs of the HeLa cell monolayer infected with wild-type (WT) S. flexneri harboring pTSAR1ud2.4s or pTSAR3.4t. Arrowheads point to bacteria with high GFP expression. (C) Quantification of GFPsfm2 and mCherry fluorescence in the subpopulation of bacterial cells with low GFPsfm2 mean fluorescence pixel intensities (<mean + standard deviation) and high GFPsfm2 mean fluorescence pixel intensities (>mean + standard deviation). Statistical significance was tested by performing a one-way ANOVA and Tukey’s multiple comparison tests (*p < 0.05; **p < 0.01; ***p < 0.001; ****p < 0.0001); N = 3.
Figure 5
Figure 5
Mammalian pUdO plasmids are comparable to traditional mammalian expression vectors. (A) General map of pUdOms derived from pUdO1a (ampicillin), pUdO1c (chloramphenicol), pUdO1t (trimethoprim), and pUdO1z (zeocin) (Table 2). The ampicillin-resistant pUdOm was further expanded by truncating the CMV enhancer (light gray) and promoter (dark gray). The lengths of the CMV enhancer and promoter are shown for the truncated constructs. Finally, the plasmids contained a multiple cloning site (MCS; blue) and a BGH (green) or SV40 (purple) terminator. Boxed inset: size in base pairs of pcDNA3.1 versus the longest (pUdOm1.1) and shortest (pUdOm6.1) pUdOm plasmids. (B) HEK293 cells were transfected with the indicated pUdOm containing firefly luciferase. Luminescence was measured 24 h post transfection (N = 4 or 5). Luminescence (RLU) was normalized to that of pcDNA3.1. Significance values were calculated by performing a one-way ANOVA and Tukey’s multiple comparison test (*p < 0.05; **p < 0.01; ***p < 0.001; ****p < 0.0001) and are presented in Figure S3. (C) High-expressing pUdO plasmids have the same transfection efficiency as pcDNA3.1. Percent transfection was calculated by dividing the number of GFP-positive cells by the total number of counted cells. Bars are mean ± one standard deviation (error bars) for (points; N = 3 transfections, with up to 10,000 cells counted per sample). Statistical significance was tested by performing a one-way ANOVA and Tukey’s multiple comparison tests (*p < 0.05; **p < 0.01; ***p < 0.001; ****p < 0.0001); N = 3. (D) Single-channel patch clamp recordings show that fetal (γ-subunit; top) and adult (ε-subunit; bottom) acetylcholine receptors expressed from pUdOm2.1 plasmids (right) are indistinguishable from channels expressed from pRBG4 (left). Scale bar is 25 ms and 5 pA.

References

    1. Cohen S. N.; Chang A. C. Y.; Boyer H. W.; Helling R. B. Construction of Biologically Functional Bacterial Plasmids in Vitro. Proc. Natl. Acad. Sci. U. S. A. 1973, 70, 3240–3244. 10.1073/pnas.70.11.3240. - DOI - PMC - PubMed
    1. Novick R. P.; Clowes R. C.; Cohen S. N.; Curtiss R.; Datta N.; Falkow S. Uniform Nomenclature for Bacterial Plasmids: A Proposal. Bacteriological Reviews 1976, 40, 168–189. 10.1128/br.40.1.168-189.1976. - DOI - PMC - PubMed
    1. Thomas C. M.; Summers D.. Bacterial Plasmids. In Encyclopedia of Life Sciences; 2008.
    1. Leonard A. C.; Mechali M. DNA Replication Origins. Cold Spring Harbor Perspectives in Biology 2013, 5, a01011610.1101/cshperspect.a010116. - DOI - PMC - PubMed
    1. Chan V.; Dreolini L.; Flintoff K. A.; Lloyd S. J.; Mattenley A. A.. The Effect of Increasing Plasmid Size on Transformation Efficiency in Escherichia coli. In Proceedings of the Journal of Experimental Microbiology and Immunology; UBC, Department of Microbiology and Immunology; 2002; vol 2, pp 207–223.

Publication types

LinkOut - more resources