. 2024 Feb 28;9(2):e0071923.
doi: 10.1128/msphere.00719-23. Epub 2024 Jan 18.

Temporal σB stress-response profiles impact Bacillus subtilis fitness

Affiliations

Temporal σB stress-response profiles impact Bacillus subtilis fitness

Sidney R Bush et al. mSphere. .

Abstract

The Gram-positive model organism Bacillus subtilis responds to environmental stressors by activating the alternative sigma factor σB. The sensing apparatus upstream of σB activation is thought to consist of cytoplasmic stressosomes-megadalton-sized protein complexes that include five paralogous proteins known as RsbRs. The RsbRs are presumed to be involved in stress sensing and the subsequent response. Perturbations to the RsbR complement in stressosomes by engineering cells that produce only one of the RsbR paralogs ("single-RsbR strains") lead to altered σB response dynamics with respect to timing and magnitude. Here, we asked whether such changes to σB response dynamics impact the relative fitness of a strain. We competed strain pairs with different RsbR complements under ethanol and sodium chloride stress and found not only differences in relative fitness among wild-type and single-RsbR strains but also different relative fitness values in the two different stressors. We found that the presence of RsbRA, which dominates the wild-type σB response, enhances fitness in ethanol but is detrimental to fitness in NaCl. Meanwhile, RsbRD-only cells were among the most fit in NaCl. Strains producing hybrid RsbR fusion proteins displayed different fitness values that depended on the RsbR proteins from which they were derived. Our results here suggest that σB response dynamics can impact fitness, highlighting the physiological importance of the unusual stressosome-based general stress response system of B. subtilis.

Importance: The model bacterium Bacillus subtilis uses cytoplasmic multiprotein complexes, termed stressosomes, to activate the alternative sigma factor σB when facing environmental stresses. We have previously shown that genetically manipulating the complement of putative sensor proteins in stressosomes can alter the dynamics of the σB response in terms of its magnitude and timing. However, it is unknown whether these response dynamics impact the fitness of cells challenged by environmental stressors. Here, we examine the fitness of strains with different σB responses by competing strain pairs in exponential-phase co-cultures under environmental stress. We find that strains with different response dynamics show different competitive indices that differ by stressor. These results suggest that the dynamics of the σB response can affect the fitness of cells facing environmental stress, highlighting the relevance of different σB dynamics.

Keywords: Bacillus subtilis; competition; fitness; sigma factors; stress response.


Conflict of interest statement

The authors declare no conflict of interest.

Figures
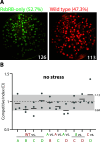
Fig 1
Fig 1
Relative enumeration and measurement error in co-cultured B. subtilis strains. (A) Differential fluorescence illumination of an agar plate spread with a dilution of a co-culture comprising a RsbRB-only strain labeled with GFP and a wild-type strain labeled with mKate2. The numbers of green- and red-fluorescent colonies are shown at the bottom right of each image. (B) Graph of competitive indices (CIs) of the listed strain pairs after 9 h in stress-free exponential-phase co-culture. Each gray dot represents one experiment, with the horizontal bars showing the mean CI of the experiments for each pair. The fluorescent label on each strain is indicated by the color of the X-axis label. The CI of each pair is calculated such that the top-listed strain is at an advantage if the CI is greater than 1. The gray shading shows the range of mean CIs for all the pairwise competitions. CI is calculated as (strain 1/strain 2 @ t = 9 h) / (strain 1/strain 2 @ t = 0). A, B, C, and D indicate RsbRA-only, RsbRB-only, RsbRC-only, and RsbRD-only strains. Green (GFP)-labeled WT (ΔytvA), A, B, C, and D strains are CSS414, 415, 416, 417, and 418, respectively. Red (mKate2)-labeled WT (ΔytvA), A, B, C, and D strains are CSS408, 409, 410, 411, and 412, respectively.
Fig 2
Fig 2
Competition among strain pairs co-cultured in the presence of 2% ethanol. The competitive indices of the listed strain pairs (A, RsbRA-only; B, RsbRB-only; C, RsbRC-only; D, RsbRD-only; WT, wild type (ΔytvA) with all 4 RsbR paralogs) after 9 h of exponential-phase co-culture under 2% ethanol stress. Each black dot represents one experiment, with the horizontal bars showing the mean CI of the experiments for each pair. The gray shading shows the range of mean CIs for the stress-free control co-cultures (Fig. 1). At least one experiment was performed with each fluorescent label combination. Green (GFP)-labeled WT (ΔytvA), A, B, C, and D strains are CSS414, 415, 416, 417, and 418, respectively. Red (mKate2)-labeled WT (ΔytvA), A, B, C, and D strains are CSS408, 409, 410, 411, and 412, respectively.
Fig 3
Fig 3
Competition among strain pairs co-cultured in the presence of 4% ethanol. The competitive indices of the listed strain pairs (A, RsbRA-only; B, RsbRB-only; C, RsbRC-only; D, RsbRD-only; WT, wild type (ΔytvA) with all 4 RsbR paralogs) after 9 h of exponential-phase co-culture under 4% ethanol stress. Each black dot represents one experiment, with the horizontal bars showing the mean CI of the experiments for each pair. The gray shading shows the range of mean CIs for the stress-free control co-cultures (Fig. 1). At least one experiment was performed with each fluorescent label combination. **, P < 0.01 vs the same strain pair under non-stress conditions, unpaired 2-tailed t-test assuming equal variance. All other competitions were not significantly different from their non-stress counterparts. Green (GFP)-labeled WT (ΔytvA), A, B, C, and D strains are CSS414, 415, 416, 417, and 418, respectively. Red (mKate2)-labeled WT (ΔytvA), A, B, C, and D strains are CSS408, 409, 410, 411, and 412, respectively.
Fig 4
Fig 4
Competition among strain pairs co-cultured in the presence of 1 M NaCl. The competitive indices of the listed strain pairs (A, RsbRA-only; B, RsbRB-only; C, RsbRC-only; D, RsbRD-only; WT, wild type (ΔytvA) with all 4 RsbR paralogs) after 9 h of exponential-phase co-culture under 1 M NaCl stress. Each black dot represents one experiment, with the horizontal bars showing the mean CI of the experiments for each pair. The gray shading shows the range of mean CIs for the stress-free control co-cultures (Fig. 1). At least one experiment was performed with each fluorescent label combination. *, P < 0.05, **, P < 0.01 vs the same strain pair under non-stress conditions, unpaired 2-tailed t-test assuming equal variance. All other competitions were not significantly different from their non-stress counterparts. Green (GFP)-labeled WT (ΔytvA), A, B, C, and D strains are CSS414, 415, 416, 417, and 418, respectively. Red (mKate2)-labeled WT (ΔytvA), A, B, C, and D strains are CSS408, 409, 410, 411, and 412, respectively.
Fig 5
Fig 5
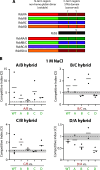
Competition among hybrid and single-RsbR strain pairs co-cultured in the presence of 1 M NaCl. (A) Schematic illustration showing each RsbR paralog and highlighting the N-terminal non-heme globin dimer region, which varies among the paralogs, and the more-conserved C-terminal STAS domain, which is homologous to the RsbS protein in the core of the stressosome. The hybrid RsbR paralogs were constructed by joining the N-terminal region of one RsbR to the C-terminal region of another, as in reference (22). (B) The competitive indices of the listed strain pairs (A/B, RsbRA/B hybrid-only; B/C, RsbRB/C hybrid-only; C/B, RsbRC/B hybrid-only; D/A, RsbRD/A hybrid-only; A, RsbRA-only; B, RsbRB-only; C, RsbRC-only; D, RsbRD-only; WT, wild type (ΔytvA) with all 4 RsbR paralogs) after 9 h of exponential-phase co-culture under 1 M NaCl stress. Each black dot represents one experiment, with the horizontal bars showing the mean CI of the experiments for each pair. The gray shading shows the range of mean CIs for the stress-free control co-cultures (Fig. 1). Note the different Y scales for the different graphs. The fluorescent label on each strain is indicated by the color of the X-axis label. Green (GFP)-labeled WT (ΔytvA), A, B, C, and D strains are CSS414, 415, 416, 417, and 418, respectively. Red (mKate2)-labeled A/B, B/C, C/B, and D/A strains are CSS1261, 1264, 1267, and 1258, respectively.
Fig 6
Fig 6
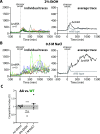
Impact of absent RsbRA on σB response profiles and fitness in 4% ethanol and 1 M NaCl. (A, B) Reporter traces of strains bearing a PrsbV-mNeonGreen (σB-responsive) fluorescent transcriptional reporter and exposed to stress in a microfluidic device. (A) Left panel, individual lineage traces of a ΔrsbRA strain (MTC1973) exposed to 2% ethanol at the zero time point. Right panel, the average trace (black) compared with the average trace of wild-type cells exposed to 2% ethanol [gray; MTC1801 data taken from reference (22)]. (B) Left panel, individual lineage traces of a ΔrsbRA strain exposed to 0.5 M NaCl at the zero time point. right panel, the average trace (black) compared with the average trace of wild-type cells exposed to 0.5 M NaCl [gray; MTC1801 taken from reference (22)]. (C) The competitive indices of the listed strain pairs (ΔA, ΔytvA ΔrsbRA, MTC1683; WT, wild type (ΔytvA) with all 4 RsbR paralogs, GFP-tagged, CSS414) after 9 h of exponential-phase co-culture under no stress, 4% ethanol stress, or 1 M NaCl stress as indicated. Each black dot represents one experiment, with the horizontal bars showing the mean CI of the experiments for each pair. The gray shading shows the range of mean CIs for the stress-free control co-cultures (Fig. 1). ***, P < 0.001 vs the same co-culture under non-stress conditions, unpaired 2-tailed t-test assuming equal variance.
Fig 7
Fig 7
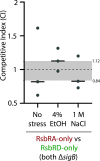
Role of σB in competitive outcomes under stress conditions. The competitive indices of the listed strain pairs after 9 h of exponential-phase co-culture under no stress, 4% ethanol stress, or 1 M NaCl stress are as indicated. The fluorescent label on each strain is indicated by the color of the X-axis label. Each dot represents one experiment, with the horizontal bars showing the mean CI of the experiments for each pair. The gray shading shows the range of mean CIs for the stress-free control co-cultures (Fig. 1). Neither of the RA-only vs RD-only competitions was significantly different from the no-stress control. RsbRA-only ΔsigB, mKate2 tagged, CSS2066; RsbRD-only ΔsigB, GFP tagged, CSS2078.

References

    1. Boylan SA, Redfield AR, Brody MS, Price CW. 1993. Stress-induced activation of the sigma B transcription factor of Bacillus subtilis. J Bacteriol 175:7931–7937. doi:10.1128/jb.175.24.7931-7937.1993 - DOI - PMC - PubMed
    1. Haldenwang WG, Losick R. 1979. A modified RNA polymerase transcribes a cloned gene under sporulation control in Bacillus subtilis. Nature 282:256–260. doi:10.1038/282256a0 - DOI - PubMed
    1. Hecker M, Pané-Farré J, Völker U. 2007. SigB-dependent general stress response in Bacillus subtilis and related gram-positive bacteria, Annu. Annu Rev Microbiol 61:215–236. doi:10.1146/annurev.micro.61.080706.093445 - DOI - PubMed
    1. Chen C-C, Lewis RJ, Harris R, Yudkin MD, Delumeau O. 2003. A supramolecular complex in the environmental stress signalling pathway of Bacillus subtilis. Mol Microbiol 49:1657–1669. doi:10.1046/j.1365-2958.2003.03663.x - DOI - PubMed
    1. Delumeau O, Chen C-C, Murray JW, Yudkin MD, Lewis RJ. 2006. High-molecular-weight complexes of RsbR and paralogues in the environmental signaling pathway of Bacillus subtilis. J Bacteriol 188:7885–7892. doi:10.1128/JB.00892-06 - DOI - PMC - PubMed

LinkOut - more resources