. 2024 Jan;153(1):200-223.
doi: 10.1037/xge0001476.

Demands on perceptual and mnemonic fidelity are a key determinant of age-related cognitive decline throughout the lifespan

Affiliations

Demands on perceptual and mnemonic fidelity are a key determinant of age-related cognitive decline throughout the lifespan

Helena M Gellersen et al. J Exp Psychol Gen. 2024 Jan.

Abstract

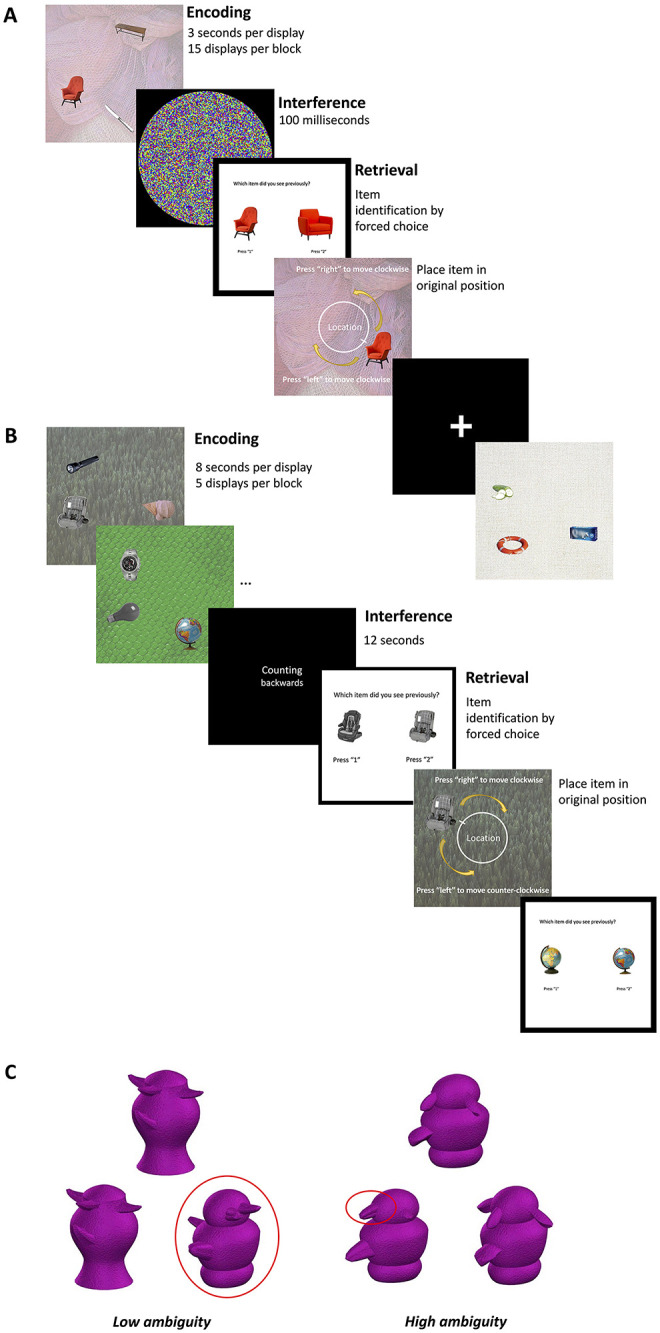
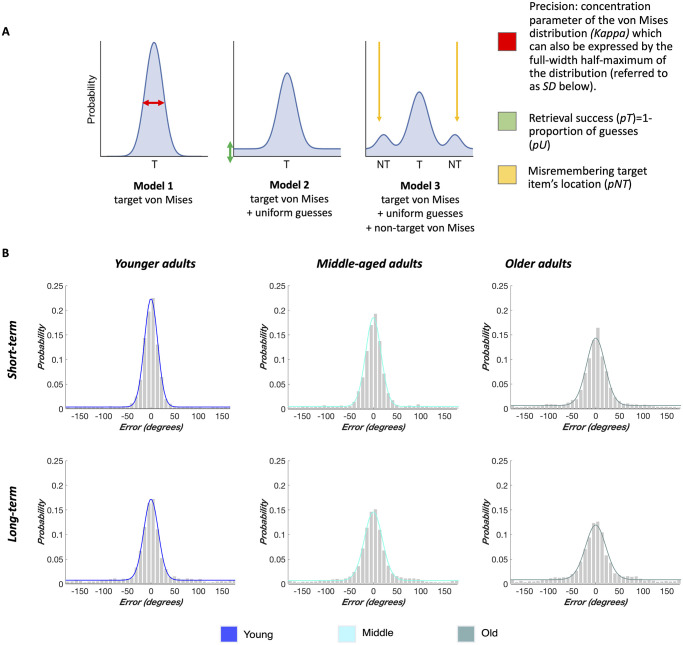
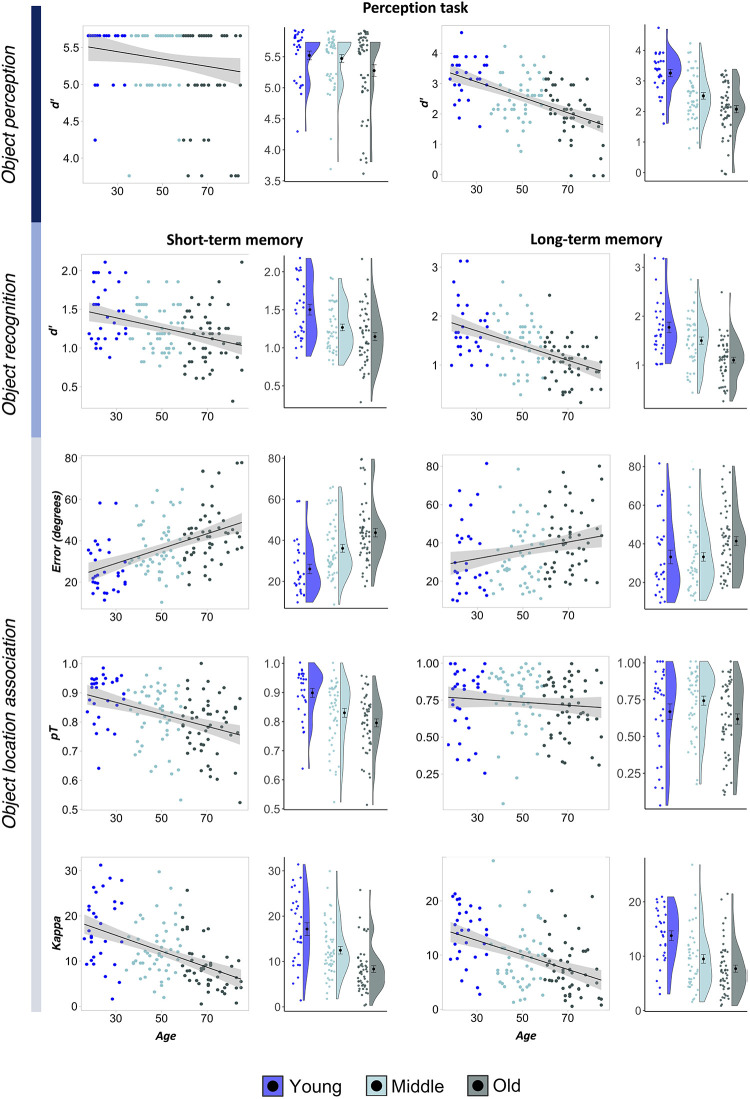
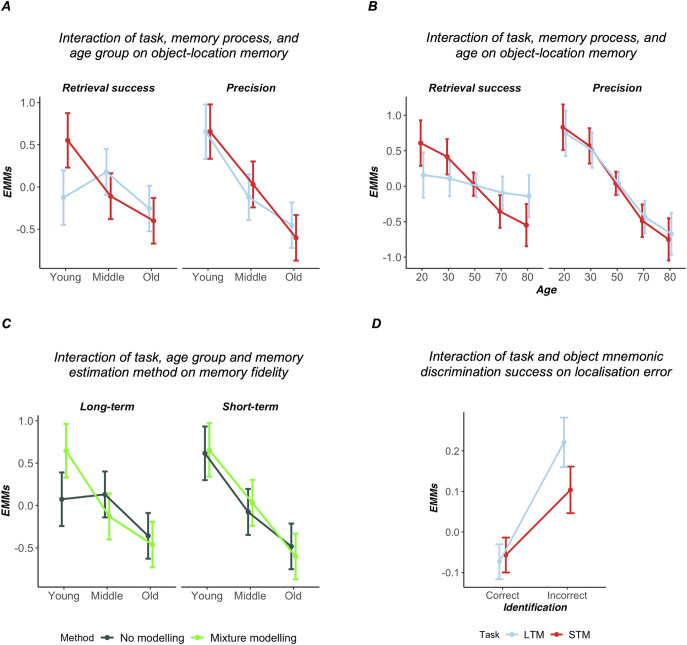
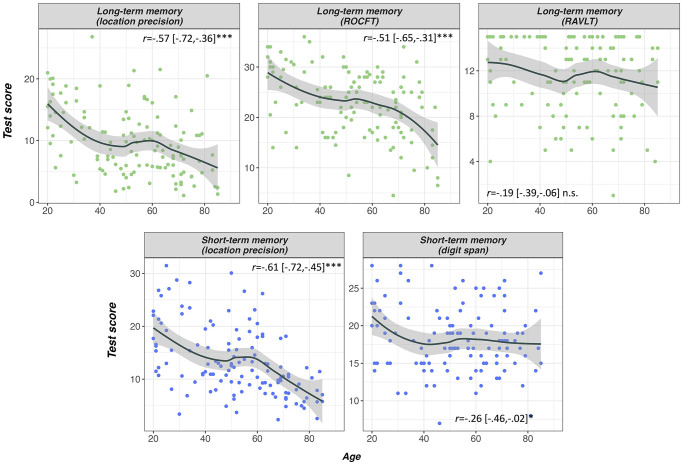
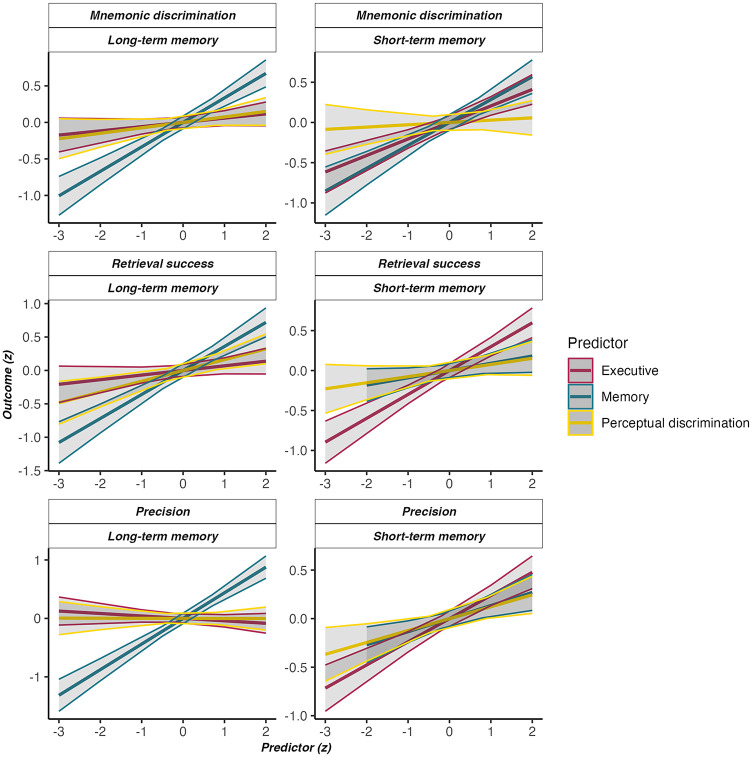
Aging results in less detailed memories, reflecting reduced fidelity of remembered compared to real-world representations. We tested whether poorer representational fidelity across perception, short-term memory (STM), and long-term memory (LTM) are among the earliest signs of cognitive aging. Our paradigm probed target-lure object mnemonic discrimination and precision of object-location binding. Across the lifespan, cognitive deficits were observed in midlife when detailed stimulus representations were required for perceptual and short/long-term forced choice mnemonic discrimination. A continuous metric of object-location source memory combined with computational modeling demonstrated that errors in STM and LTM in middle-aged adults were largely driven by a loss of precision for retrieved memories, not necessarily by forgetting. On a trial-by-trial basis, fidelity of item and spatial information was more tightly bound in LTM compared to STM with this association being unaffected by age. Standard neuropsychological tests without demands on memory quality (digit span, verbal learning) were less sensitive to age effects than STM and LTM precision. Perceptual discrimination predicted mnemonic discrimination. Neuropsychological proxies for prefrontal executive functions correlated with STM, but not LTM fidelity. Conversely, neuropsychological indicators of hippocampal integrity correlated with mnemonic discrimination and precision of both STM and LTM, suggesting partially dissociable mechanisms of interindividual variability in STM and LTM fidelity. These findings suggest that reduced representational fidelity is a hallmark of cognitive aging across perception, STM, and LTM and can be observed from midlife onward. Continuous memory precision tasks may be promising for the early detection of subtle age-related cognitive decline. (PsycInfo Database Record (c) 2024 APA, all rights reserved).


Figures

Figure 1
Figure 1. Schematic of Memory and Perception Tasks
Note. (A) Short-term precision memory task. (B) Long-term precision memory task (adapted from “Memory Precision of Object-Location Binding Is Unimpaired in APOE ε4-Carriers With Spatial Navigation Deficits,” by H. M. Gellersen, G. Coughlan, M. Hornberger, and J. S. Simons, 2021, Brain Communications, 3(2), Article fcab087 (https://doi.org/10.1093/braincomms/fcab087). Copyright 2021 by the Oxford University Press on behalf of the Guarantors of Brain). Stimuli for these tasks were obtained from https://konklab.fas.harvard.edu/# and are printed with permission. Copyright Professor Talia Konkle. (C) Perceptual discrimination of objects, showing differences between candidate novel objects within the red circle (not shown to participants; adapted from “The Human Medial Temporal Lobe Processes Online Representations of Complex Objects,” by M. D. Barense, D. Gaffan, and K. S. Graham, 2007, Neuropsychologia, 45(13), pp. 2963–2974 (https://doi.org/10.1016/j.neuropsychologia.2007.05.023). Copyright 2007 by Elsevier; “Executive Function and High Ambiguity Perceptual Discrimination Contribute to Individual Differences in Mnemonic Discrimination in Older Adults,” by H. M. Gellersen, A. N. Trelle, R. N. Henson, and J. S. Simons, 2021, Cognition, 209, Article 104556 (https://doi.org/10.1016/j.cognition.2020.104556). Copyright 2021 by the Elsevier B.V.). Individual Greeble stimuli originate from https://www.tarrlab.org/ and are printed with permission. Copyright Professor Michael J. Tarr. See the online article for the color version of this figure.
Figure 2
Figure 2. Tested Models and Results From the Mixture Modeling Approach
Note. (A) Proposed models to capture location memory performance. (B) Standard mixture models best fit localization error responses, which are here shown separately for short- and long-term memory tasks from modeling across all participants in a given age group. Final chosen model parameters correspond to the respective maximum a posteriori values derived from Bayesian mixture modeling (see Section 2 in the online supplemental materials for details). See the online article for the color version of this figure.
Figure 3
Figure 3. Summary of Continuous and Group-Based Effects of Age on Performance in Perceptual Discrimination (d′), Mnemonic Discrimination (d′), and Object-Location Memory (Retrieval Success pT, Precision κ, Mean Absolute Error)
Note. Memory scores are split up by task (short-term vs. long-term memory). Scatter plots show linear trend lines with standard error of the mean. Raincloud plots show individual data points and their distribution alongside mean and standard error for cognitive performance metrics in each age group. Object perception as indexed using the perceptual discrimination task is scored using d′ for an oddity task with three exemplars. Object recognition as indexed by mnemonic discrimination tasks is scored using d′ for two-alternative forced choice response options. Mean absolute error is expressed in degrees between the target location and the response given by participants. pT refers to retrieval success, that is, the proportion of trials (%) in which participants were likely to retrieve object-location information. Kappa refers to the precision with which object locations were reproduced only in those trials in which participants did not guess. For better visualization, one extreme outlier in the older adult group (error ∼80°) was removed from the plot for short-term memory mean error. See the online article for the color version of this figure.
Figure 4
Figure 4. EMMs and Their 95% Confidence Intervals for Models of Interest
Note. (A) A model comparing age group effects for performance based on mixture modeling contains a three-way interaction of memory process (pT, κ), age group (young, middle, old), and task (short-term, long-term memory). (B) The same model when using age as a continuous variable. (C) The model comparing different metrics used to index memory fidelity of object-location binding contains a three-way interaction of age group, task (short-term vs. long-term memory), and method (mean localization errors without mixture modeling versus estimates of κ derived from mixture modeling). (D) When examining the trial-by-trial relationship between item and spatial fidelity, a model on target-response errors contained an interaction of task (short-term, long-term memory) and object mnemonic discrimination on a given trial (correct vs. incorrect). EMMs = estimated marginal means. See the online article for the color version of this figure.
Figure 5
Figure 5. Comparison of Age Effects on Memory Precision Measures and Neuropsychological Test Performance
Note. Trend lines are modeled with a loess function. Pearson’s r values were obtained from a bootstrapping procedure with 10,000 samples after removing extreme outliers with absolute scores larger than z = 3. Precision is expressed based on the concentration parameter κ. Abbreviations: n.s. = not significant; RAVLT = Rey auditory verbal learning test; ROCFT = Rey–Osterrieth complex figure test. See the online article for the color version of this figure.
Figure 6
Figure 6. Overview of Independent Contributions of Perceptual, Memory, and Executive Scores to Individual Differences in Memory Performance Across Tasks of Interest
Note. Trend lines represent the fit and standard error for the respective predictor as identified in multiple linear regression analyses containing age, education, executive functions, neuropsychological memory scores, and high-ambiguity object perceptual discrimination as independent variables. All variables are normalized using z-scoring. See the online article for the color version of this figure.

References

    1. Aleman A., & van’t Wout M. (2008). Repetitive transcranial magnetic stimulation over the right dorsolateral prefrontal cortex disrupts digit span task performance. Neuropsychobiology, 57(1–2), 44–48. 10.1159/000129666 - DOI - PubMed
    1. Allen M., Poggiali D., Whitaker K., Marshall T. R., van Langen J., & Kievit R. A. (2021). Raincloud plots: A multi-platform tool for robust data visualization. Wellcome Open Research, 4, Article 63. 10.12688/wellcomeopenres.15191.2 - DOI - PMC - PubMed
    1. Andersson C., Lindau M., Almkvist O., Engfeldt P., Johansson S. E., & Jönhagen M. E. (2006). Identifying patients at high and low risk of cognitive decline using Rey Auditory Verbal Learning Test among middle-aged memory clinic outpatients. Dementia and Geriatric Cognitive Disorders, 21(4), 251–259. 10.1159/000091398 - DOI - PubMed
    1. Baddeley A. (2003). Working memory: Looking back and looking forward. Nature Reviews Neuroscience, 4(10), 829–839. 10.1038/nrn1201 - DOI - PubMed
    1. Baltes P. B., & Lindenberger U. (1997). Emergence of a powerful connection between sensory and cognitive functions across the adult life span: A new window to the study of cognitive aging? Psychology and Aging, 12(1), 12–21. 10.1037/0882-7974.12.1.12 - DOI - PubMed