. 2024 Apr 30;195(1):698-712.
doi: 10.1093/plphys/kiae001.

Cynipid wasps systematically reprogram host metabolism and restructure cell walls in developing galls

Affiliations

Cynipid wasps systematically reprogram host metabolism and restructure cell walls in developing galls

Kasey Markel et al. Plant Physiol. .

Abstract

Many insects have evolved the ability to manipulate plant growth to generate extraordinary structures called galls, in which insect larva can develop while being sheltered and feeding on the plant. In particular, cynipid (Hymenoptera: Cynipidae) wasps have evolved to form morphologically complex galls and generate an astonishing array of gall shapes, colors, and sizes. However, the biochemical basis underlying these remarkable cellular and developmental transformations remains poorly understood. A key determinant in plant cellular development is cell wall deposition that dictates the physical form and physiological function of newly developing cells, tissues, and organs. However, it is unclear to what degree cell walls are restructured to initiate and support the formation of new gall tissue. Here, we characterize the molecular alterations underlying gall development using a combination of metabolomic, histological, and biochemical techniques to elucidate how valley oak (Quercus lobata) leaf cells are reprogrammed to form galls. Strikingly, gall development involves an exceptionally coordinated spatial deposition of lignin and xylan to form de novo gall vasculature. Our results highlight how cynipid wasps can radically change the metabolite profile and restructure the cell wall to enable the formation of galls, providing insights into the mechanism of gall induction and the extent to which plants can be entirely reprogrammed to form unique structures and organs.


Conflict of interest statement

Conflict of interest statement. None declared.

Figures

Figure 1.
Figure 1.
Comparison of anatomical features shared across morphologically disparate galls. A) Cone galls induced by And. kingi on the valley oak Q. lobata. B) Urchin gall induced by A. douglasii, also on Q. lobata. C) Longitudinal sections of cone (left) and urchin (right) galls, imaged with LAT. The dashed line to the urchin gall attachment point indicates attachment point is out of the plane and location is approximate. The dashed outline indicates the outline of the cone gall image. The bright object below and to the right of the black line on urchin gall is not part of the biological sample, and it is the support structure to which the sample was attached for imaging purposes.
Figure 2.
Figure 2.
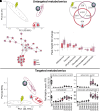
Galls are metabolically distinct from each other and leaf tissue. A) Principal component analysis of all 8,690 mass features recorded in positive mode in untargeted metabolomics, pooling all growth stages for each gall type. B) Venn diagram of the mass features present in each sample type in untargeted metabolomics. C) Molecular networking, showing one subnetwork without node labels. Each node is a mass feature, and each edge indicates a cosine score of fragmentation pattern of at least 0.7, with edge thickness corresponding to cosine score with maximum thickness at cosine = 1. Nodes are pie charts indicating relative peak heights between the 3 sample types. Full interactive networks can be viewed online at NDExbio, and additional networks can be viewed in Supplementary Fig. S4. D) Natural products classes of putative identifications of mass features in untargeted metabolomics. Each point shows the average fold-change of a particular putatively identified mass feature within the class; boxplots extend from 25th to 75th percentile of fold-change within each class, with a line at the median; whiskers extending 1.5× the interquartile range; and raw data plotted as points. E) Principal component analysis of all 209 metabolites positively identified with mass charge ratio, secondary fragmentation pattern, and RT confirmed against a library for the same instrument in positive and negative modes, removing whichever was lower to generate a nonredundant dataset. F) Metabolite data for leaf and several growth stages of each type of gall for 2 hormones and 2 sugars. MS–MS mirror plots with more precise identification information of abscisic acid, trehalose, and hexose phosphate are available in Supplementary Figs. S6 to S8, respectively. Indole-3-acetic acid peak height was too low to trigger MS–MS; identification was based on RT, m/z ratio, and other mass feature characteristics shown in Supplementary Data Set 4.
Figure 3.
Figure 3.
Lignin deposition in cone galls is spatially coordinated in a gall-specific pattern. A) Transverse section of cone gall stained with the Wiesner stain, showing 2 heavily lignified cell layers and one cell layer containing bundles of 4 to 9 highly lignified cells (arrows). Scale bar = 100 µm. B) Darkfield image of a tangential longitudinal section of gall stained with the Wiesner stain, which stains heavily lignified tissue with pink. The same 2 heavily lignified cell layers are visible, as well as the small moderately lignified bundles (arrows), now in a longitudinal section. Scale bar = 100 µm. C) Lignin concentration in leaf tissue, early-development cone galls, and mature cone galls, as determined by TGA assay. Boxplot center line indicates median, box limits indicate 25th and 75th percentiles, whiskers extend 1.5× the interquartile range, and points are raw data. Asterisks indicate P < 0.05 by Kruskal–Wallis test with Benjamini–Hochberg correction for multiple comparison; n.s. indicates P > 0.05. D) Lignin subunit S-to-G (syringyl to guaiacyl) ratio as determined by pyro-GC MS. Asterisks indicate P < 0.05 by Kruskal–Wallis test with Benjamini–Hochberg correction for multiple comparison; n.s. indicates P > 0.05.
Figure 4.
Figure 4.
The composition of gall cell walls is altered to be highly enriched in xylan. A) Concentration of 5 sugars in cell wall residue hydrolysate. Glucose potentially derived from cell wall polymers cannot be accurately measured due to starch contamination. Boxplot center line indicates median, box limits indicate 25th and 75th percentiles, whiskers extend 1.5× the interquartile range, and points are raw data. B) LM10 immunofluorescence staining signal for xylan. Left: differential interference contrast transmitted light. Center: Alexa-fluor 647 secondary antibody conjugated to LM10 primary antibody. Right: overlay. OS, outer sclerenchyma; IS, inner sclerenchyma; E, exterior; IA, interior airspace. Scale bar = 50 µm. C) Views of vascular bundles in sponge layer, from left to right: toluidine blue O, Wiesner stain, LM10, LM10. In each case, the outer sclerenchyma cells are shown on the left, the sponge layer containing vascular bundles (arrows) in the middle, and the inner sclerenchyma on the right (mostly cropped out in LM10 images due to focus and saturation issues). All scale bars = 50 µm; uncropped source images are available in Supplementary Fig. S11.

Similar articles

Cited by

References

    1. Akiyoshi DE, Klee H, Amasino RM, Nester EW, Gordon MP. T-DNA of Agrobacterium tumefaciens encodes an enzyme of cytokinin biosynthesis. Proc Natl Acad Sci U S A. 1984:81(19):5994–5998. 10.1073/pnas.81.19.5994 - DOI - PMC - PubMed
    1. Akiyoshi DE, Morris RO, Hinz R, Mischke BS, Kosuge T, Garfinkel DJ, Gordon MP, Nester EW. Cytokinin/auxin balance in crown gall tumors is regulated by specific loci in the T-DNA. Proc Natl Acad Sci U S A. 1983:80(2):407–411. 10.1073/pnas.80.2.407 - DOI - PMC - PubMed
    1. Allison SD, Schultz JC. Biochemical responses of chestnut oak to a galling cynipid. J Chem Ecol. 2005:31(1):151–166. 10.1007/s10886-005-0981-5 - DOI - PubMed
    1. Aloni R, Pradel K, Ullrich C. The three-dimensional structure of vascular tissues in Agrobacterium tumefaciens-induced crown galls and in the host stems of Ricinus communis L. Planta. 1995:196(3):597–605. 10.1007/bf00203661 - DOI
    1. Aron AT, Gentry EC, McPhail KL, Nothias L-F, Nothias-Esposito M, Bouslimani A, Petras D, Gauglitz JM, Sikora N, Vargas F, et al. . Reproducible molecular networking of untargeted mass spectrometry data using GNPS. Nat Protoc. 2020:15(6):1954–1991. 10.1038/s41596-020-0317-5 - DOI - PubMed

Publication types