. 2024 Jan 18;51(1):148.
doi: 10.1007/s11033-023-09171-0.

Differential DNA methylation and CTCF binding between the ESR1 promoter a of MCF-7 and MDA-MB-231 breast cancer cells

Affiliations

Differential DNA methylation and CTCF binding between the ESR1 promoter a of MCF-7 and MDA-MB-231 breast cancer cells

Edén Víctor Montes-de-Oca-Fuentes et al. Mol Biol Rep. .

Abstract

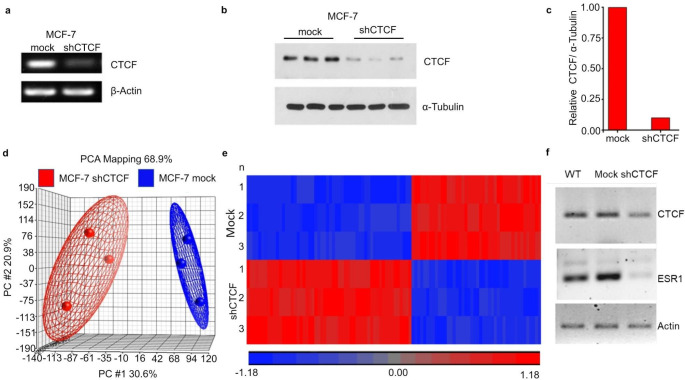
Background: ESR1 is expressed by 60-70% of breast tumours. it's a good prognosis factor and the target of hormone therapy. Optimization of ESR1 reactivation therapy is currently ongoing. Here we probe if the transcription factor CTCF plays a role in the differential expression of ESR1 in the breast cancer cell lines MCF-7 (ESR1+) and MDA-MB-231 (ESR1-).

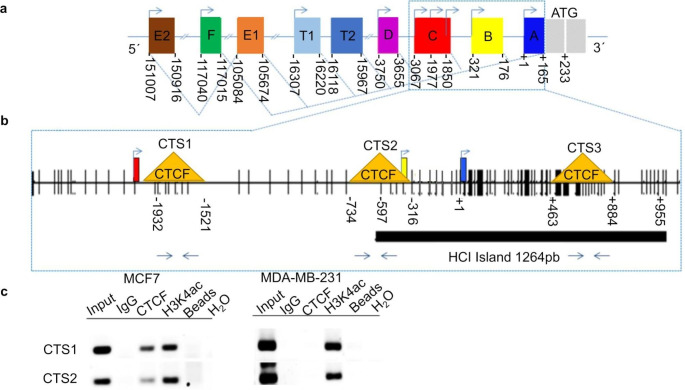
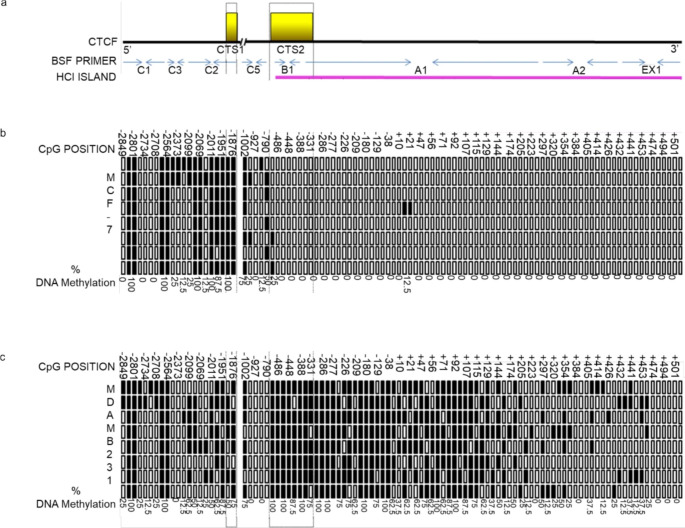
Methods and results: Knockdown of CTCF in MCF-7 resulted in decreased ESR1 gene expression. CTCF binds to the promoter of ESR1 in MCF-7 but not in MDA-MB-231 cells. CTCF ESR1 binding sites are unmethylated in MCF7 but methylated in MDA-MB-231 cells.

Conclusion: ESR1 expression in MCF7 cells is dependent on CTCF expression. CTCF can bind to specific regions of the promotor of ESR1 gene in MCF-7 cells but not in MDA-MB-231 cells, this correlates with the methylation status of these regions and could be involved in the transcriptional regulation of ESR1.

Keywords: Breast cancer; CTCF; DNA methylation; ESR1; TNBC.


Conflict of interest statement

The authors declare that they have no competing interests.

Figures

Fig. 1
Fig. 1
Expression profile of shCTCF MCF7 cells and mock transduced cells. a RT-PCR of CTCF in MCF-7 cells transduced with shCTCF or not (mock). Β-actin was used as a loading control. b Western blot of CTCF in MCF-7 cells transduced with shCTCF or not (mock). α-Tubulin was used as a loading control. c Densitometry analysis of the western blot in b. d PCA analysis to compare the intragroup and intergroup variations in the general gene expression profiles of MCF-7 cells transduced with shCTCF or not (mock). Each circle represents a biological replica. e Heat map representation of the hierarchical clustering analysis of the 78 differentially expressed genes (columns) between MCF-7 cells transduced without (mock) or with shCTCF. Each row represents an independent experiment. The 36 downregulated genes and the 42 upregulated genes between the experimental conditions are depicted in hues of blue and red, respectively. f RT-PCR of CTCF and ESR1 in wild type (WT), mock transduced or shCTCF transduced MCF7 cells. Actin was used as a loading control
Fig. 2
Fig. 2
CTCF binds to two sites in the ESR1 gene. a ESR1 genomic domains showing the TSSs of the promoters and first exon. b ESR1 genomic domains showing the putative CTSs as yellow triangles and the CpG sites as black vertical lines. The many CpG sites (~ -597 to + 955) in ESR1 show the presence of an HCI, which is susceptible to DNA methylation. c CTCF ChIP in MCF-7 and MDA-MB-231 cells at CTS1 and CTS2. H3K4ac ChIP was performed in the same loci to evaluate for heterochromatin and euchromatin
Fig. 3
Fig. 3
DNA methylation status of the ESR1 gene promoter in MCF-7 and MDA-MB-231 cells. a Schematic diagram showing as yellow rectangles, CTCF’s binding sites (CTS1 & 2); as blue arrows, the binding sites of the primers that were used to amplify these loci and as a pink rectangle, the location of the HCI. b MCF-7’s DNA methylation status, in the section of the ESR1 gene promoter where CTS1 & 2 are located. Each row represents a technical replica, and each column is a specific CpG. Methylated CpGs are filled in black and unmethylated ones are not. The % of methylation in each CpG is indicated at the bottom of each column. c Same as b but for MDA-MB-231 cells

References

    1. Alluri PG, Speers C, Chinnaiyan AM (2014) Estrogen receptor mutations and their role in Breast cancer progression. Breast Cancer Res 16:1–8. 10.1186/s13058-014-0494-7 - PMC - PubMed
    1. Sogon T, Masamura S, Hayashi S-I et al (2007) Demethylation of promoter C region of estrogen receptor alpha gene is correlated with its enhanced expression in estrogen-ablation resistant MCF-7 cells. J Steroid Biochem Mol Biol 105:106–114. 10.1016/j.jsbmb.2006.12.104 - PMC - PubMed
    1. Yu Z, Xiao Q, Zhao L et al (2015) DNA methyltransferase 1/3a overexpression in sporadic Breast cancer is associated with reduced expression of estrogen receptor-alpha/breast cancer susceptibility gene 1 and poor prognosis. Mol Carcinog 54:707–719. 10.1002/mc.22133 - PubMed
    1. Rakha EA, Pinder SE, Paish CE, Ellis IO (2004) Expression of the transcription factor CTCF in invasive Breast cancer: a candidate gene located at 16q22.1. Br J Cancer 91:1591–1596. 10.1038/sj.bjc.6602144 - PMC - PubMed
    1. Valdes-Quezada C, Arriaga-Canon C, Fonseca-Guzmán Y et al (2013) CTCF demarcates chicken embryonic α-globin gene autonomous silencing and contributes to adult stage-specific gene expression. Epigenetics 8:827–838. 10.4161/epi.25472 - PMC - PubMed