. 2024 Jan 18;134(6):e166847.
doi: 10.1172/JCI166847.

Tumor-educated Gr1+CD11b+ cells drive breast cancer metastasis via OSM/IL-6/JAK-induced cancer cell plasticity

Affiliations

Tumor-educated Gr1+CD11b+ cells drive breast cancer metastasis via OSM/IL-6/JAK-induced cancer cell plasticity

Sanam Peyvandi et al. J Clin Invest. .

Abstract

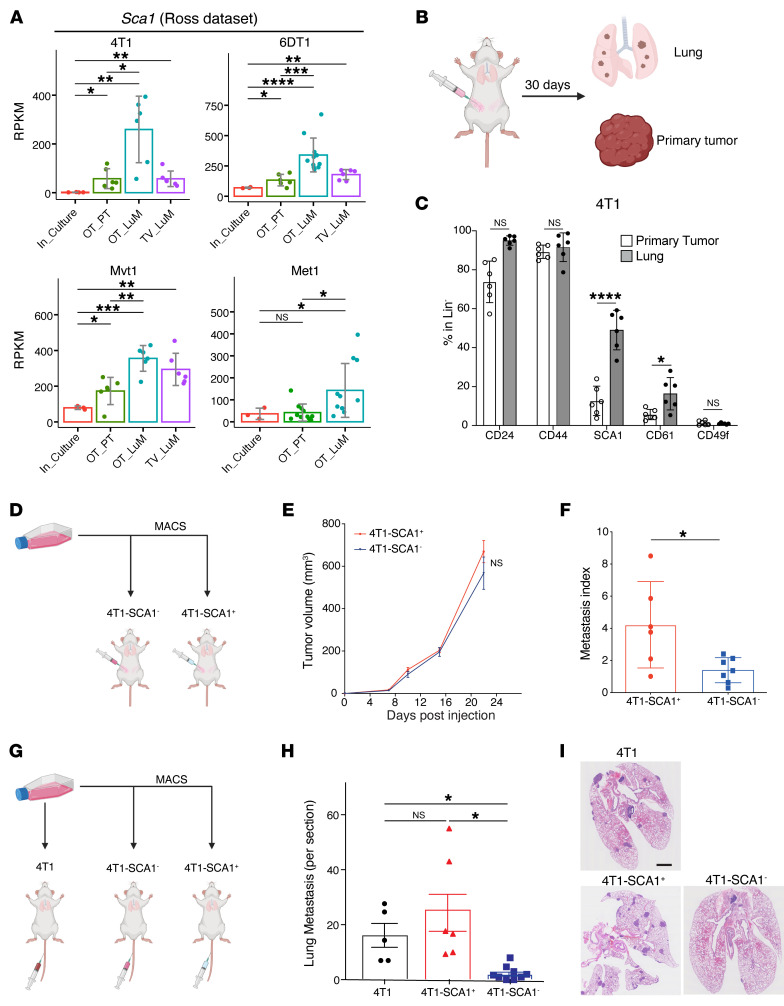
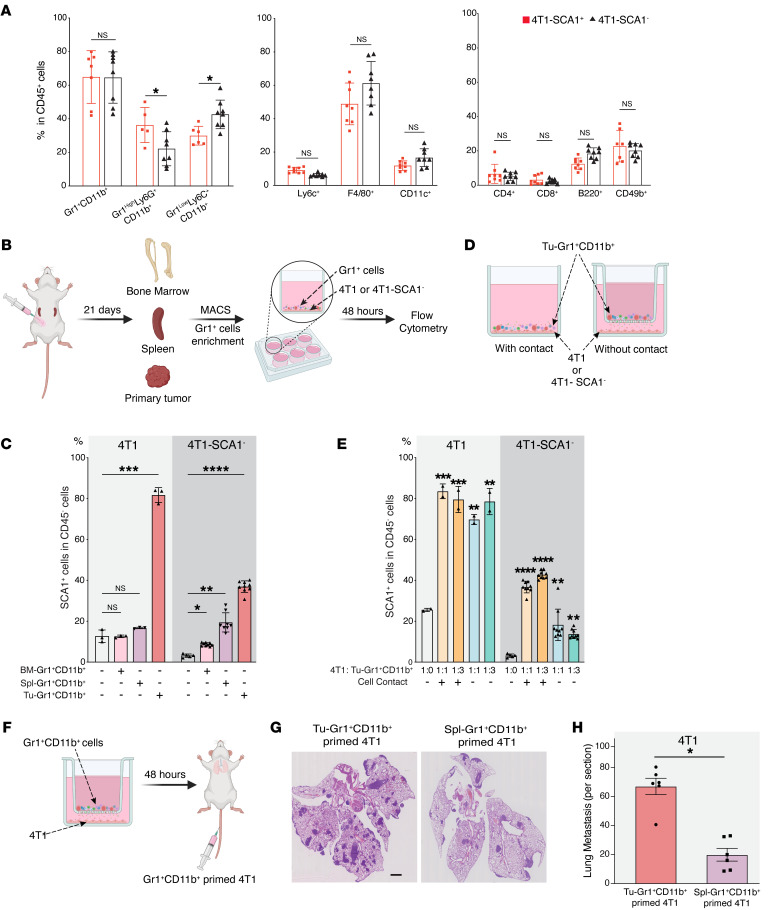
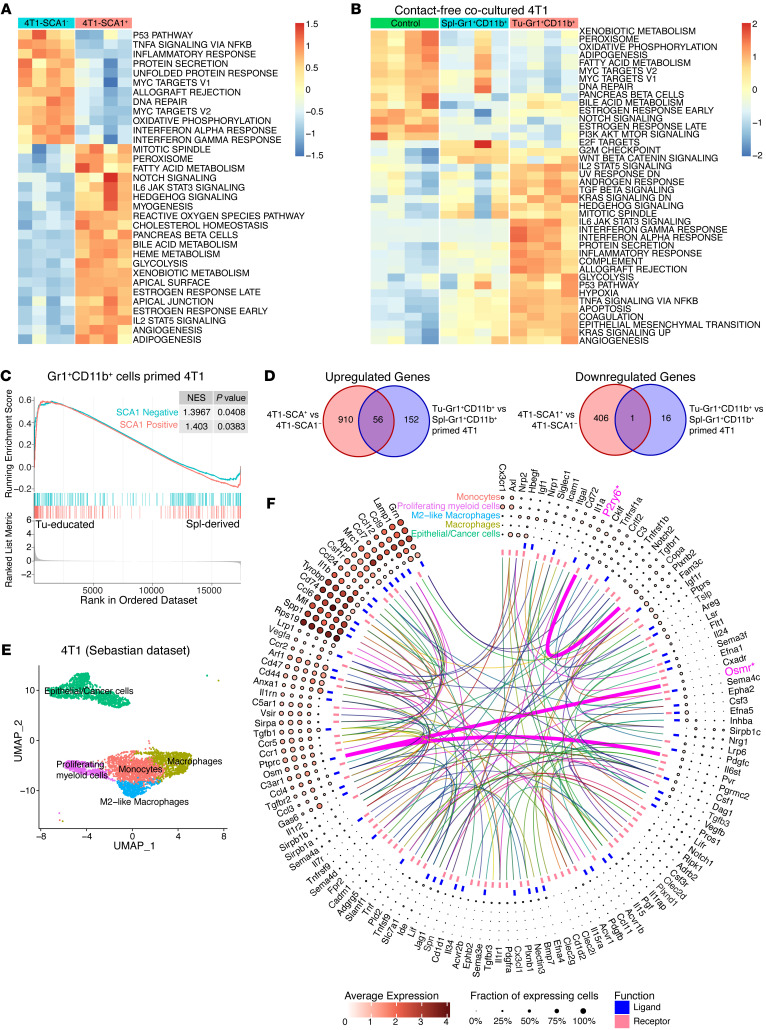
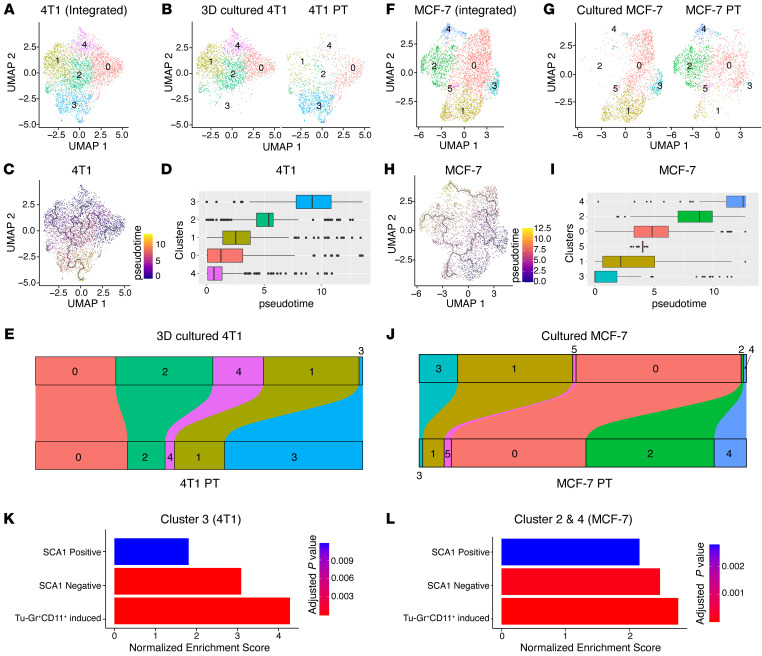
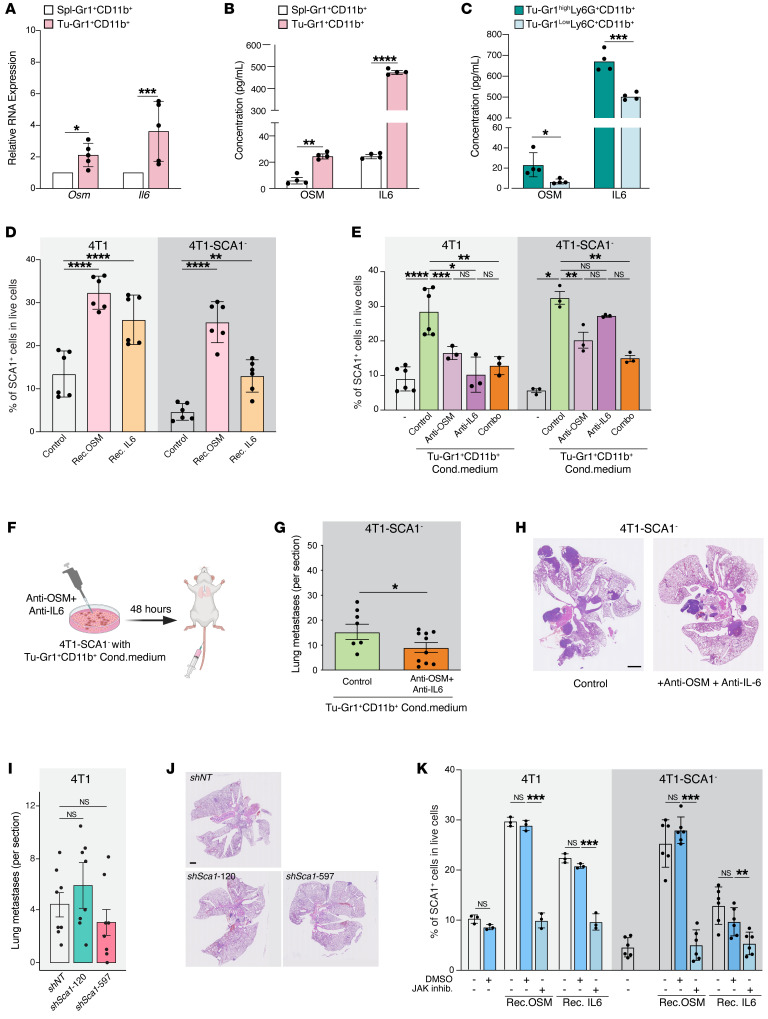
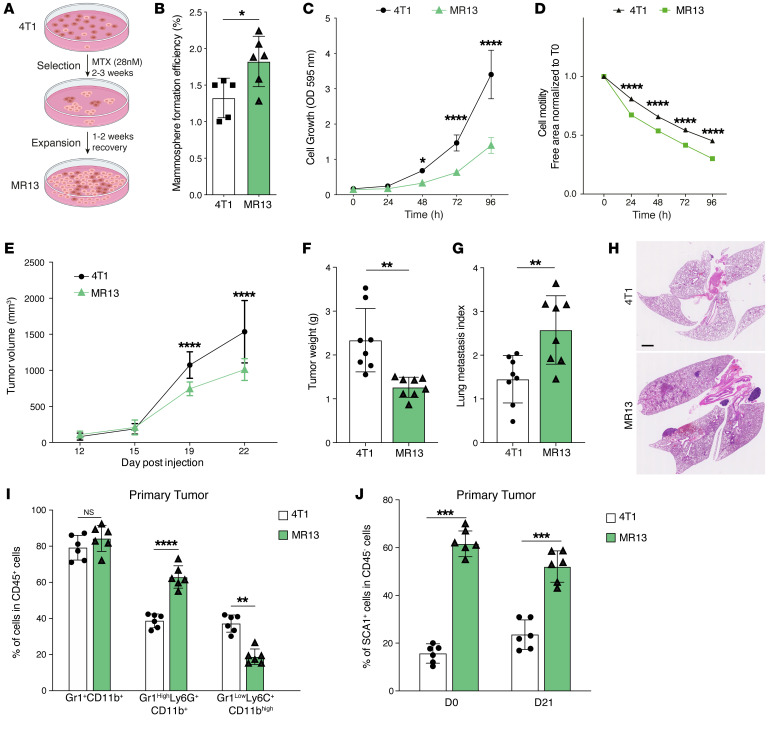
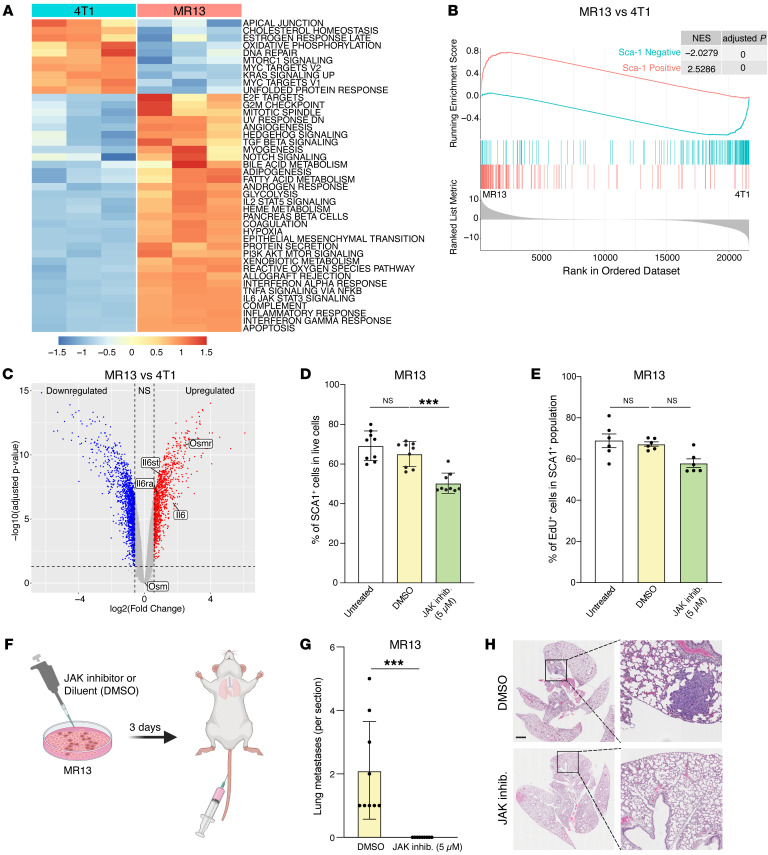
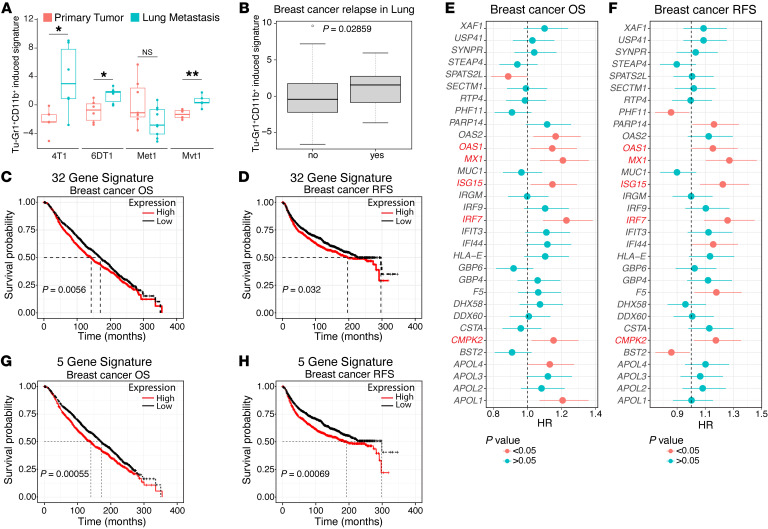
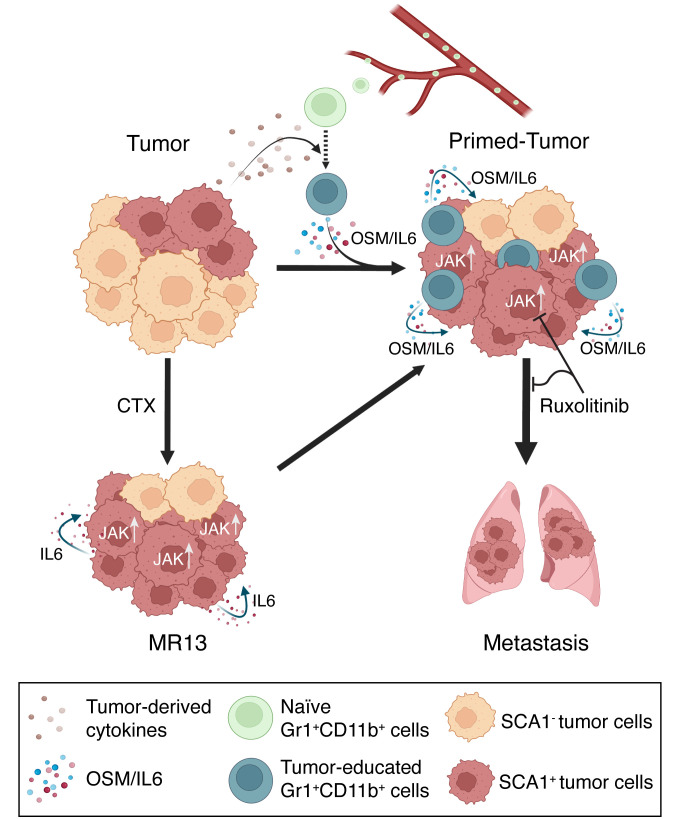
Cancer cell plasticity contributes to therapy resistance and metastasis, which represent the main causes of cancer-related death, including in breast cancer. The tumor microenvironment drives cancer cell plasticity and metastasis, and unraveling the underlying cues may provide novel strategies for managing metastatic disease. Using breast cancer experimental models and transcriptomic analyses, we show that stem cell antigen-1 positive (SCA1+) murine breast cancer cells enriched during tumor progression and metastasis had higher in vitro cancer stem cell-like properties, enhanced in vivo metastatic ability, and generated tumors rich in Gr1hiLy6G+CD11b+ cells. In turn, tumor-educated Gr1+CD11b+ (Tu-Gr1+CD11b+) cells rapidly and transiently converted low metastatic SCA1- cells into highly metastatic SCA1+ cells via secreted oncostatin M (OSM) and IL-6. JAK inhibition prevented OSM/IL-6-induced SCA1+ population enrichment, while OSM/IL-6 depletion suppressed Tu-Gr1+CD11b+-induced SCA1+ population enrichment in vitro and metastasis in vivo. Moreover, chemotherapy-selected highly metastatic 4T1 cells maintained high SCA1+ positivity through autocrine IL-6 production, and in vitro JAK inhibition blunted SCA1 positivity and metastatic capacity. Importantly, Tu-Gr1+CD11b+ cells invoked a gene signature in tumor cells predicting shorter overall survival (OS), relapse-free survival (RFS), and lung metastasis in breast cancer patients. Collectively, our data identified OSM/IL-6/JAK as a clinically relevant paracrine/autocrine axis instigating breast cancer cell plasticity and triggering metastasis.

Keywords: Breast cancer; Oncology.


Figures

Figure 1
Figure 1. SCA1+ population is enriched during in vivo metastasis across multiple breast cancer models.
(A) Sca1 mRNA expression in the metastatic murine breast cancer models 4T1, 6DT1, Mvt1, and Met1, extracted from the Ross data set (39). Analyzed samples consist of cultured cells (In_Culture), orthotopic injected PTs (OP_PT), spontaneous lung metastases (OP_LuM), and lung metastases induced by i.v. injection (TV_LuM). Data are represented as the mean of reads per kilobase of transcript per million mapped reads (RPKM) ± SD. (B) Experimental setup for in vivo experimental validation. 4T1 tumor cells were orthotopically injected into the fourth mammary fat pad. Thirty days later, cells from PTs and lungs were isolated to examine CSC marker expression by flow cytometry. (C) Frequency of CSC marker expression in PTs and lung metastases. Results are shown as percentages of CD24-, CD44-, SCA1-, CD61-, and CD49f-positive cells gated in lineage-negative cells (CD45CD31TER119). n = 6/group. (DF) Experimental setup (D) of the in vivo experiment to assess tumor growth (E) and lung metastatic ability (metastatic index) (F) of 4T1-SCA1+ and 4T1-SCA1 populations isolated from tumors induced by parental 4T1 cells orthotopically injected into the fourth mammary fat pads. Metastases are assessed 21 days after tumor cell injection. n = 8/group. (GI) Experimental setup (G) of in vivo experiment to assess lung colonization capacity upon tail-vein injection of sorted parental 4T1, 4T1-SCA1+, and 4T1-SCA1 cells. Lung metastatic nodule numbers (H) and representative images (I) of lungs from mice 10 days after injection. n = 5–6/group. Scale bar: 1 mm. Data are represented as means ± SEM and are representative of 3 independent experiments for C, E, F, and H. P values were calculated using unpaired, 2-tailed Student’s t test with Holm’s correction (A); unpaired 2-tailed Student’s t test (C and F); 2-way ANOVA with Tukey’s multiple-comparison test (E); or 1-way ANOVA with Tukey’s multiple-comparison test (H). *P < 0.05; **P < 0.01; ***P < 0.001; ****P < 0.0001.
Figure 2
Figure 2. SCA1 expression is modulated by TME.
(A) Frequency of different immune cell populations in PTs of mice orthotopically injected with 4T1-SCA1+ and 4T1-SCA1 cells 21 days after injection. Populations are determined in CD45-positive, viable cells. n = 8 mice/group. (B and C) Schematic (B) showing experimental design for isolating Gr1+ cells from different sites of tumor-bearing mice. Twenty-one days after tumor implantation, Gr1+ cells were isolated from bone marrow (BM-Gr1+CD11b+), spleen (Spl- Gr1+CD11b+), or PT (Tu-Gr1+CD11b+) and cocultured for 48 hours with parental 4T1 or sorted 4T1-SCA1 cells in vitro. SCA1 expression in tumor cells was examined by flow cytometry (C). Coculture conditions are indicated in bar graph. n = 3/group for 4T1; n = 5–9/group for 4T1-SCA1. (D and E) Schematic of experimental coculture setup (E). MACS-enriched Gr1+ cells were cocultured with 4T1 or sorted 4T1-SCA1 cells with or without Transwell inserts of 0.4 μm pore size. Cells were seeded in bottom well and Gr1+CD11b+ cells in upper part of insert. After 48 hours, tumor cells were examined for SCA1 expression by FACS (E). Coculture conditions are indicated in bar graph. Ratio of tumor cells and Tu-Gr1+CD11b+ varied from 1:1 to 1:3. n = 3/group for 4T1; n = 5–9/group for 4T1-SCA1. (FH) Schematic of experimental metastasis setup for evaluation of metastatic capacity of Gr1+CD11b+-educated 4T1 cells in vivo (F). 4T1 tumor cells were primed with Tu-Gr1+CD11b+ or Spl-Gr1+CD11b+ in vitro without cell-cell contact for 48 hours and injected into tail veins. Lung metastases were quantified 10 days after injection (G). Representative H&E staining images of lung sections are shown (H). Scale bar: 1 mm. n = 6 mice/group. Data are represented as means ± SEM and are representative of 3 independent experiments. P values were calculated using unpaired 2-tailed Student’s t test (A and H) or 1-way ANOVA with Dunnett’s multiple-comparison test (C and E). *P < 0.05; **P < 0.01; ***P < 0.001; ****P < 0.0001.
Figure 3
Figure 3. Transcriptomic analysis of SCA1+ tumor cells.
(A) Heatmap showing the signature score of the hallmark pathways analysis in 4T1-SCA1+ and 4T1-SCA1 populations sorted from parental 4T1 cells. The colors code the expression levels relative to average levels, as indicated at the bottom. (B) Heatmap showing the signature score of the hallmarks pathway analysis in parental 4T1, Spl-Gr1+CD11b+–primed 4T1, and Tu-Gr1+CD11b+–primed 4T1 cells. The colors code the expression levels relative to average levels, as indicated at the bottom. (C) GSEA comparing the Tu-Gr1+CD11b+– and Spl-Gr1+CD11b+–primed 4T1 cells. GSEA shows positive correlations of both SCA1-positive and SCA1-negative signatures. NES, normalized enrichment score. (D) Venn diagrams showing that 56 upregulated genes and 1 downregulated gene are shared between inherent and Tu-Gr1+CD11b+–induced SCA1+ population in 4T1 tumor cells. (E) UMAP plot showing clusters of cancer cells and myeloid cell populations in orthotopically grown 4T1-derived PTs extracted from the Sebastian data set (see Methods for details). (F) Circos diagram showing the predicted potential interactions between cancer cells and different myeloid cell populations determined by CellPhoneDB (see Supplemental Methods for details) based on the Sebastian data set. Only Osmr and P2ry6 are shared with the common 56 gene list shown in panel D.
Figure 4
Figure 4. Transformation dynamics of tumor cell populations induced by the TME.
(A) UMAP plots showing 4T1 clusters based on integrated scRNA-Seq data from 4T1 cells in 3D culture or in PT. (B) Distribution of specific clusters in 4T1 cells in 3D culture or PT. (C and D) UMAP plot (C) and box plot (D) showing the clusters in pseudo-time course during the transformation of 4T1 cells from ex vivo culture to in vivo. (E) Sankey diagram showing the dynamic of each cluster during the transformation of 4T1 cells from ex vivo culture to in vivo. Cluster 3 was largely expanded in vivo. (F) UMAP plots showing MCF-7 clusters based on integrated scRNA-Seq data from MCF-7 cells in culture or in PT. (G) Distribution of the specific clusters in cultured MCF-7 cells or MCF-7 PTs. (HI) UMAP plot (H) and box plot (I) showing the clusters in pseudo-time course during the transformation of MCF-7 cells from ex vivo culture to in vivo. (J) Sankey diagram showing the dynamic of each cluster during the transformation of MCF-7 cells from ex vivo culture to in vivo. Clusters 2 and 4 were largely expanded in vivo. (K and L) GSEA analysis of SCA1-positive signature, SCA1-negative signature, and Tu-Gr1+CD11b+–induced signature of cells in cluster 3 in 4T1 data (K) and in cluster 2 and cluster 4 in MCF-7 data (L). Analyses are based on publicly available data (4T1: GEO GSM4812003 and GSM3502134; MCF-7: GEO GSM4681765 and GSM5904917).
Figure 5
Figure 5. SCA1+ population is modulated by OSM/IL-6/JAK pathway.
(A) Relative Osm and Il6 mRNA expression in Tu-Gr1+CD11b+ and Spl-Gr1+CD11b+ cells. n = 4–5/group. (B and C) OSM and IL-6 protein quantification in supernatant of (B) Tu-Gr1+CD11b+ and Spl-Gr1+CD11b+ (C) and Tu-Gr1hiLy6G+CD11b+ and Gr1loLy6GCD11b+ cells. n = 4/group. (D) Fraction of SCA1+ cells of parental 4T1 or sorted 4T1-SCA1 cells upon exposure to OSM or IL-6 (10 ng/ml 48 hours). n = 6/group. (E) Effect of inhibition of OSM and IL-6 in Tu-Gr1+CD11b+ conditioned medium on SCA1 expression in parental 4T1 or sorted 4T1-SCA1 cells after 48 hours treatment. n = 3–6/group. (F) Experimental design for examining lung metastatic capacity of IL-6/OSM. 4T1-SCA1 cells were primed by Tu-Gr1+CD11b+ conditioned medium with dual depletion of OSM/IL-6 depleted or control, in vitro for 48 hours and then injected into tail vein. Lungs were examined for metastasis 10 days later. (G and H) Quantification of lung metastases (G) and representative H&E staining images of lung sections (H). n = 8–10/group. Scale bar: 1 mm. (I and J) Quantification of lung metastases in mice injected with 4T1 control and 4T1 silenced for Sca1 (shSca1-120 and shSca1-597) (I). n = 8/group. Representative H&E stained lung sections (J). Scale bar: 1 mm. (K) SCA1+ population stimulation in cultured parental 4T1 or sorted 4T1-SCA1 cells by recombinant OSM or IL-6 (10 ng/ml, 48 hours) in vitro in presence of ruxolitinib (5 μM) or DMSO control. n = 3–6/group. Data are represented as means ± SEM from 3 independent experiments. P values were calculated using unpaired 2-tailed Student’s t test (AC and G); unpaired 2-tailed Student’s t test with Holm’s correction (I); 1-way ANOVA with Dunnett’s multiple-comparison test (D and K); or 1-way ANOVA with Tukey’s multiple-comparison test (E). *P < 0.05; **P < 0.01; ***P < 0.001; ****P < 0.0001.
Figure 6
Figure 6. Long-term chemotherapy treatment of 4T1 cells induces a stable SCA1+ population (MR13) with higher metastatic capacity and CSC features.
(A) Schematic of the experimental design to obtain chemotherapy-resistant MR13 cells from 4T1. (B) Quantification of the mammosphere-forming efficiency of 4T1 and MR13 tumor cells. n = 5–6/group. (C) Cell proliferation curves of 4T1 and MR13 tumor cells in vitro determined by the CV assay. Results are represented as mean of OD. n = 8/group. (D) Cell motility of 4T1 and MR13 tumor cells determined by the scratch wound healing assay. n = 5–6/group. Results are represented as cell-free area relative to the initial wound area from 3 independent experiments. (E) Growth curves of PTs in BALB/c mice orthotopically injected with 4T1 and MR13 tumor cells. n = 10–11/group. (F) Tumor weight of 4T1 and MR13 tumors recovered from BALB/c mice at day 22 after injection. n = 8/group. (G and H) Lung metastasis index 23 days after injection. The number of metastatic nodules is determined by H&E staining and normalized based on the PT weight (G). Representative H&E staining images of lung sections are shown (H). Scale bar: 1 mm. n = 8/group. (I) Frequency of different CD11b+ myeloid cells subpopulations in PTs from MR13- and 4T1-injected mice determined by flow cytometry 21 days after injection. n = 6/group. Subpopulations are determined in CD45-positive, viable cell population. (J) Percentage of SCA1+ tumor cells at time of injections (D0) of 4T1 and MR13 cells and in PTs recovered at day 21 (D21). SCA1 expression is determined in CD45-negative, viable cell population. n = 6/group. Data are represented as means ± SEM and are representative of 3 independent experiments. P values were calculated using unpaired, 2-tailed Student’s t test (B, F, G, I and J) or 2-way ANOVA with Tukey’s multiple comparison test for (CE). *P < 0.05; **P < 0.01; ***P < 0.001; ****P < 0.0001.
Figure 7
Figure 7. IL-6/JAK pathway promotes SCA1+ persistence and metastatic capacity in chemotherapy-resistant MR13 tumor cells.
(A and B) Gene expression analysis of parental 4T1 and chemotherapy-resistant MR13 cells. Heatmap represents the signature score of the hallmark pathways analysis. Results from 3 biological replicates are shown (A). GSEA results show that MR13 cells are positively enriched for the SCA1-positive signature and negatively enriched for the SCA1-negative signature (B). (C) Volcano plot showing the differential expression of Osm, Osmr, Il6st, Il6, and Il6ra mRNA in MR13 versus 4T1 tumor cells. (D) Fraction of SCA1+ population in MR13 tumor cells treated for 72 hours with the JAK inhibitor ruxolitinib (5 μM) relative to vehicle control (DMSO) treatment. n = 9/group. (E) Percentage of EdU-positive in SCA1+ population of MR13 cells after treatment with JAK inhibitor ruxolitinib or DMSO control for 72 hours. n = 6/group. (F) Schematic of the experimental design for testing the effect of ruxolitinib on MR13 lung metastatic capacity shown in GH. MR13 tumor cells were treated with ruxolitinib (5 μM) or DMSO in vitro for 72 hours and then injected into the mouse tail vein. Lungs were examined for metastasis 10 days after tumor cell injection. (G and H) Quantification of lung metastases in mice injected i.v. with MR13 treated in vitro with ruxolitinib (5 μM) or DMSO (G). Representative images of H&E staining are shown (H). n = 8/group. Scale bar: 1 mm. Data are represented as means ± SEM and are representative of 3 independent experiments for D, E, and G. P values were calculated using 1-way ANOVA with Dunnett’s multiple-comparison test (D and E) or unpaired 2-tailed Student’s t test (G). ***P < 0.001.
Figure 8
Figure 8. Tu-Gr1+CD11b+–induced tumor cell signature predicts worse outcome in breast cancer patients.
(A) Box plot showing the expression of Tu-Gr1+CD11b+–induced 4T1 cell signature in PT and lung metastasis in the 4T1, 6DT1, Mvt1, and Met1 murine metastatic breast cancer models, extracted from the Ross data set (39). The box extended from 25th to 75th percentile, with the median indicated as a line within the box. The whiskers shown are 1.5 times interquartile ranges. P values were calculated using unpaired 2-tailed Student’s t test. (B) Expression of human orthologue of Tu-Gr1+CD11b+–induced signature in breast cancer patients with (yes) or without (no) metastatic relapse to the lung in the NKI295 cohort (58). (C and D) Kaplan-Meier curves showing OS (C) or RFS (D) for breast cancer patients according to high or low expression of an orthologue 32 gene signature, based on the Tu-Gr1+CD11b+–induced 4T1 cell signature in the METABRIC data sets (59). (E and F) Forest plots showing Cox’s proportional hazard regression (HR) for OS (E) and RFS (F) of the individual 32 orthologues of the Tu-Gr1+CD11b+–induced signature, based on gene expression in tumor samples of the METABRIC data set. (G and H) Kaplan-Meier curves showing OS (G) and RFS (H) according to the minimal 5-gene orthologue gene signature expression in the METABRIC data sets. P values were calculated using unpaired 2-tailed Student’s t test (A and B) or log-rank test (C, D, G and H). *P < 0.05; **P < 0.01.
Figure 9
Figure 9. Schematic of the proposed model for cancer cell plasticity modulated by OSM/IL-6 during tumor progression and chemotherapy.
Parental tumor cells contain a small fraction of highly metastatic SCA1+ population. During tumor progression, naive Gr1+CD11b+ cells are recruited to the TME and educated into Tu-Gr1+CD11b+ by tumor-derived factors. In turn, Tu-Gr1+CD11b+ cells secrete OSM and IL-6 to convert the SCA1 population into a highly metastatic SCA1+ population. Chemotherapy (CTX) enriches for SCA1+ population due to its intrinsic resistance against cytotoxic treatment. Resistant cells express IL-6 to maintain the high portion of SCA1+ population with high metastatic ability. JAK inhibitor ruxolitinib suppresses the conversion to SCA1+ population and metastasis.

References

    1. Fares J, et al. Molecular principles of metastasis: a hallmark of cancer revisited. Signal Transduct Target Ther. 2020;5(1):28. doi: 10.1038/s41392-020-0134-x. - DOI - PMC - PubMed
    1. Valdés-Mora F, et al. Single-cell transcriptomics reveals involution mimicry during the specification of the basal breast cancer subtype. Cell Rep. 2021;35(2):108945. doi: 10.1016/j.celrep.2021.108945. - DOI - PubMed
    1. Yang D, et al. Lineage tracing reveals the phylodynamics, plasticity, and paths of tumor evolution. Cell. 2022;185(11):1905–1923. doi: 10.1016/j.cell.2022.04.015. - DOI - PMC - PubMed
    1. Torborg SR, et al. Cellular and molecular mechanisms of plasticity in cancer. Trends Cancer. 2022;8(9):735–746. doi: 10.1016/j.trecan.2022.04.007. - DOI - PMC - PubMed
    1. Baccelli I, Trumpp A. The evolving concept of cancer and metastasis stem cells. J Cell Biol. 2012;198(3):281–293. doi: 10.1083/jcb.201202014. - DOI - PMC - PubMed