Large-scale gene expression changes in APP/PSEN1 and GFAP mutation models exhibit high congruence with Alzheimer's disease
- PMID: 38236817
- PMCID: PMC10796008
- DOI: 10.1371/journal.pone.0291995
Large-scale gene expression changes in APP/PSEN1 and GFAP mutation models exhibit high congruence with Alzheimer's disease
Abstract
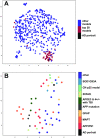
Alzheimer's disease (AD) is a complex neurodegenerative disorder with both genetic and non-genetic causes. Animal research models are available for a multitude of diseases and conditions affecting the central nervous system (CNS), and large-scale CNS gene expression data exist for many of these. Although there are several models specifically for AD, each recapitulates different aspects of the human disease. In this study we evaluate over 500 animal models to identify those with CNS gene expression patterns matching human AD datasets. Approaches included a hypergeometric based scoring system that rewards congruent gene expression patterns but penalizes discordant gene expression patterns. The top two models identified were APP/PS1 transgenic mice expressing mutant APP and PSEN1, and mice carrying a GFAP mutation that is causative of Alexander disease, a primary disorder of astrocytes in the CNS. The APP/PS1 and GFAP models both matched over 500 genes moving in the same direction as in human AD, and both had elevated GFAP expression and were highly congruent with one another. Also scoring highly were the 5XFAD model (with five mutations in APP and PSEN1) and mice carrying CK-p25, APP, and MAPT mutations. Animals with the APOE3 and 4 mutations combined with traumatic brain injury ranked highly. Bulbectomized rats scored high, suggesting anosmia could be causative of AD-like gene expression. Other matching models included the SOD1G93A strain and knockouts for SNORD116 (Prader-Willi mutation), GRID2, INSM1, XBP1, and CSTB. Many top models demonstrated increased expression of GFAP, and results were similar across multiple human AD datasets. Heatmap and Uniform Manifold Approximation Plot results were consistent with hypergeometric ranking. Finally, some gene manipulation models, including for TYROBP and ATG7, were identified with reversed AD patterns, suggesting possible neuroprotective effects. This study provides insight for the pathobiology of AD and the potential utility of available animal models.
Copyright: © 2024 Gammie et al. This is an open access article distributed under the terms of the Creative Commons Attribution License, which permits unrestricted use, distribution, and reproduction in any medium, provided the original author and source are credited.
Conflict of interest statement
The authors declare no competing interests.
Figures
Similar articles
-
Presenilin 1 hemizygosity has no overt deleterious phenotypic outcomes in sheep: Potential implications for therapeutic targets in Alzheimer's disease.Neurobiol Aging. 2025 Aug;152:25-33. doi: 10.1016/j.neurobiolaging.2025.04.006. Epub 2025 Apr 25. Neurobiol Aging. 2025. PMID: 40315540
-
Disrupted Maturation of Prefrontal Layer 5 Neuronal Circuits in an Alzheimer's Mouse Model of Amyloid Deposition.Neurosci Bull. 2023 Jun;39(6):881-892. doi: 10.1007/s12264-022-00951-5. Epub 2022 Sep 24. Neurosci Bull. 2023. PMID: 36152121 Free PMC article.
-
γ-Secretase activity, clinical features, and biomarkers of autosomal dominant Alzheimer's disease: cross-sectional and longitudinal analysis of the Dominantly Inherited Alzheimer Network observational study (DIAN-OBS).Lancet Neurol. 2024 Sep;23(9):913-924. doi: 10.1016/S1474-4422(24)00236-9. Epub 2024 Jul 26. Lancet Neurol. 2024. PMID: 39074479
-
Pharmacotherapies for sleep disturbances in dementia.Cochrane Database Syst Rev. 2016 Nov 16;11(11):CD009178. doi: 10.1002/14651858.CD009178.pub3. Cochrane Database Syst Rev. 2016. Update in: Cochrane Database Syst Rev. 2020 Nov 15;11:CD009178. doi: 10.1002/14651858.CD009178.pub4. PMID: 27851868 Free PMC article. Updated.
-
The Black Book of Psychotropic Dosing and Monitoring.Psychopharmacol Bull. 2024 Jul 8;54(3):8-59. Psychopharmacol Bull. 2024. PMID: 38993656 Free PMC article. Review.
Cited by
-
GFAP mutation and astrocyte dysfunction lead to a neurodegenerative profile with impaired synaptic plasticity and cognitive deficits in a rat model of Alexander disease.eNeuro. 2025 Mar 10;12(3):ENEURO.0504-24.2025. doi: 10.1523/ENEURO.0504-24.2025. Online ahead of print. eNeuro. 2025. PMID: 40064497 Free PMC article.
-
GeneSetCart: assembling, augmenting, combining, visualizing, and analyzing gene sets.Gigascience. 2025 Jan 6;14:giaf025. doi: 10.1093/gigascience/giaf025. Gigascience. 2025. PMID: 40208796 Free PMC article.
-
Plasma concentrations of glial fibrillary acidic protein, neurofilament light, and tau in Alexander disease.Neurol Sci. 2024 Sep;45(9):4513-4518. doi: 10.1007/s10072-024-07495-8. Epub 2024 Apr 1. Neurol Sci. 2024. PMID: 38558318 Free PMC article.
-
Extracellular Competing Endogenous RNA Networks Reveal Key Regulators of Early Amyloid Pathology Propagation in Alzheimer's Disease.Int J Mol Sci. 2025 Apr 9;26(8):3544. doi: 10.3390/ijms26083544. Int J Mol Sci. 2025. PMID: 40332030 Free PMC article.
-
Footprints in the Sno: investigating the cellular and molecular mechanisms of SNORD116.Open Biol. 2025 Mar;15(3):240371. doi: 10.1098/rsob.240371. Epub 2025 Mar 19. Open Biol. 2025. PMID: 40101781 Free PMC article. Review.
References
-
- Wang M, Roussos P, McKenzie A, Zhou X, Kajiwara Y, Brennand KJ, et al.. Integrative network analysis of nineteen brain regions identifies molecular signatures and networks underlying selective regional vulnerability to Alzheimer’s disease. Genome Med. 2016;8(1):104. Epub 2016/11/02. doi: 10.1186/s13073-016-0355-3 . - DOI - PMC - PubMed
MeSH terms
Substances
Grants and funding
- P30 AG072975/AG/NIA NIH HHS/United States
- U01 AG046152/AG/NIA NIH HHS/United States
- RF1 AG057440/AG/NIA NIH HHS/United States
- U01 AG061356/AG/NIA NIH HHS/United States
- R01 NS110719/NS/NINDS NIH HHS/United States
- R01 NS080820/NS/NINDS NIH HHS/United States
- U01 AG046139/AG/NIA NIH HHS/United States
- R21 NS093482/NS/NINDS NIH HHS/United States
- P01 AG017216/AG/NIA NIH HHS/United States
- R01 AG018023/AG/NIA NIH HHS/United States
- P50 AG016574/AG/NIA NIH HHS/United States
- P01 HD076892/HD/NICHD NIH HHS/United States
- U01 AG046170/AG/NIA NIH HHS/United States
- U24 AG061340/AG/NIA NIH HHS/United States
- R01 AG017917/AG/NIA NIH HHS/United States
- P30 AG072980/AG/NIA NIH HHS/United States
- P30 AG010161/AG/NIA NIH HHS/United States
- R01 NS117469/NS/NINDS NIH HHS/United States
- P50 HD105353/HD/NICHD NIH HHS/United States
- R01 AG032990/AG/NIA NIH HHS/United States
- P01 AG003949/AG/NIA NIH HHS/United States
- U24 NS072026/NS/NINDS NIH HHS/United States
- P30 AG019610/AG/NIA NIH HHS/United States
- U54 HD090256/HD/NICHD NIH HHS/United States
- P50 AG025711/AG/NIA NIH HHS/United States
- U01 AG006786/AG/NIA NIH HHS/United States
- R01 AG036836/AG/NIA NIH HHS/United States
- R01 AG015819/AG/NIA NIH HHS/United States
LinkOut - more resources
Full Text Sources
Medical
Molecular Biology Databases
Research Materials
Miscellaneous

