

Modelling disease mitigation at mass gatherings: A case study of COVID-19 at the 2022 FIFA World Cup
- PMID: 38236838
- PMCID: PMC10796029
- DOI: 10.1371/journal.pcbi.1011018
Modelling disease mitigation at mass gatherings: A case study of COVID-19 at the 2022 FIFA World Cup
Abstract
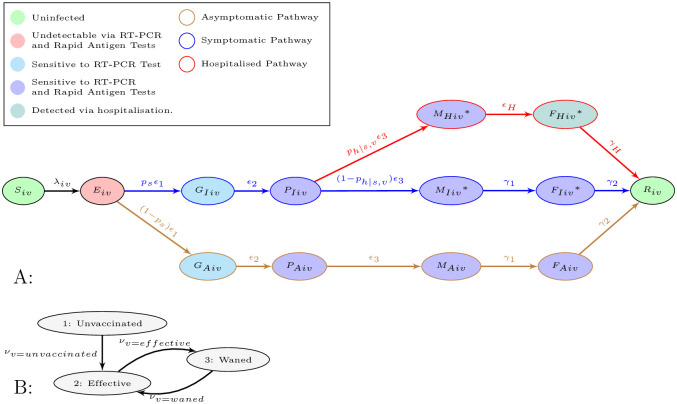
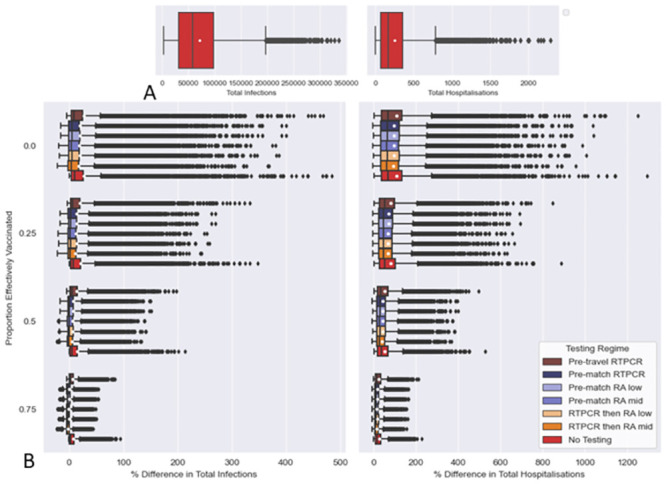
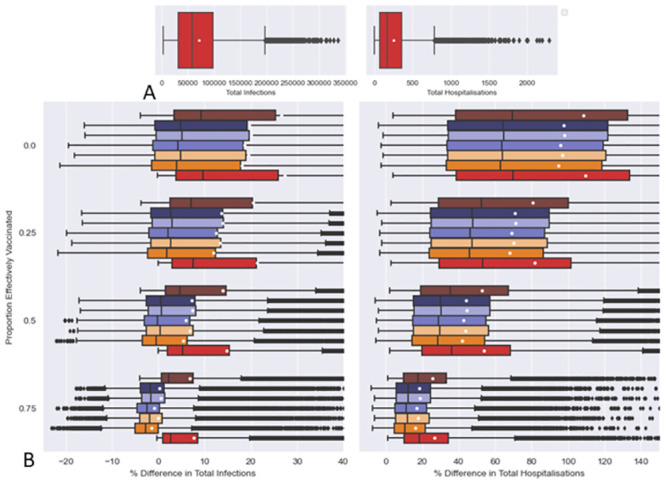
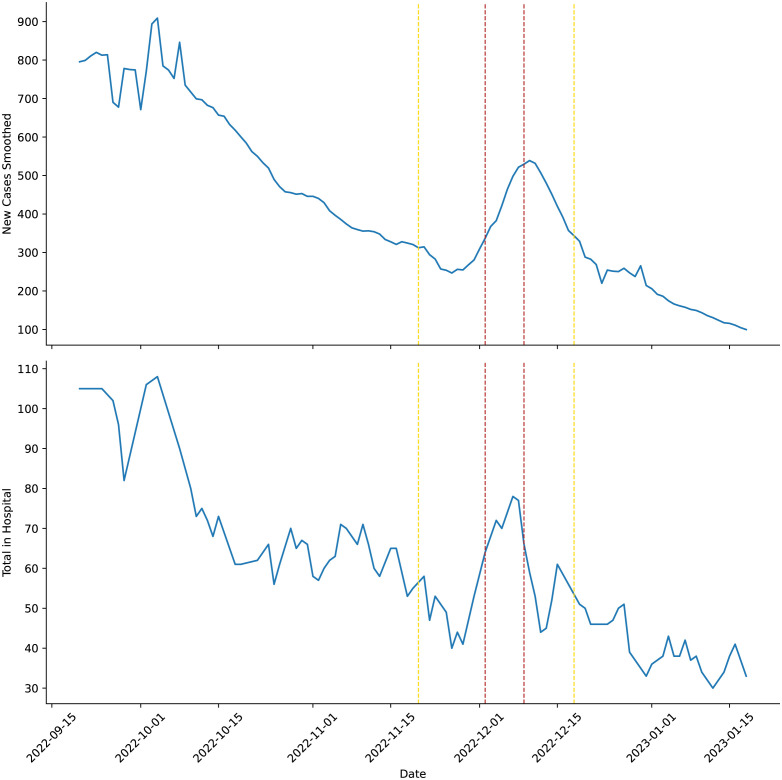
The 2022 FIFA World Cup was the first major multi-continental sporting Mass Gathering Event (MGE) of the post COVID-19 era to allow foreign spectators. Such large-scale MGEs can potentially lead to outbreaks of infectious disease and contribute to the global dissemination of such pathogens. Here we adapt previous work and create a generalisable model framework for assessing the use of disease control strategies at such events, in terms of reducing infections and hospitalisations. This framework utilises a combination of meta-populations based on clusters of people and their vaccination status, Ordinary Differential Equation integration between fixed time events, and Latin Hypercube sampling. We use the FIFA 2022 World Cup as a case study for this framework (modelling each match as independent 7 day MGEs). Pre-travel screenings of visitors were found to have little effect in reducing COVID-19 infections and hospitalisations. With pre-match screenings of spectators and match staff being more effective. Rapid Antigen (RA) screenings 0.5 days before match day performed similarly to RT-PCR screenings 1.5 days before match day. Combinations of pre-travel and pre-match testing led to improvements. However, a policy of ensuring that all visitors had a COVID-19 vaccination (second or booster dose) within a few months before departure proved to be much more efficacious. The State of Qatar abandoned all COVID-19 related travel testing and vaccination requirements over the period of the World Cup. Our work suggests that the State of Qatar may have been correct in abandoning the pre-travel testing of visitors. However, there was a spike in COVID-19 cases and hospitalisations within Qatar over the World Cup. Given our findings and the spike in cases, we suggest a policy requiring visitors to have had a recent COVID-19 vaccination should have been in place to reduce cases and hospitalisations.
Copyright: © 2024 Grunnill et al. This is an open access article distributed under the terms of the Creative Commons Attribution License, which permits unrestricted use, distribution, and reproduction in any medium, provided the original author and source are credited.
Conflict of interest statement
I have read the journal’s policy and the authors of this manuscript have the following competing interests: LC is a Sanofi employee and may hold stock options within Sanofi. EWT is a Sanofi employee and may hold stock options within Sanofi. AA is a Sanofi employee and may hold stock options within Sanofi.
Figures
Similar articles
-
Large-scale sporting events during the COVID-19 pandemic: insights from the FIFA World Cup 2022 in Qatar with an analysis of patterns of COVID-19 metrics.Biol Sport. 2023 Oct;40(4):1249-1258. doi: 10.5114/biolsport.2023.131109. Epub 2023 Sep 7. Biol Sport. 2023. PMID: 37867752 Free PMC article.
-
Travelers to the FIFA world cup 2014 in Brazil: Health risks related to mass gatherings/sports events and implications for the Summer Olympic Games in Rio de Janeiro in 2016.Travel Med Infect Dis. 2016 May-Jun;14(3):212-20. doi: 10.1016/j.tmaid.2016.05.014. Epub 2016 May 26. Travel Med Infect Dis. 2016. PMID: 27238909
-
A scoping review of the risk factors and strategies followed for the prevention of COVID-19 and other infectious diseases during sports mass gatherings: Recommendations for future FIFA World Cups.Front Public Health. 2023 Jan 16;10:1078834. doi: 10.3389/fpubh.2022.1078834. eCollection 2022. Front Public Health. 2023. PMID: 36726622 Free PMC article.
-
FIFA Arab Cup tournament with full capacity of spectators during the COVID-19 pandemic: a cross-sectional study.Sci Med Footb. 2023 Nov;7(4):337-346. doi: 10.1080/24733938.2022.2110276. Epub 2022 Aug 22. Sci Med Footb. 2023. PMID: 35950342
-
The 2014 FIFA World Cup: communicable disease risks and advice for visitors to Brazil--a review from the Latin American Society for Travel Medicine (SLAMVI).Travel Med Infect Dis. 2014 May-Jun;12(3):208-18. doi: 10.1016/j.tmaid.2014.04.004. Epub 2014 Apr 25. Travel Med Infect Dis. 2014. PMID: 24821081 Review.
Cited by
-
A combined neural ODE-Bayesian optimization approach to resolve dynamics and estimate parameters for a modified SIR model with immune memory.Heliyon. 2024 Sep 24;10(19):e38276. doi: 10.1016/j.heliyon.2024.e38276. eCollection 2024 Oct 15. Heliyon. 2024. PMID: 39391478 Free PMC article.
References
-
- Sharma A, Ahmad Farouk I, Lal SK. Covid-19: A review on the novel coronavirus disease evolution, transmission, detection, control and prevention; 2021. Available from: https://www.mdpi.com/1999-4915/13/2/202/htmhttps://www.mdpi.com/1999-491.... - PMC - PubMed
-
- Bernacki EJ, Hunt DL, Yuspeh L, Lavin RA, Kalia N, Leung N, et al.. What industrial categories are workers at excess risk of filing a COVID-19 workers’ compensation claim? a study conducted in 11 midwestern US States. Journal of Occupational and Environmental Medicine. 2021;63(5):374–380. doi: 10.1097/JOM.0000000000002126 - DOI - PMC - PubMed
-
- Singhal T. A Review of Coronavirus Disease-2019 (COVID-19); 2020. Available from: /pmc/articles/PMC7090728//pmc/articles/PMC7090728/?report=abstracthttps://www.ncbi.nlm.nih.gov/pmc/articles/PMC7090728/. - PMC - PubMed
MeSH terms
Substances
LinkOut - more resources
Full Text Sources
Medical
